
Abstract
Some mechanical systems, such as steering, brakes, and suspension, critically affect the safety of the vehicle. These systems are subject to wear through use and time, changing their status throughout the lifetime of a vehicle. It is, therefore, essential to develop adequate components and procedures of inspection that ensure the correct operation of these systems. Moreover, the steering inspection must guarantee certain requirements, such as, being able to test any vehicle steering system and being low priced. In addition, one of the most important requirements for any inspection procedure is to provide the measurements in a short time. This fact conditions the measurement process and sensors to be employed. The current steering system that measures the steering angles is time consuming. The aim of this research is to introduce a steering system inspection based on forces measured by means of a dynamometer plate. The main features of the proposed system ensure minimum testing time, and simple operation and avoid manipulation of the vehicle. In addition, precise and objective limits for acceptance and rejection have been established. Therefore, the proposed procedure meets all the requirements for the periodic motor vehicle inspection (PMVI).
1. Introduction
The growing importance of road safety requires various stakeholders to consider in detail all the parameters affecting traffic accidents. Currently, one of the points to be reviewed in the periodic motor vehicle inspection (PMVI) is the state of the automotive steering system [1–4]. However, despite the importance of the device and its influence in traffic accidents [5–12], nowadays, the inspection procedure does not show a clear criterion for accepting or rejecting a vehicle based on its directional characteristics. Moreover, the inspection procedure should be simple, reliable, inexpensive, and quick. The objective of this study is to propose a new steering inspection methodology that complies with these requirements.
The measurement of forces in the tyre-road contact allows knowing how the steering and suspension systems control the tyre position on the ground and, thus, assess the safety of the vehicle [13–16]. The main steering angles are camber, toe, kipping, and caster.
Caster and kipping angles are characteristics of the steering axle, whose influence is focused on the handling and smoothness of the steering system. They also have a decisive influence on the self-aligning moment [17, 18]. However, these angles cannot be modified except in case of accident or major reform. This is not the goal of the conventional inspection.
On the other hand, the camber is responsible for much of the dynamic characteristics of a motor vehicle [19]. This angle is closely related to the operation of the suspension system. However, it is a parameter that is not adjustable on most vehicles and this greatly reduces the probability of mismatch. Moreover, the measurement process was developed for stationary conditions in which the movements of the suspension system are very subtle and, therefore, the dynamic variation of camber and its influence on the forces is small.
Toe angle (Figure 1) is defined as the angle between the middle plane of the wheel and the vertical plane parallel to the longitudinal axis of the car. It is necessary to distinguish toe-in, front part of the tires closer than rear part, from toe-out, rear part of the tires closer than front part. It is the main responsibility for generating lateral force during steady state straight movement [21, 22], being a relevant angle in other vehicle operating conditions [23, 24]. In this way, several studies have been developed and published to demonstrate toe angle influence on automobile dynamic behaviour [23, 25]. One example is shown in Figure 2, where the same vehicle with three different toe angles (light gray = 0°, black = 1.5°, and dark gray = 3°) follows a double lane change test (DLC, standard ISO TR-3888-1). It is necessary to take into account that toe angle is a geometrically set angle and slip angle is result of the tyre strain. However, the consequences of both angles are equivalent. As depicted in the figure, the larger the angle the worse the dynamic behaviour.

Toe-in angle adjusted for the front axle.
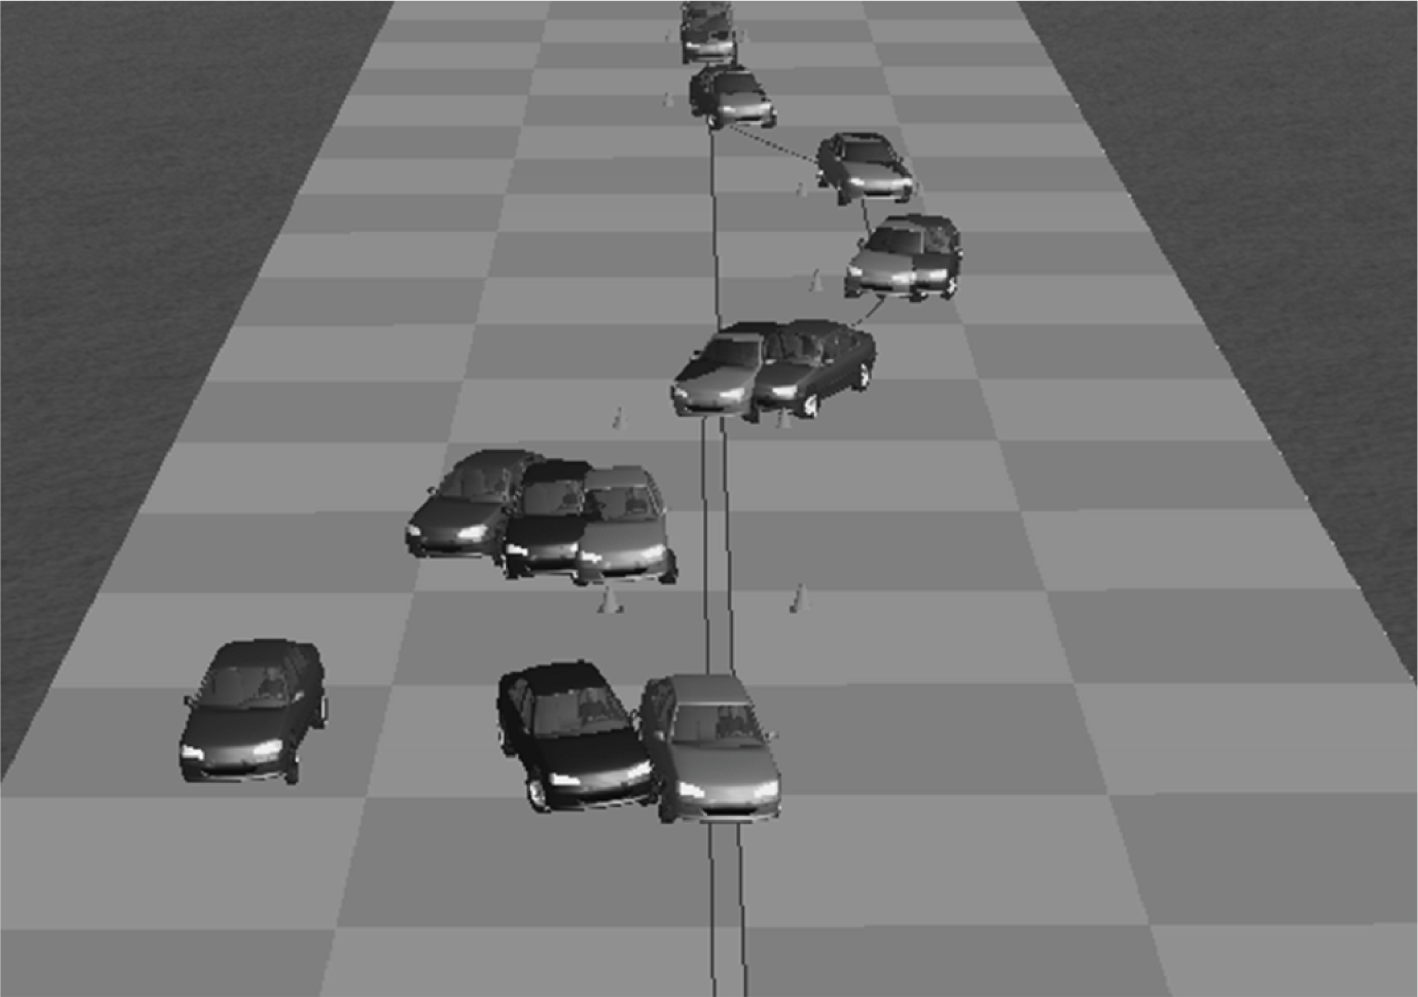
DLC test. Three vehicle different trajectories with different toe angles: 0° (light gray), 1.5° (black), and 3° (dark gray). Vehicle longitudinal speed: 60 km/h.
Toe angle is also the best angle to define the state condition of the steering system, being tuneable in the majority of motor vehicles [26, 27]. This makes this parameter the main object of study in order to establish an appropriate procedure for the steering system inspection.
Furthermore, it is necessary to highlight that the growing number of traffic retarder elements, such as speed bumps, is directly related to the steering misalignment, affecting specifically toe angle settings. It is, for this reason, that, nowadays, a good inspection of this system is particularly important to guarantee safety conditions in vehicles [28].
Due to the fact that the tyre forces are strongly influenced by the wheel steering angles, the analysis of such forces would reveal the steering system state condition. Therefore, the objective of this study is to propose a novel procedure to inspect the vehicle steering system operation state by means of the measurement of forces on the tyre-road contact patch.
In order to detail the inspection procedure and explain its necessity, a brief description of the current inspection procedure and the proposed one, defined by experimental studies, are shown in the following paragraphs.
2. Current Procedures for Steering System Inspection
There are several systems that allow a more or less direct measurement of the steering angles like the one depicted in Figure 3. These devices are used only in exceptional cases such as the vehicle accidents that may have caused structural damage. In terms of vehicle inspection, a widespread usage of these devices is infeasible due to their high cost and for being very time consuming. These kinds of systems are usually available in manufacturer vehicle dealers and vehicle repair shops.

Wheel steering sensor of the steering angle meter system.
The most widely implanted system for rapid inspection is the sideslip tester [29]. The objective of this device is a quick testing of the parallelism (lateral deviation) between wheels. In automobiles, this test can be performed for the front and rear axles [20].
This equipment has a steel plate which can move transversely to the direction of vehicle motion. One of the wheels is resting on the plate, which moves laterally due to the toe angle, while the other one is on the ground. The plate moves according to the lateral forces exerted by the wheels, as shown in Figures 4 and 5.
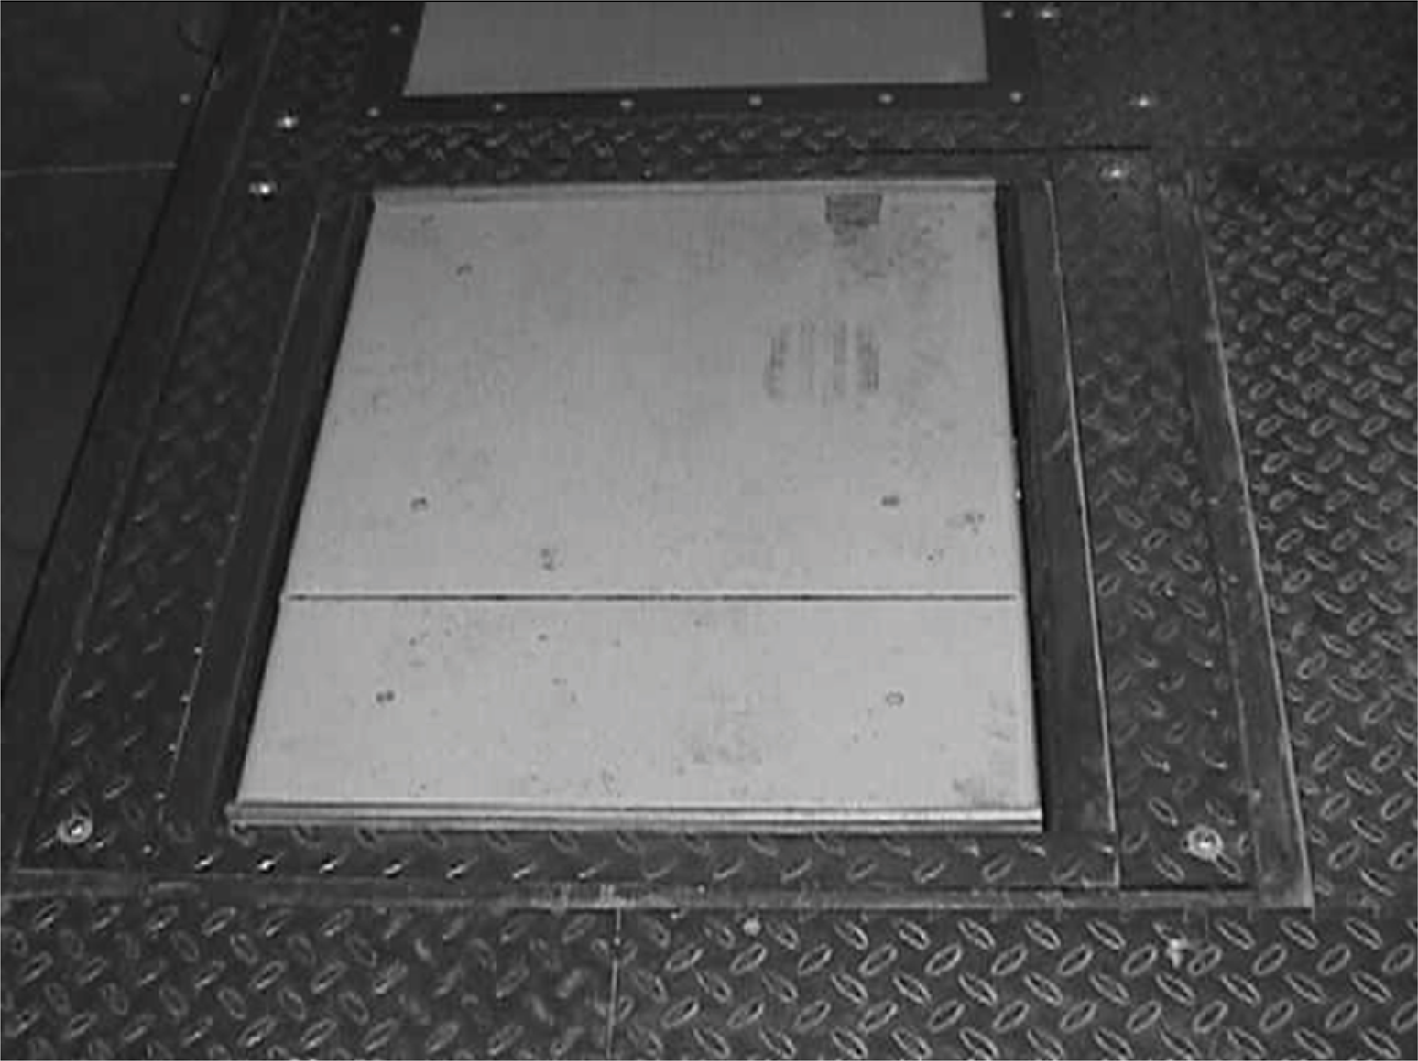
Sideslip tester.

Operating diagram of the sideslip tester [20].
The movement of the plate generates an electric signal which is processed. The equipment finally shows the lateral displacement, in meters, per longitudinal distance, in kilometres, travelled by the vehicle. Some devices have a first plate to relax any residual force that could affect actual measurement and two switches that detect the entry and exit of the vehicle at the plate. In fact, the system measures the lateral displacement in millimetres per meter run lengthwise plate, but the result is shown in an indicator with units of meters per kilometre. The measurement process is performed gradually along the entire length of the plate, and the result is calculated as the relative difference between the position of the plate when the wheel enters and the maximum displacement of the plate during the test.
In Figure 6, the difference between measurements carried out with compensation plate, to relax any residual force, and without compensation plate is depicted.

Sideslip measurement: effect of the compensation plate [20].
The plate measures the deviation of the tyre on the path set by the driver. This deviation from the path means that there is a slippage between tyre and road. This system shows certain drawbacks which lead to a progressive loss of confidence on the recorded results. At the moment, the contribution of some variables to the results reached with the sideslip tester (pressure and vertical force, mainly) is not well known, whereby different vehicles seem to show different results depending on their weights. For this reason, this device is being mainly used to support the inspector opinion but not to determinate by itself the state condition of the steering system.
3. Test Methodology
The main tool used in the development of the experimental study is the dynamometer plate, shown in Figure 7. This device allows characterizing the forces in the tyre-road interface. A dynamometer plate consists of a metallic plate supported by eight load cells which measure the forces in the vertical direction and in the contact patch (longitudinal and lateral forces). The dynamometer plate allows a complete force and momentum measurement on a three-dimensional reference system at several conditions: different speeds (it has been checked that force measurements are independent from the speed in the range 0–40 km/h), loads, and geometrical positions. It is important to emphasize that, in this measurement process, data are carried out through the forces transmitted by friction. The plate is linked to the frame by load cells which record the forces generated in the contact patch and those forces are transmitted by friction to the dynamometer plate. The plate has high stiffness, which ensures a direct measurement of the forces generated in the contact patch, allowing testing the tyre in real operating conditions mounted in any vehicle [30–32]. On the other hand, considering the possible implementation of this device as part of the real inspection system, its reliability has been proved. This system has been used over a period of five consecutive years without any malfunction, and calibration results demonstrate that it performs as originally set by the manufacturer.
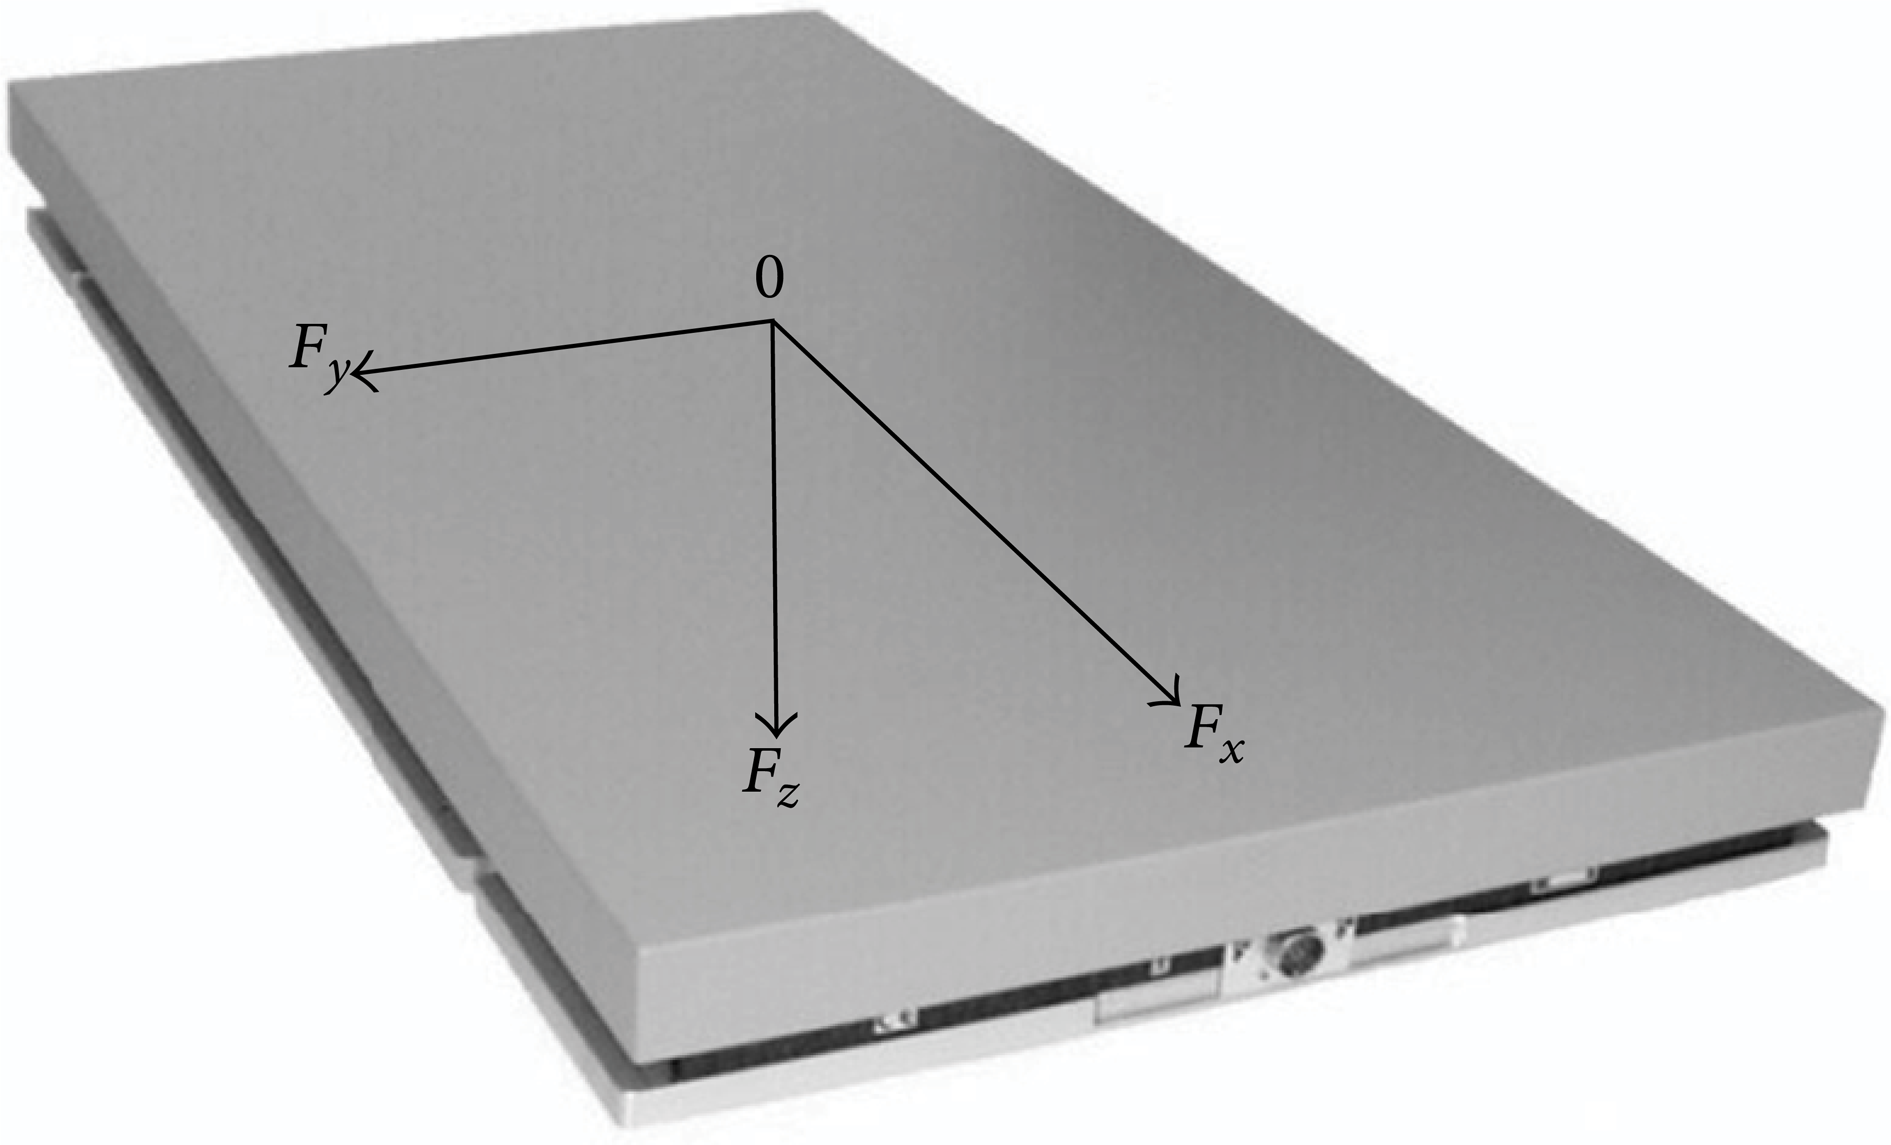
Coordinate system of the dynamometer plate.
The signal provided by the dynamometer plate is acquired and conditioned for further processing in a computer, as depicted in Figure 8. It is necessary to take into account only the centre part of the plate, which accounts for the steady state zone. The tyre entry and exit from the plate—transient signal, identified in Figure 8—should be omitted. An average value of the stable representative part for each analysed force must be chosen.
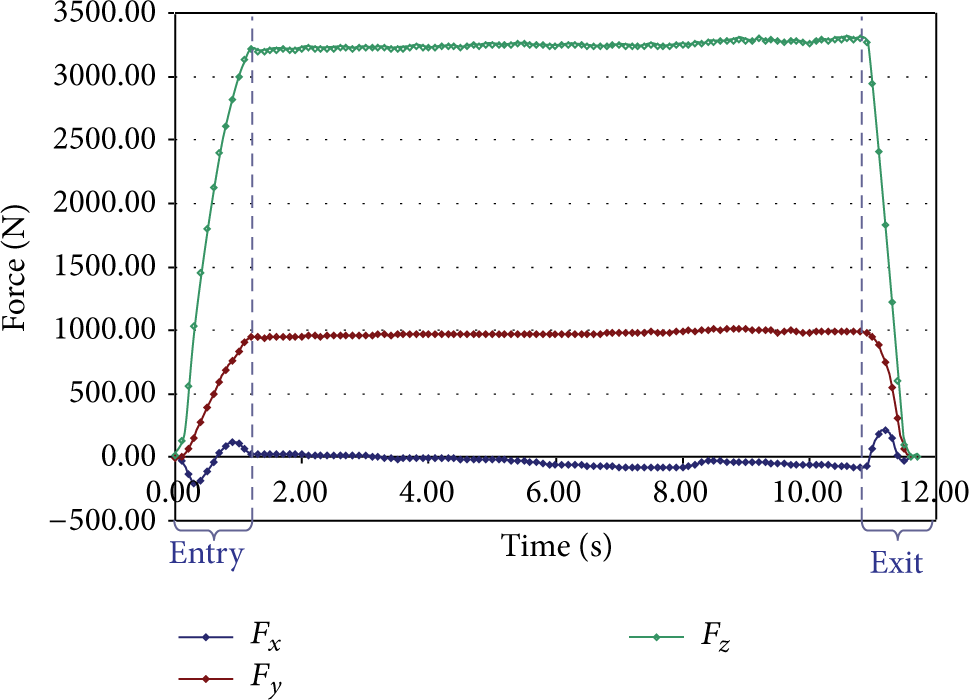
Example of tyre measured forces.
The measured longitudinal effort shows a very low value because of the steady state conditions. The measured value is directly related with the rolling resistance which is necessary to overcome in order to guarantee the rolling conditions. In these conditions, the aerodynamic and gravitational resistances are negligible and it is only necessary to take into account the rolling resistance to keep a constant velocity. To achieve a constant velocity travelling condition, a specific pull system, as depicted in Figure 9, was developed. A comparison of the measured tyre forces using and not using the pull system was performed. It was possible to note that the variability in lateral and vertical forces was null and that it only influences the longitudinal force measurement. Taken into account that the aim of this study is focused on the measurement of lateral tyre forces to evaluate toe angle, it was decided to avoid using this device in the benefit of reproducing real vehicle inspection.

Developed pull system to maintain a constant velocity.
For the forces measurement in the tyre-pavement contact different tyres and vehicles have been arranged. Initial investigations were carried out with a single vehicle, modifying toe angle, inflation pressure, vertical load, and type of tyre. This has allowed establishing a relationship between toe angle and lateral force transmitted to the pavement under the influence of other variables. From this study, we proceeded to measure the lateral force in a representative number of vehicles in order to generalize the extracted results.
The test methodology employed consists of three stages, shown in Figure 10:
setting the test conditions: steering angles, pressure, and vertical force;
dynamometer plate measurement: with the conditions set on the previous stage, the measurement has been repeated 10 times in order to minimize errors;
data analysis: finally, the data is analysed checking if the 10 measurements have been correctly done; a statistical analysis is also performed.
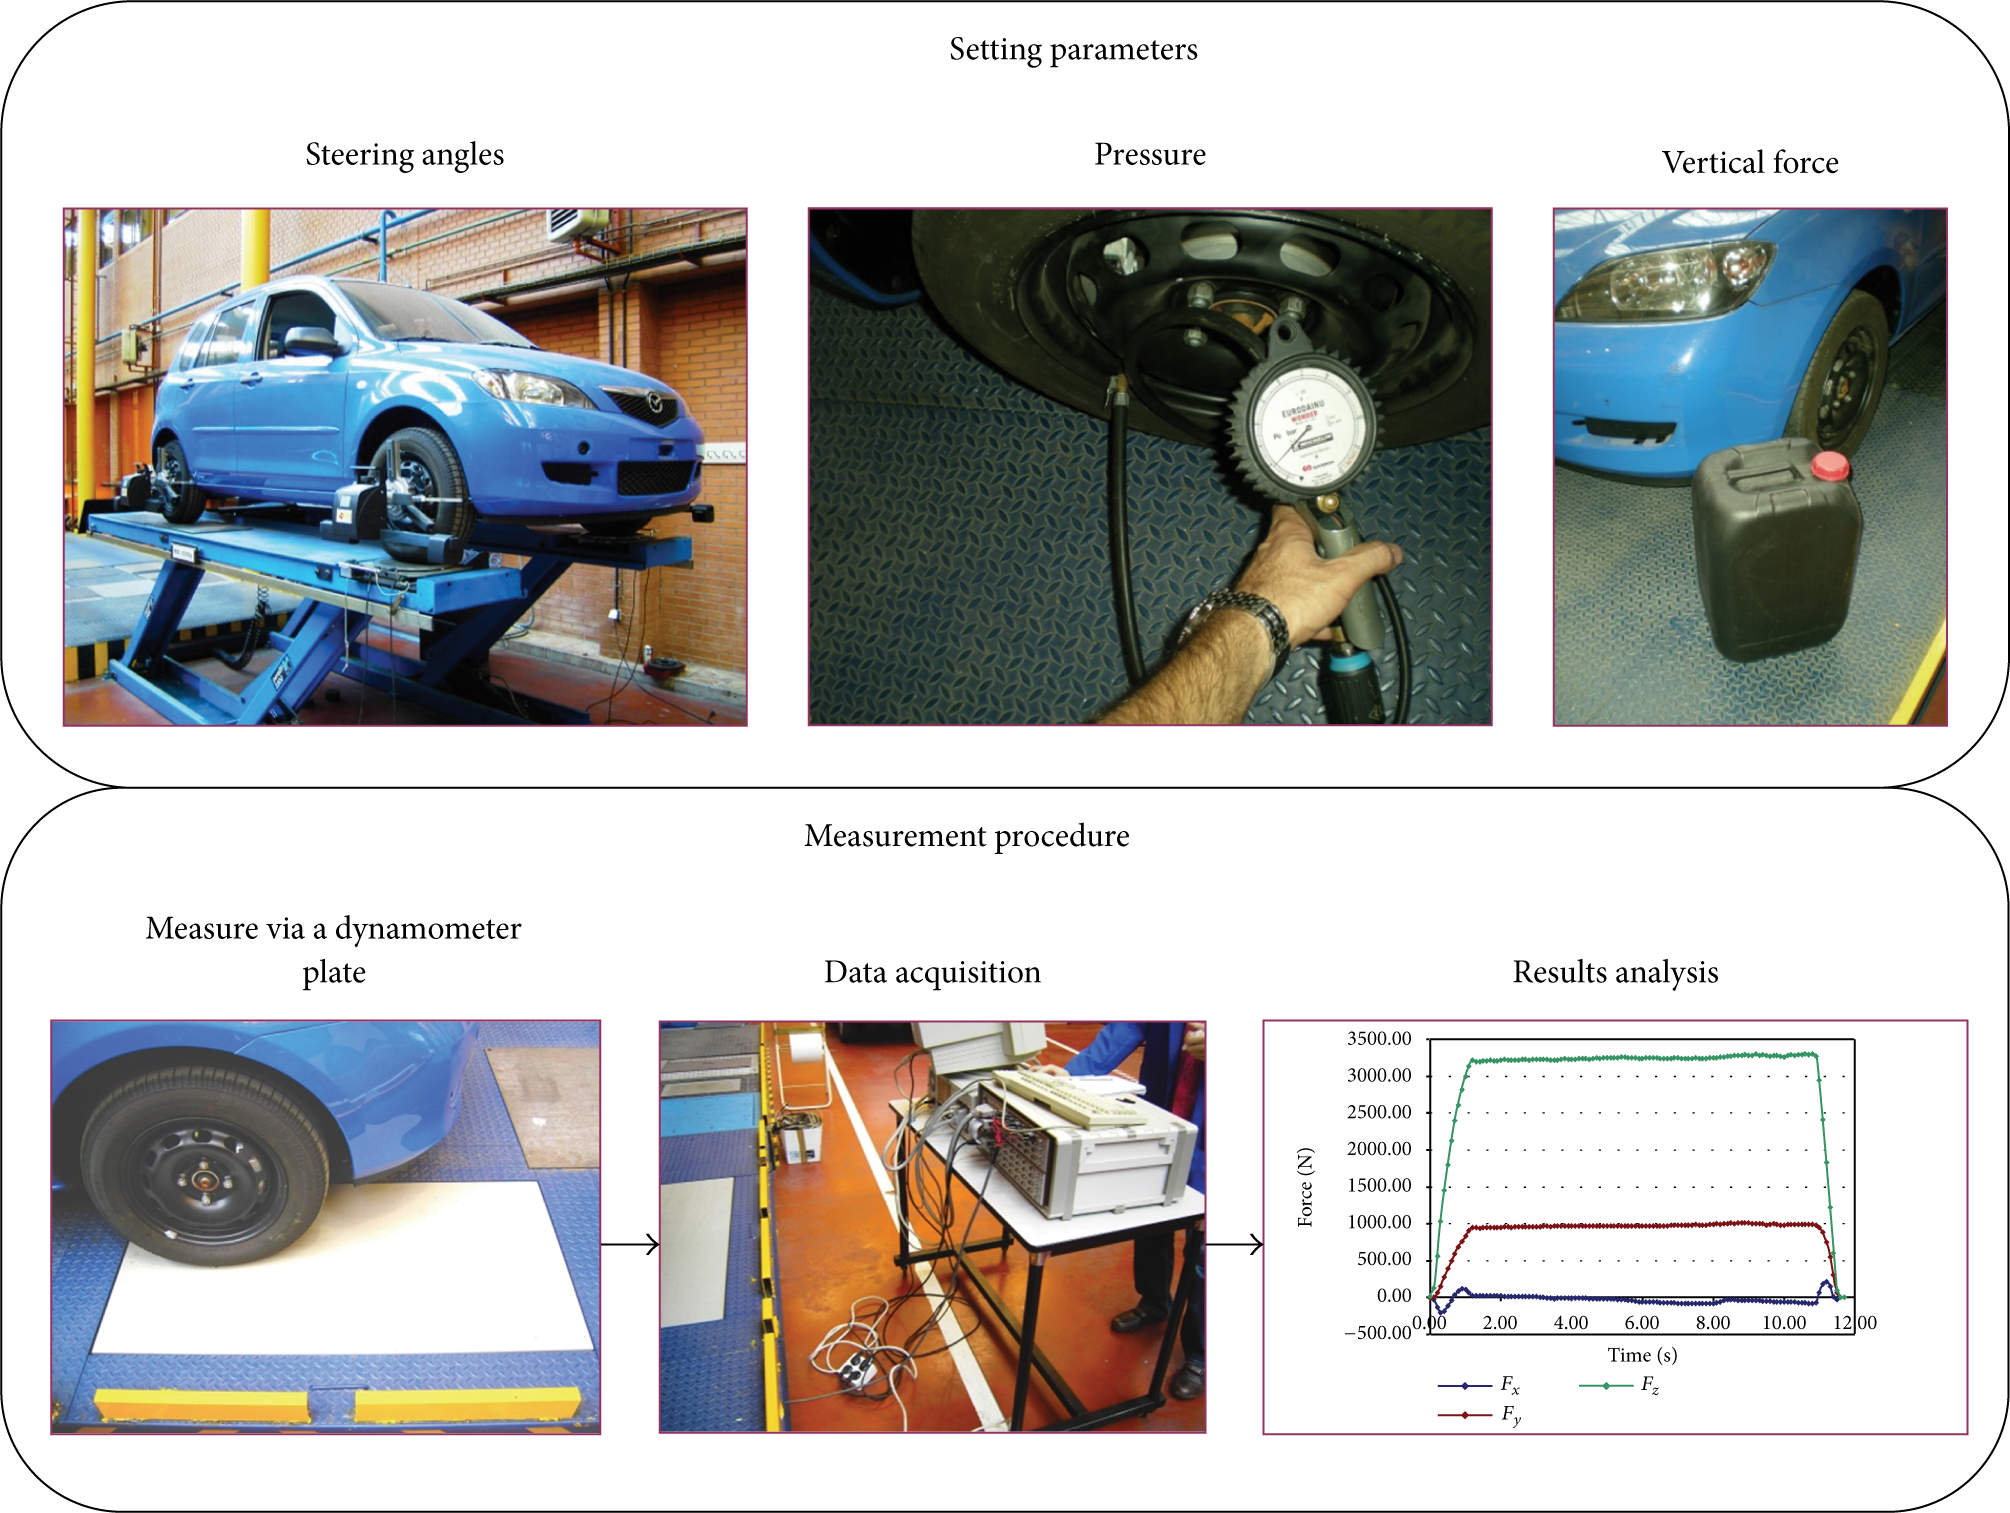
Test methodology for vehicle steering measurement.
Variations in test conditions have been conducted in order to take into account any situation of vertical force, pressure, or steering angles that can be given in a usual inspection procedure, as shown in Table 1.
Analysed variables and ranges.

The addition of toe angles for both wheels of the front axle, which is the main variable of interest, is defined as the total toe angle or toe angle.
The vertical force shown in the Table 1 is measured in the right front wheel. The difference between the maximum and the minimum values, 750 N, shows the effect on this wheel when the vehicle is fully loaded at a maximum load of 3500 N.
4. Influence Parameters of Generated Lateral Force
Initially, by means of a geometric model, it was possible to identify the influence of the toe angle in the process by which lateral force is developed. As depicted in Figure 11, during vehicle straight line movement with null toe angle (α = 0), the free movement of the tyre is equal to the vehicle movement. However, during vehicle straight line movement with a certain tyre toe angle (α≠0, real driving), a free tyre would try to follow a different path from the one described by the vehicle chassis. The vehicle chassis does not allow the tyre to describe its own path. This phenomenon generates a lateral force, and the larger the toe angle, the larger the lateral force:

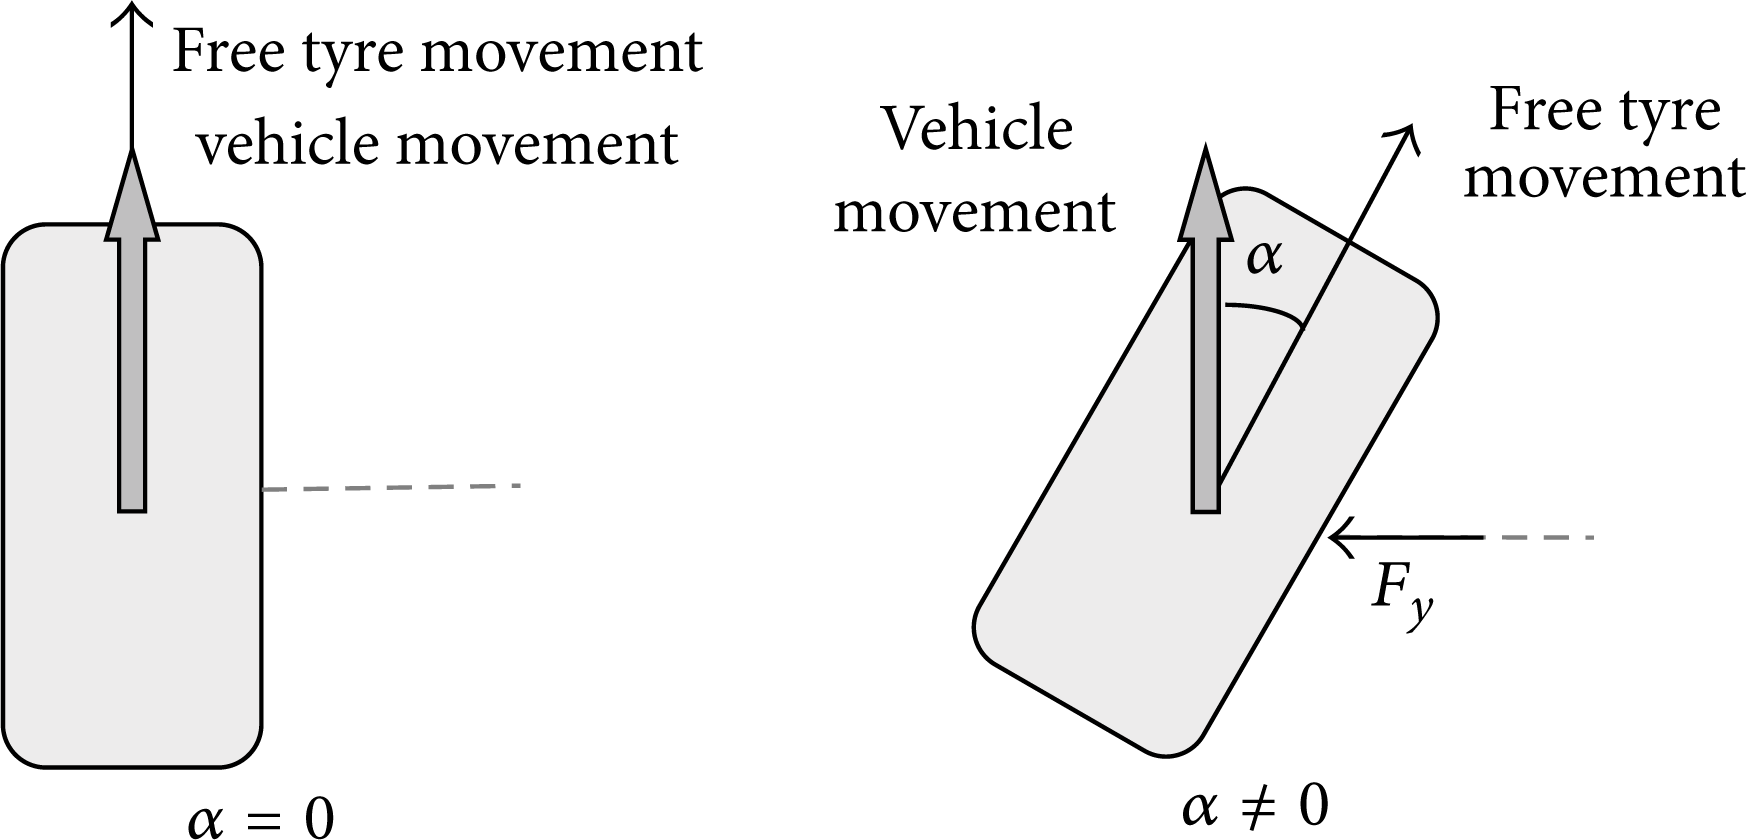
Geometric tyre model.
The generated lateral force depends, among other factors, on the stiffness of the tyre. For this reason, changes in parameters, such as pressure, temperature, vertical load, and friction coefficient, which also influence tyre stiffness, modify lateral force. Previously, a complete model to analyse the contact tyre-road and the influence of all these parameters was developed [32]. The model yielded (2) and (3). Consider

Equation (2) expresses the dependence of the lateral force, F y , and the three main variables: pressure (p), vertical force (F z ), and toe angle (α), through six experimental coefficients (φ, ϑ, κ, λ, and σ). Consider

Equation (3) expresses the dependence of the longitudinal force, F x , and the same three main variables (p, F z , and α), through four experimental coefficients (β, Ω, Ψ, and τ).
These expressions provide very accurate information for the behaviour of one specific tyre mounted in a specific car. However, for the purpose of an inspection, they cannot be directly applied and should be simplified. It is possible to identify F x as being not an important variable from the point of view of the steering inspection and it just could be used as complementary information. On the other hand, toe angle, the main parameter to evaluate the steering system at current PMVI, is also the main responsible for the lateral force generated during this type of test [30, 32]. Furthermore, by means of experimental analysis of data from many different vehicles, it can be conclude that F y can be represented in every case by means of one straight line which is close to zero when toe angle is null, as is expressed in (4). Consider

Analysing the previous study, it is possible to conclude that the most important variable that defines the steering condition state and stability of a vehicle is the required lateral grip and not the toe angle. The relationship of these two parameters could be known but it depends on many factors and it is necessary to know various characteristics of the vehicle and the tyre to establish it accurately. However, if the inspection is focused on force measurement, the analysis of vehicle stability is easier and direct, complying with inspection time request.
5. Experimental Analysis of the Relationship between Longitudinal and Lateral Required Grip
Experimental analysis of the relationship between longitudinal and lateral adherence applied allows knowing the conditions in which the vehicle is working and the grip required in the interface. By controlling the measurement conditions and studying the results recorded by the dynamometer plate, it is possible to establish which steering system state conditions are correct, yielding approve inspection result and the corresponding value of the adherence limit for those conditions. If the vehicle needs too much grip during straight line driving, it means that it will require an important part of the total available adherence. This means that the vehicle will have fewer available lateral grips in severe manoeuvres. This experimental research provides with acceptance or rejection limits for the inspection of the steering system for motor vehicles.
From several tests in which longitudinal and lateral forces are measured, it is possible to analyse the way in which the tyre uses grip in both directions. To do this, different charts have been done to show the longitudinal required grip μ x = F x /F z and the lateral required grip μ y = F y /F z , transmitted by the tyre to the plate and recorded by it. Results for each one of the three sets of tyres tested have been analysed. Thus, it is possible to check whether the conclusions drawn are general or, conversely, particular and depend on each kind of tyre.
In Figure 12, the values measured for the various pressures, vertical forces, and toe angles analysed are shown, obtaining 210 points that let us summarize the test with the three sets of tyres. It is worth emphasizing that each point is obtained from the average of ten repetitions performed in each test. That is, each of these graphs contains information from 2100 tests, which statistically represents a significant amount, especially if the high repeatability obtained is taken into account.

Lateral required grip versus longitudinal required grip for different toe angles. Three different sets of tyres have been used.
The points obtained, shown in Figure 12, are stratified depending on the toe angle. Moreover, the fact that these measurements, for the same toe angle, have been made for different pressures and vertical forces and, despite this, are clearly grouped together allows drawing independent conclusions for each variable. In addition, it is also observed in the three sets of tyres that variability in the data increases with increasing toe, either with a positive value or with a negative one. This is because the greatest toe angle shows the greatest resistance to drive the vehicle and prevents achieving vehicle constant travelling speed. This variability is especially pronounced in the longitudinal required grip, influencing also the lateral force, which explains the reason for a less clear stratification with increasing toe angle.
For the test vehicle, the manufacturer sets a toe angle of 0.15° on each wheel of the front axle, resulting in a total toe angle of 0.3°, with a range of allowable values between 0.2° and 0.4° for the total toe angle. That is, lateral required grip values, μ y , between 0 and 0.07 imply appropriate values of toe angle.
The axis defined by μ x = 0 has been taken as axis of symmetry, because the lateral required grip depends on the kind of vehicle. The value of lateral force will be positive or negative depending on whether the vehicle has traction on rear or front axle. This phenomenon has been taken into account when defining proposed limits [30] for inspection procedure.
From the experimental results depicted in Figure 12, it is possible to define an operation zone that limits the optimum values of tyre adherence. Limiting tyre adherence is equivalent to limiting tyre force, which is strongly dependent on toe angle. Therefore, by defining the optimum operation zone for tyre adherence, the optimum operating range for toe angle is also being limited.
Three different categories of failure have been proposed to identify major faults, minor faults, and the optimal state of the system, in order to follow the guidelines set by the International Motor Vehicle Inspection Committee, CITA [1].
Proposed limits of acceptance/rejection for the inspection procedure are as follows:
acceptable values:

lateral requested grip values attributable to minor faults:

lateral requested grip values attributable to serious weaknesses:
Defined limits imply the acceptance of those vehicles with a total toe angle between −0.8° and 0.8°, with this range being the most common for any type of passenger vehicle. Those vehicles that have a total toe angle between −0.8°/0.8° and −1.2°/1.2° are susceptible of doubt, although these values seem to be too high to have been set-up by the vehicle manufacturer. Finally, those vehicles with a total toe angle outside the range set by −1.2°/1.2° suffer some type of failure in the steering system and must be checked and repaired.
From the point of view of the vehicle dynamic behaviour, considering a reference value for lateral grip of 0.75, the proposed rejection value (0.15) is 20% of the total grip. Therefore, if the vehicle is consuming that amount of grip during a straight line motion, its dynamic performance during cornering is considerably reduced in these conditions.
Defined limits on longitudinal required grip are due to increased variability in the longitudinal forces when the toe angle increases. As it has already been mentioned, in inadequate conditions for toe angle, it is more difficult to maintain the speed of the vehicle constant, which is a symptom of failure in the steering system. It is, therefore, recommended to repeat the test to exceed the limits defined for the longitudinal required grip in order to ascertain the cause of that value. If the value continues to be elevated, it may be considered that the vehicle has some sort of glitch in the steering system.
Comparable results can be obtained by plotting lateral force versus longitudinal force, obtaining very similar figures. However, when these forces are nondimensionalized with the vertical force, the influence of that variable is being eliminated, and it is also possible to set much more clear and precise overall limits.
Thus, it is possible identify and draw over Figure 12 the proposed limits, as depicted in Figure 13.

Lateral required grip versus longitudinal required grip for different toe angles and tyres. The proposed acceptance limit is represented by the limits of the outer rectangle and optimal values are inside the inner rectangle.
6. Test with a Representative Number of Vehicles
To verify that the results are general and applicable to the maintenance and inspection of conventional vehicles, a statistically representative number of tests have been performed. Results obtained from 67 motor vehicles that belong to vehicle category below 3500 kg (cars and vans) have been analysed. The conclusions are shown in Figure 14.

Lateral required grip versus toe angle for 67 vehicles tested. The acceptance limit proposed is shown by an outer rectangle and optimal values are shown by an inner rectangle.
The lateral required grip depends mainly on the toe angle set in the vehicle, as explained above. This behaviour can be defined by a straight line, as depicted in Figure 14. However, this line does not show with enough accuracy the relationship between toe angle and lateral required grip, because there are other variables of minor importance that modify this relationship. For this reason, the force measurement, which clearly identifies the state condition of the steering system, is proposed as the new inspection methodology. This methodology is the best way to know the real state condition of the steering system, taking into account all the variables of influence and the required grip in real operating conditions.
The equipment that was used for direct measurement of steering angles has a large database. This database includes the allowable values for each steering angle and it is defined by the different vehicle manufacturers. This information allowed comparing the measured values with design values set by the manufacturer and tolerance intervals for different steering angles. The proposed limits, shown in Figure 14, define the appropriate values of toe angle. In all analysed cases, the value of the total toe angle is greater than 1.2° when it is required to correct the parameter. Analysing the three cases which exceed the proposed limits (these cases have been marked with circles in Figure 14), which have occurred in these tests, all three do not have an adequate value of the angle of convergence. There are also three cases over the line between minus faults and the optimum values. These cases have been analysed, and two of them are correct but they are not the most adequate values and they are very near to the limit established by the manufacturer of the vehicle. Therefore, it is concluded that the error of the proposed methodology is below 3%.
The other tested vehicles have their toe angles within the recommended ranges by the manufacturers.
Thus, the proposed test methodology has been validated and it is suitable to establish, for vehicle periodic motor inspection, the limits of acceptance and rejection by means of a dynamometer plate.
7. Validation of the Proposed Limits by Means of Simulation
As the proposed limits should guarantee the correct behaviour of the car in severe manoeuvres, DLC test was simulated for the test car and for all the cars available in CarSim database. Testing all the cars at the same conditions (standard ISO TR-3888-1), it is possible to compare the maximum lateral deviation of the car depending on the toe angle. The lateral deviation is measured from the reference of the optimal trajectory for every vehicle. It is important to highlight that lateral deviation is a direct measure of a potential risk of steering fault, revealing a difficulty to keep the vehicle under control along the trajectory.
For the tested vehicle, as depicted in Figure 15, the larger the toe angle, the higher the lateral deviation. Specifically, for this vehicle, the proposed limits showed lateral deviation up to 1.2 metres for major faults cases and between 0.6 and 1.2 metres for minor faults.

Lateral deviation of test vehicle in standardized DLC simulation. Speed: 60 km/h.
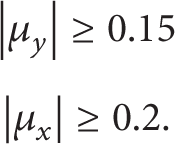
As depicted in Figure 16, reproducing the same test of the Figure 15 with different vehicles (for all the vehicles available in CarSim database), the result is equivalent. In this case, the minimum lateral deviation for the value of 0.1 of lateral required grip is 0.6 metre and the minimum deviation for 0.15 (limit for major faults) is 1 metre.

Lateral deviation of seven different vehicles in standardized DLC simulation. Speed: 60 km/h.
Although it is very difficult to try to establish where the most adequate limit for acceptable/unacceptable lateral deviation is, it is objectively true that values over 1 metre for the lateral deviation in DLC test are potentially dangerous. So, the representativeness of the proposed limits for the PMVI in relation to the dynamic behaviour of the vehicle is demonstrated.
8. Conclusions
Under the experimental results obtained, it is possible to infer the following conclusions.
To establish a proper inspection procedure, it is necessary to satisfy the general principles defined by the international authority CITA [1]: the inspection process should be as easy, quick, and straightforward as possible, not being able to carry out any disassembly of vehicle components and parts.
Currently, the device used in the inspection procedure, called sideslip tester, meets the general requirements set by CITA but does not allow objective and precise conclusions.
For proper inspection, it is necessary to perform a visual check of the system and tyres, to find major defects such as fails or inadequate steering angles. However, if the tyres have been recently changed, it is difficult to identify inappropriate steering angles; thus, there is a need of new inspection procedures.
The procedure for inspection of the vehicle steering system by measuring forces in dynamometer plate meets the conditions required by CITA, being very successful in identifying inadequate steering angles.
It has been established and justified that the steering angle that mainly affects the screening test is the toe angle, which has a very strong influence on vehicle safety.
Evidence of the objective and accurate proposed procedure of inspection of the vehicle steering system by means of the establishment of limits for acceptance and rejection has been demonstrated.
Finally, the proposed inspection procedure guarantees that the grip used for straight movement is not excessive and that it does not limit the available grip during severe manoeuvres, keeping the vehicle in safe operating conditions.
Footnotes
Appendix
Conflict of Interests
The authors declare that there is no conflict of interests regarding the publication of this paper.
Acknowledgment
The authors would like to gratefully acknowledge the Spanish Science Ministry, as part of this research was done under the funding of the National Research Program (Project TRA2004-03976/AUT).