
Abstract
The macroscopic regularities of heat and mass transfer and phase transitions during water droplets motion through high-temperature (more than 1000 K) gases have been investigated numerically and experimentally. Water droplet evaporation rates have been established. Gas and water vapors concentrations and also temperature values of gas-vapor mixture in small neighborhood and water droplet trace have been singled out. Possible mechanisms of droplet coagulation in high-temperature gas area have been determined. Experiments have been carried out with the optical methods of two-phase gas-vapor-droplet mixtures diagnostics (“Particle Image Velocimetry” and “Interferometric Particle Imaging”) usage to assess the adequateness of developed heat and mass transfer models and the results of numerical investigations. The good agreement of numerical and experimental investigation results due to integral characteristics of water droplet evaporation has been received.
1. Introduction
Processes of heat and mass transfer and phase transitions during water droplet motion through high-temperature gas areas are of the utmost interest because of many [1–5] supplements (e.g., power stations with gas-vapor coolants, fire suppression systems by “water mist” and “vapor-water” clouds, techniques of granular medium defrosting and different materials surface processing by gas-vapor-droplet flows). But it is very difficult to realize the determination of temperatures and concentrations of evaporation products in the trace and small neighborhood of water droplets moving through high-temperature gas area with usage even of high-speed measurement technique; for example, see [6–9]. Furthermore, droplet surface configuration [10, 11], position relative to streaming flow motion direction [12, 13], droplet rates and motion trajectories [13], evaporation [14, 15], convective currents inside droplets and other factors can influence on integral characteristics of droplet motion through high-temperature gases. It is rather problematic to investigate experimentally these processes and factors influence. So it is expediently to conduct the numerical investigations of concerned processes with usage of models which take into account heat and mass transfer mechanism features in intensive phase transition conditions.
The purpose of this paper is numerical and experimental investigation of the heat and mass transfer processes and phase transitions regularities during water droplet motion through high-temperature gas flow.
2. Formulation of the Problem
The scheme with two consistently moving droplets (Figure 1) was chosen at formulation of the heat and mass transfer problem. It is possible to investigate the regularities of heat and mass transfer and phase transitions in high-temperature gas area for both single droplets and its few aggregate with such scheme usage. It is shown in [16, 17].

Scheme of problem solution domain: 1—high-temperature gas area, 2—water droplets.
It was supposed that droplets moved at some initial distance to each other (L n ) under action of gravity and resistant forces in space thick with high-temperature gases. It was accepted that droplet initial temperature Θ0 was significantly lower than gases temperature Θ f . It was thought that droplets were warmed-up. The evaporation was at “liquid-gas” boundary. Water vapors were injected into high-temperature gas area and admixed with heated gases. Vapor-gas mixture temperature at immediate vicinity of droplets decreased in consequence of endothermal phase transition and vapor injection. Droplet sizes decreased (the distance between them relative to initial value L n changed accordingly) under intensive evaporation conditions. The evaporation of droplets moved first in aggregate (Figure 1) was completed after some time (it was considered as a complete evaporation time). Every other droplet evaporated similarly.
The following assumptions were made in formulating the heat and mass transfer problem.
Gas area is binary (“high-temperature gases-water vapor”). The gas component composition is not detailed at numerical simulation because it is not changed significantly for combustion processes of substances and materials wide group. The results analysis [3–5] shows that the detailed description of gas mixtures component composition cannot influence considerably on solidarity of formulating the problem. So it is expediently to use the binary mixture model at numerical simulation of heat and mass transfer and phase transition processes.
Droplets have the shape of cylinders (Figure 1). They are extended in the motion direction. Their configuration is not changed during the flight. In general water droplets are deformed [5] during motion through gas area under action of inertial and surface tension forces as a rule. Droplets assume different shapes (mostly “drop-shape,” which corresponds to its name) [5]. It is near-impossible to undertake the numerical simulation of heat and mass transfer processes (including phase transitions) complex in the area with movable inner boundary of such configuration. So one of the investigation objectives is to choose the droplet shape which is the maximum approximate to real ones at numerical simulation. Most probably, the cylinder (Figure 2), symmetry axis which is the same as droplet motion vector direction, is the best possible variant of droplet configuration interpretation.
Droplet surface deformation is not taken into account. Videograms analysis [5] carries inference that it is not realistic to take into account the droplet shape dynamic change due to its surface deformation at numerical simulation. Furthermore, it is known [5] that the total area of evaporation during droplet surface deformation is practically unchanged.
Droplet breakage (decay) is not considered. The probability of disintegration is sufficiently small [5] with low (essentially subsonic) rates and droplet sizes, and also short times of their complete evaporation. The Weber number does not exceed 5 [16, 17] during variation of the main parameters in rather wide diapasons under concerned conditions.
The repulsive and gravity processes of droplets are not kept in mind because such processes can influence considerably during droplet motion through rarefied gases. These processes are insignificant for concerned conditions of droplet evaporation.
The Soret and Dufour effects influence on heat and mass transfer conditions are not accounted. The Soret effect is exerted more significantly (diffusion-current density changes within 5%) than the Dufour effect (heat-flux density changes less than 0.1%). But the first effect does not have the defining role in whole complex of heat and mass transfer processes [16, 17] nevertheless.

Schematic image of moving droplet: 1—droplet in shape of cylinder.
3. Mathematical Model and Solution Procedures
Mathematical model includes the next system of nonlinear nonstationary differential equations with partial derivatives (0 < τ < τ d ) as follows:

Initial (τ = 0) conditions (Figure 1): Θ = Θ0 at 0 < R < R L , 0 < Z < Z1, Z2 < Z < Z3, Z4 < Z < Z L ; R1 < R < R L , Z1 < Z < Z2, Z3 < Z < Z4; Θ = Θ f , γ f = 1, γ w = 0 at 0 < R < R1, Z1 < Z < Z2, Z3 < Z < Z4.
Boundary conditions (Figure 1) are similar to those used in [16]. It was recognized that evaporation and “buffer right zone” formation between droplets and gas area were taken into account at “liquid-gas” boundaries in opposite to formulation of the problem [16] as follows:

The equation of droplet motion under evaporation conditions with allowance for the action of resistance and gravity forces has the following form according to [10–14] at v d (0) = v0:
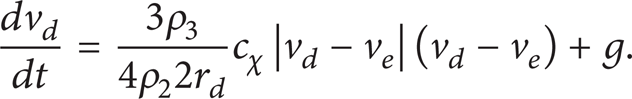
Dimensionless resistance coefficient cχ was determined in accordance with theory [10–14]. In general this coefficient depends on body surface configuration; its location relative to streaming flow motion direction and group of other factors too. Thus, the resistance factor dependence on Reynolds number characterizes the droplet motion rate (v d ) and droplet characteristic sizes (R d , Z d ) influence on resistance force. When approximation of the Schiller-Neumann and Oseen correlation curves for possible diapason of change Re in concerned systems (Figure 1), this dependence has the following form [12, 13]:

The next value was used to determine the resistance coefficient with taking into account the droplet nonsphericity, its nonstationarity motion, evaporation, and convective currents inside the stream-lined by gas flow body [18] as follows:

Geometric coefficient k
g
characterizes the deviation of stream-lined body shape from sphere [1–13]. The correlation 1/(B + 1) is a coefficient which describes droplet evaporation process influence on resistance force) [14]. The expression (1 + (2/3)(μ2/μ3))/(1 + (μ2/μ3)) is a coefficient which takes into account the potential convective currents inside the droplet [10]. The expression
The expression was used to calculate a mass rate of water evaporation [19] as follows:

Evaporation constants were taken equal to β = 0.1 and kβ = 0.4 according to behavior conditions on the basis of [19].
The averaged characteristic droplet size (z m = 1 mm), time scales (t m = 1 s), temperatures (T m = 1000 K), and rates (υ m = 1 m/s) were used as scale values for transition to dimensionless variables.
The system of nonlinear nonstationary differential equations (1)–(6) was solved by finite difference method [20]. The difference analogs of (1) were solved by the locally one-dimensional method [20]. The running method with an implicit four-point scheme was used to solve the one-dimensional difference equations [20]. Nonuniform time (10−8–10−6) and coordinate-grid (10−4–10−2) steps were used to improve the solution exactness of the equations system (1)–(6). The difference grid was condensed near phase transition boundary similar to algorithm [21–23].
The procedure to evaluate the results reliability of executed theoretical investigations is based on verification of employed difference scheme conservatism. The experimental investigations were carried out with optical diagnostic methods usage of two-phase and heterogeneous gas-vapor-droplet mixtures to appraise the water droplet evaporation rates and compare with numerical investigation results too.
4. Experimental Setup and Investigation Methods
The following scheme was chosen at planning of experiment. Water droplets with fixed sizes are thrown off into vertical channel with high-temperature (more than 1000 K) gases. Figure 3 shows the scheme of setup which was used for experimentations.

A scheme of experimental setup: 1—laser generator; 2—solid state lasers for ultrashort pulses; 3—cross-correlation digital camera; 4—PC: personal computer; 5—synchronizer of PC, cross-correlation digital camera and laser; 6—light “pulse”; 7—vessel with experimental liquid; 8—channel of experimental liquid supply; 9—dosing device (atomizer); 10—mount; 11—experimental liquid droplets; 12—cooling liquid channel of laser; 13—cylinder from a heat-resistant translucent material; 14—hollow cylinder with combustible liquid in internal medium; 15—thermocouples; 16—electronic weigher.
The basic elements of setup: cylindrical channel (height—1 m, diameter—0.3 m) 13 filling with high-temperature gases; hollow cylinder 14 in which the typical liquid fuel (kerosene) was filled in and set on fire before the experimentations (combustion products flow-high-temperature gases were formulated in channel 13); cross-correlation digital camera (figure format—2048 × 2048 pixels, frame frequency—1.5 Hz, minimal delay between two sequence figures −5 μs); double pulsed solid-state laser (with an active area of “yttrium aluminum garnet” and neodymium additives, wave-length—532 nm, minimal energy in impulse—70 mJ, maximum impulse time—12 ns, recurrence frequency—15 Hz); synchronizing processor (maximum signal sampling—10 ns); electronic weigher (discretization 10−4 g).
Droplet evaporation characteristics were chosen as objective functions of experiments. They are the changes of water droplet sizes R de and mass m d , motion time through the channel 13 (corresponds to evaporation time) t d , and rates of vapor injection from droplet surface too. The parameters ΔR (ΔR = ((R de –R de *)/R de ) and Δm (Δm = ((m d –m d *)/m d )) were added under review. They characterize the decrease of mass and droplet sizes.
The laser translucence procedure of water droplet motion trajectory was carried out to fix the images of running water droplets. The previous experiments with water showed the usage necessity of specialized admixtures which forward to formulate the running droplet distinct images. For this the “tracers” were added into the water. They are particles of titanium dioxide powder with granular sizes 10 nm. The minimal (0.5%) concentration TiO2 in water was provided. It was enough to receive the distinct “light spot” in the camera focus. The titanium dioxide was used during experiments because it was not dissolved in water and influenced on water evaporation slightly [5].
The dosing device 9 (Figure 3) was used to form the droplets. This device allows regulating the rate of droplet supply and sizes. The condition radius R de was chosen as a characteristic droplet size similar to the experiments [5]. The reason for this is that the water droplets take the ellipsoidal shape during motion through gas area [3–5]. The maximum diameters for such droplets were calculated (from 6 up to 10 values according to configuration) and averaged. The average condition (droplet shape was different to sphere) radii R de were calculated according to received values. Initial droplet sizes were changed in the range of 0.5 < R de < 5 mm. It agrees with conducting numerical investigations. Initial rates of water droplet injection into the channel with high-temperature gases were changed in the range from 0 up to 1 m/s.
Experiments were conducted in two stages. At first the main objective was the registry of sizes, mass, and motion rates of droplets which were generated by dosing device. At the second stage, the values of these parameters at outlet of the channel with high-temperature combustion products were calculated.
Each series of experiments included the next procedures:
the vessel 7 was filled in by water with “tracers”;
the dosing device 9 was connected to outlet of the vessel 7 through the channel 8;
the dosing device 9 was installed on the holder 10 at 0.5 m above the top facet of cylinder 13 (required removal due to the necessity of dosing device 9 protection against the melting at impact of high-temperature gases which get out the cylindrical channel 13);
location of cross-correlation camera 3 and laser 2 was chosen in such a way that camera optical axis and light “pulse” flatness of laser were cut across at the angle of 90 degrees (their cusp was in video frames registry space);
calibration of cross-correlation camera 3 was conducted (with determination of scale coefficient on personal computer (PC) 4), as well as the adjustment of laser 2 light “pulse” 6 “necking” was carried out;
base of the hollow cylinder 14 was filled in with the typical liquid combustible material-kerosene (250 mL), the ignition of which was started before the experimentation;
specialized software (which realized the optical methods of diagnostics “Particle Image Velocimetry” (PIV) and “Interferometric Particle Imaging” (IPI)) was neglected on PC 4 after 5 minutes (the necessary time for heat-up of inner cylinder cavity 13 up to 1070 ± 30 K), the dosing device 9 was switched, and the registry procedure of videograms with high-temperature gas-vapor-droplet mixture was conducted;
the integral characteristics of water droplet evaporation during motion through high-temperature gas area with prescribed sizes were calculated under videoframes received at shooting with PIV and IPI methods usage;
“capture” and mass measurement of droplets (similar to [5]) were conducted together with videorecording processes of water droplet motion.
Experiments were planed and conducted with allowance for provision of minimum (acceptable deviations in range of 1–3%) dispersion of initial parameters (in particular, gas temperature, sizes, rate, and temperature of water droplets) which characterized experimental conditions. Also the conditions were established to average the measurement results (some experiments (up to 5–7) were conducted under identic values of processes under study parameters). Time delays (less than 10 s) in series between experiments were added. They were due to necessity of gas temperature establishment in the channel within tolerable limits. The component composition of gas mixture in cylinder 13 was changed due to evaporation during water droplet motion. Variation of gas temperature was not great. Gas temperature in operating channel was measured before the next experiment and a new one was conducted if temperatures corresponded to previous experiment.
The thermocouples measurement procedure was used to registry the gas temperature T f . Experiments were carried out over a relatively small period of time. The purpose of such experiment series densification was the ambition to save the identic initial parameters of water droplets (sizes, temperature, and rate) and combustion products (temperature) at experiments. Three chromel-alumel thermocouples (measured temperature range was 273–1373 K) 15 were used. They were installed at different height marks of the channel (0.15 m; 0.5 m; 0.85 m). Thermocouples sensitive elements in the channel were placed in such a way as to measurements were carried out on channel symmetry axis. Temperature gradients over cross-section (thermocouples sensitive elements were displaced relative to symmetry axis of the channel wall) were analyzed before experimentations too. It has been established that maximum deviations of gas temperature T f at all measurement points were about 30 K relative to some average value 1080 K as a result of these determinations. The error of temperature measurement T f by these thermocouples was Δ = ±0.004 × T at the range 375–1000°C. The value Δ was ± 3.3°C at average gas temperature in the channel about 807°C (1080 K).
Initial water temperature was measured before the supply into the vessel 7 of experimental setup. The chromel-alumel thermocouples were used (measured temperatures range—373–373 K) with the limit of permissible deviation ±2.5°C. As a result of measurements, it has been established that initial water temperature in series of executed experiments was 293 ± 2.5 K.
Droplet sizes in videogram registry spaces were determined with usage of optical method IPI [7]. Droplet in registry space was illuminated repeatedly by “pulse” 6. The interference between the reflected and refracted light was observed. The procedure of images videorecording with cross-correlation camera usage was carried out. Droplet sizes in the gas flow were determined according to the number of interference fringes observed on videograms [7]. Average values of maximum diameters and condition radii R de were calculated with optical method IPI usage [7] because water droplets on videograms were ellipsoids. Maximum diameters (in pixels) of droplets (it was computed for up to 6–8 maximum diameters because droplets were in ellipsoid configurations) were calculated under videograms at R de > 1 mm (consequent to IPI method limitation [7]). Then this value was averaged (in number of diameters). The translation of this characteristic in millimeters was performed at intended scale coefficient. Then the comparison of water droplet sizes was conducted before (R de ) and after (R de *) their motion through the channel with combustion products. Water droplet mass measurements at inlet (m d ) and outlet (m d *) of high-temperature gas area were carried out with electronic weighing machine usage.
Also the values of droplet rates at inlet (v d ) and outlet (v d *) from high-temperature gas zone and outflow rates of vapors from droplet surface (they characterized the liquid evaporation rates) were calculated during experiment videograms processing by PIV method [6]. The rate measurement of droplets and liquid vapors was based on the measurement of motion of “tracer” particles which were in the section plane of laser and cross-correlation camera counting area in a fixed time interval (between flashes of laser—100 μs). The motion rates averaging procedure of “tracer” particles forming part of droplet was carried out to calculate the water droplet motion rate.
The plane of laser light “pulse” (Figure 3) was considered as a measuring area. The “tracer” particles in flow measuring area were illuminated repeatedly. Particle images were recorded on digital camera. Next, image processing allowed calculating the particle displacements in a time between light source flashes and computing “tracer” rates. Videoimage processing is based on cross-correlation algorithm. It is the fast Fourier transform method with addition of cross-correlation theorem accomplishment conditions [6]. Cross-correlation function was calculated for videograms according to PIV method [6]. Maximum of correlation function was corresponded to the most probable particle displacement in operation area [6]. “Tracer” rates were determined in videoframes computation domain at known time delays between flashes of laser (100 μs) and the most probable particle movements (measured under the maximum of correlation function).
Also the filters in view of weight function [6] “No-DC” (to delete the constant component in the signal) and “Low-pass” (to increase the correlation peaks width by cutting off a small portion of low frequencies and large proportions of high frequencies from the correlation function spectrum) were used during videogram of experiments processing. The screening procedure of some vectors received by the “signal/noise” criterion was performed additionally (“Peak Validation” function) [6].
Measurement accuracy errors of gas and liquid temperatures did not exceed 2.5%, droplet sizes—1.5%, their masses—2%, motion time in the channel—1.5%, and rates of “tracers”—2%.
5. Results of Investigations and Its Discussion
Next, parameter values were used during numerical simulation similar to formulation of problems [16, 17]: water droplet initial temperature Θ0 = 0.3; combustion products temperature Θ f = 0.85–1.2; thermal effect of water evaporation Q e = 2.26 MJ/kg; water molecular weight M = 18 kg/kmole; sizes of solution region R L = 10, Z L = 1000 and droplets R d = 0.05–0.5, Z d = 0.2–2; distance between droplets L n = (0.01–10)Z d ; droplet initial motion rate V0 = 0.5. Thermal and physical characteristics of gas area (combustion products), water, and vapors were chosen according to [24, 25] and in relation to temperature.
Figure 4 shows isotherms (Θ) and isolines of gas concentrations (γ f ) in a small neighborhood of single water droplet, which is moving in high-temperature gas area.

Isotherms Θ (a) and isolines of combustion products concentration γ f (b) for model with single water droplet at τ = 0.1, R d = 0.25, Z d = 1, Θ f = 1.17:1—high-temperature gas area, and 2—water droplet.
It is visible that vapor-gas mixture temperature decreases significantly relative to Θ f close to droplet motion trajectory. The greatest temperature gradients may be noted in a droplet motion front (near frontal surface). The area of reduced relative to Θ f temperatures in a droplet motion trace has sizes which exceed droplet sizes R d and Z d (in the range (5–7) Z d ) by several times. The area of combustion products reduced concentrations has large sizes (up to 10 Z d ) relative to initial conditions (γ f = 1).
It may be noted a good agreement of isotherms (Θ) and isolines γ f similar to [16, 17]. The action of such factors as water droplet unsteady motion [12, 13] and convection inside droplets streamlined by gas flow [14, 15] was taken into account in the model (1)–(6) opposite to [16, 17]. Analysis of Figure 4 and allocations Θ and γ f [16, 17] allows to draw a conclusion about sufficiently moderate influence of these factors (differences by values Θ and γ f for models [16, 17] and (1)–(6) at identic initial parameters do not exceed 4%).
Figure 5 shows the typical isotherms in trace of two droplets by different distances between them.

Isotherms Θ for model with two water droplets at τ = 0.1, R d = 0.25, Z d = 1, Θ f = 1.17, L n = Z d (a), L n = 2Z d (b), L n = 3Z d (c): 1—high-temperature gas area, and 2—last water droplet.
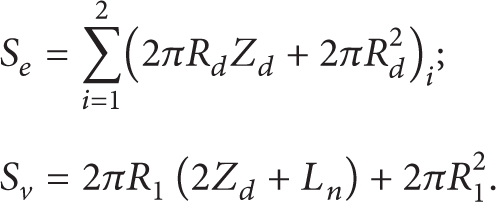
Dependences Θ* = f(S*) and γ f * = f(S*) (Figure 6) were established similar to [17]. Parameters Θ* and γ f * are the ratios of temperature and gas concentration in droplet motion trace at a distance L* = 5Z d of the last droplet to initial gas temperature Θ f and its maximum possible concentration (γ f = 1) correspondingly. Parameter S* characterizes the relative concentration of water droplets during its motion through high-temperature gases in the form of some aggregate (S* = S e /S v ).
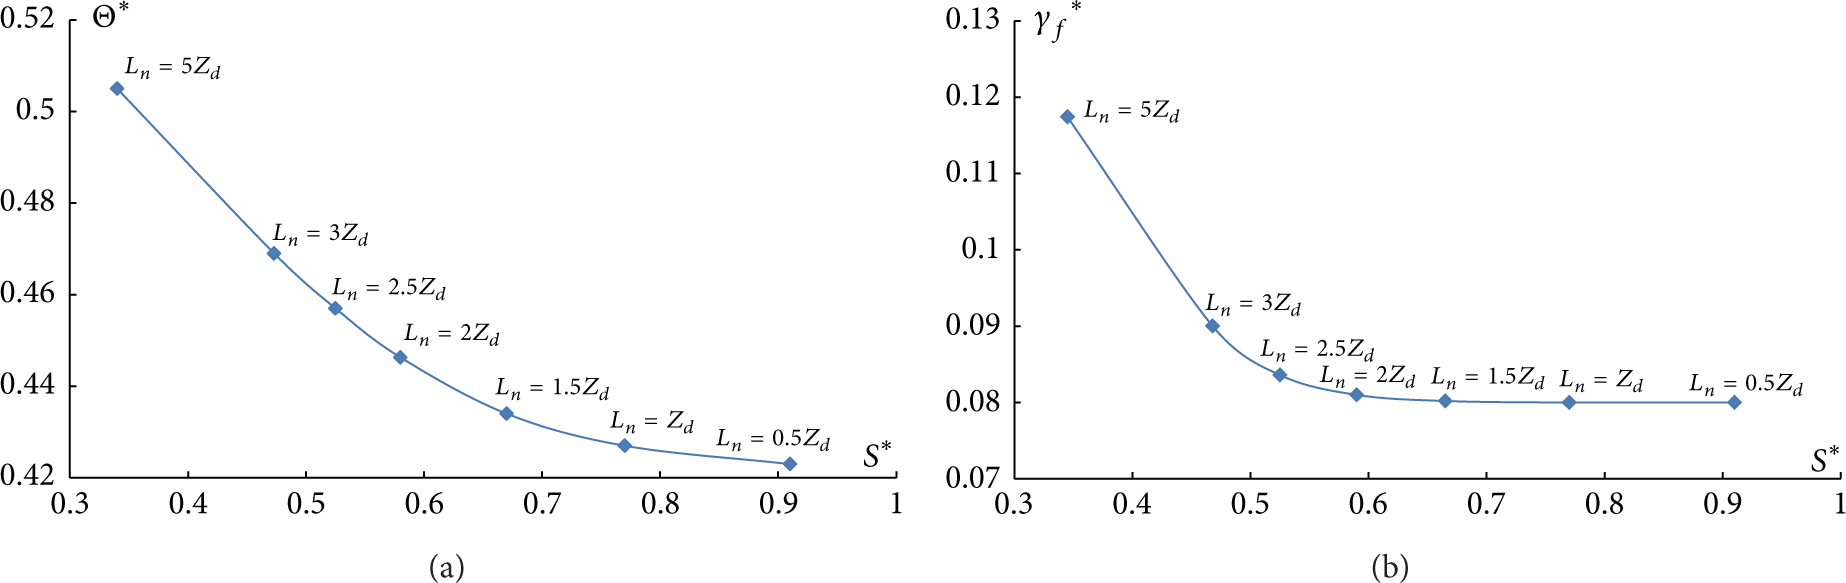
Dependences of Θ* (a) and γ f * (b) on S* at τ = 0.1, R d = 0.25, Z d = 1, Θ f = 1.17.
Correlations (Figure 1) were used to calculate the areas S e and S v as follows:
Dependences Θ* = f(S*) and γ f * = f(S*) shown in Figure 6 allow to note the sufficiently considerable water droplet “cooperative” influence on heat and mass transfer conditions both between them and in the trace.
The possible coagulation mechanism of water droplets in high-temperature gas area has been indicated with usage of Figures 4–6. It has been shown that temperature and concentration of gases in neighborhood of droplets can significantly differ when the distance between droplets changes. As a consequence the water droplet aggregate evaporation rates are differed. Droplets, leading in aggregate, decrease significantly the gas temperature in their trace. These lead to decrease of temperature in neighborhood of the next droplets and its evaporation rates. The sufficiently considerable droplet breakage by high-temperature gas flow happens at intensive evaporation of first droplets. Next, droplets during motion through the area with a few reduced temperatures and at less gas concentration are accelerated. In such way the distance between droplets L n is decreased. Droplet coagulation happens in a time interval. This process takes place cyclically.
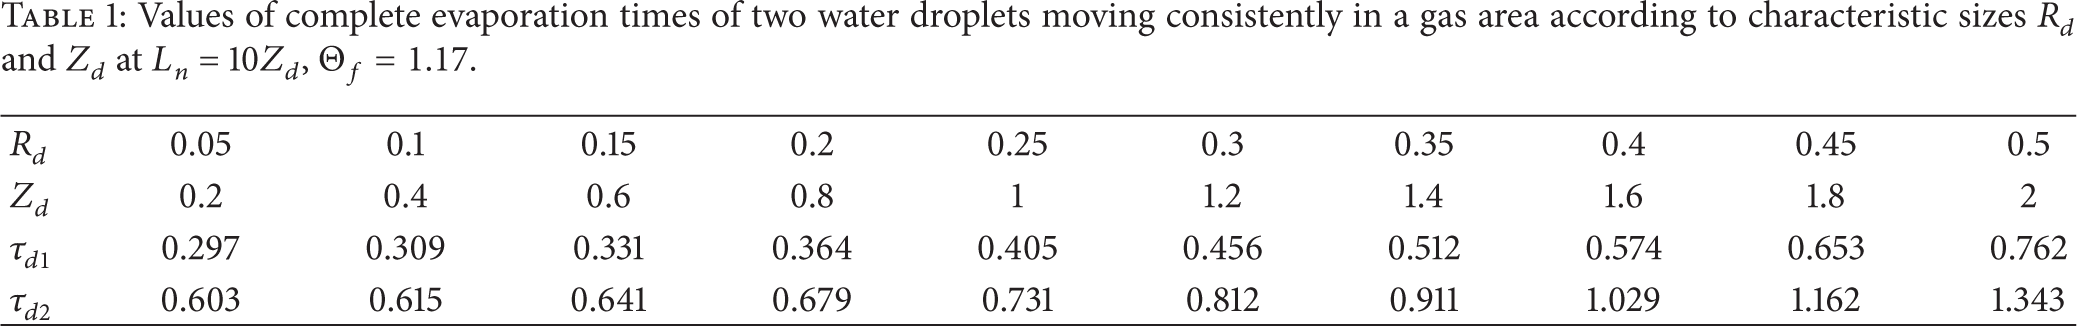
Characteristic existence times (“life” times or times of completed evaporation) of water droplets in high-temperature gas flow (τ d ) were established with usage of model (1)–(6). For example, values τ d do not exceed 0.4 at R d = Z d = 0.1. Times τ d grow up nonlinear and reach 0.7 if water droplet sizes increase up to 0.5. Complete evaporation times of droplets moving consistently through gas area exceed the first droplet values τ d by several times. In particular, times τ d for next droplets exceed the similar parameters for first droplets by 3–4 times at L n ≤ 5Z d . Droplet sizes influence on evaporation conditions of next droplets reduces at its size decreases. Thus, for example, it has been determined that complete evaporation times of the first and next droplets are commensurable at L n ≈ Z d and Z d < 0.1. This result can be explained by “trace” mesh sizes of such droplets (in this words the areas of temperatures reduced are relative to Θ f ). The “cooperative” droplet influence on its evaporation decreases, when L n increases relative to 5Z d . The complete evaporation time values of two droplets moving consistently in gas droplet area if L n = 10Z d are listed in Tables 1 and 2 (τd1—existence time of first droplet, and τd2—existence time of next droplet). It is visible that times τd1 and τd2 are sufficiently close when significant droplets distance from each other takes place (L n = 10Z d ).
Values of complete evaporation times of two water droplets moving consistently in a gas area according to characteristic sizes R d and Z d at L n = 10 Z d , Θ f = 1.17.
Values of complete evaporation times of two water droplets moving consistently in a gas area according to temperatures Θ f at L n = 10 Z d , R d = 0.25, Z d = 1.

Experiment series with usage of setup were conducted to estimate the legitimacy of conclusions made by results of numerical simulation. The conventional scheme of setup is in Figure 3.
Figure 7 demonstrates the typical videograms of experiments with images of water droplets at high-temperature gas area outlet. It is shown that droplets take the shape of ellipsoids and are revolved during motion through gases relative to its center of gravity (as consequence its surface are few deformed). The droplet areas are differed by less than 4% at identic experiment conditions despite the educed deformation of droplet surface. This result allows drawing the inference that the admissions (accepted during simulation) of droplet shape and its surface deformation processes are allowable.

Videograms of single water droplets (R de = 3 mm) at outlet of high-temperature gas area (a)–(c).
It should also be noted that droplet breakage effects were not observed in experiments at rates (up to 2 m/s) and sizes (up to 5 mm) of water droplets which correspond to used ones at numerical simulation. These results are in good correlation with videograms and conclusions [3–5] and illustrate the legitimacy of corresponding admissions at numerical simulation too.
Integral characteristics of water droplet evaporation and motion in high-temperature gas flow were esTablished at experimentations. For example, Table 3 shows the values R de , m d , t d from one of the experiment series. Presented results of experiments (Table 3) may be used to calculate the evaporation constants with the next formula usage as follows:

Experimental values of characteristic parameters of water droplet evaporation in high-temperature gas area.
Evaporation rates W e are from 0.17 kg/(m2s) to 0.29 kg/(m2s) relatively for variation ranges R de , m d , and t d , as shown in Table 3.
Water droplet evaporation mass rates have been calculated with usage of models (1)–(6). It has been received that rates are W e ≈ 0.3 kg/(m2s) at β/(1 − kβ·β) ≈ 0.1 and vapor pressure close to saturated state (the difference of (P n − P) does not exceed 3500 Pa). In this case the expression for evaporation coefficient is as follows: β ≈ 0.1/(1 + 0.1kβ). The value of parameter kβ, as a rule, is taken equal to 0.396–0.432 [19]. The sufficiently narrow range β ≈ 0.0958–0.0961 can be identified for coefficient of evaporation.
Gas temperature in the channel 13 (Figure 3) was maintained in the range 1070 ± 30 K. It has been accepted at numerical simulation (Figure 1) that initial temperature of outdoor environment for droplet is Θf = 0.85–1.2. Numerical investigations allowed establishing that surface temperature of droplets during its motion through high-temperature gases is 0.35–0.37 (Figure 4). It is the maximum possible temperature of water evaporation. At that the values 0.35–0.37 are kept throughout the existence time at Θf = 0.85–1.2. As a consequence, an inference can be drawn that established constant values β and kβ which correspond to maximum rates of liquid evaporation in concerned conditions.
The moderate (less than 15%) loss in weight of droplets during evaporation in the channel 13 (Table 3) was established as a result of conducted experiments despite the high temperatures of droplet surface and maximum evaporation rates correspondingly. First of all this can be explained by sufficiently high power consumption for phase transition realization (water evaporation heat is Q e = 2·106 J/kg). The boundary layers of droplets are heated in small depth (Figure 4) at such values of Q e . Furthermore the “buffer” zone of water vapors between droplet and gases is formed at intensive evaporation conditions. This zone decreases the heat flow to phase transition boundary. So parameters Δm and ΔR (in particular, by values m d and R de , as shown in Table 3) do not exceed 0.15 in experiments, and evaporation (condensation) coefficient is β≪1 correspondingly.
Executed series of experiments showed that the values W e are practically not changed relative to processes established with all other adequate parameters (values W e increase moderately; less than 5% when R de decreases) at R de varying in the range from 1 to 5 mm. This result allows inferring that marked values β and kβ can be used at simulation of heat and mass transfer processes in the neighborhood of droplets moving in high-temperature gas area at their characteristic sizes change in sufficiently wide and typical for many supplements range (R de < 5 mm).
Results of conducted numerical and experimental investigations allow inferring about water evaporation rate asymptotic behavior with exterior temperatures which significantly exceed the boiling temperature. Water vapor concentration is so great that the next temperature increase of outdoor environment does not significantly influence droplet surface temperature in conditions of intensive evaporation in water droplet “wall-adjacent” area. So the evaporation rate is changed incidentally relative to values corresponding to boiling temperature.
It is quite difficult to calculate the values of the parameter ΔR that is accepted as an integral one in experiment because of great difficulties at numerical simulation of ellipsoid water droplet motion in intensive evaporation conditions. So the estimation of transverse (R d ) and longitudinal (Z d ) size change of droplets in the shape of cylinder (Figure 1) was made. The changes of parameters R d and Z d are 0.08 and 0.13, respectively (in experiments 0.05 < ΔR < 0.13 (Figure 8)), in consequence of evaporation with conditions corresponding to conducted experiments. Contrasts of transverse (R d ) and longitudinal (Z d ) size time history of droplets during its motion through high-temperature gas area are due to different temperatures of water vapors and gases mixtures at corresponding droplet surfaces (Figure 4). As a consequence the evaporation rates are differed and correspondingly the characteristic size changes too.
Dependence of ΔR on R de , mm.
Water droplet coagulation processes (Figure 9) have been investigated at videograms analysis of experiments with water droplet aggregate. Two realization mechanisms of these processes have been educed in experiments as opposite to numerical investigations. The first mechanism correlates well with the one established in numerical simulation, when the next droplets “harry up” the intensive evaporative first droplets.

Videograms with some droplets at outlet of high-temperature gas area (a)–(c).
The second mechanism is realized at “slowdown” and motion direction reversing to first droplets. The confluence of counter moving droplets happened during such processes realization. It has been established in experiments that coagulation effect exhibition depends on concentration of droplets in the gas flow significantly. Thus the droplets confluence is of the random (practically singular) nature when concentrations are sufficiently small (up to 10 droplets with sizes 0.2 < R de ≤ 0.5 in capacity more than 1000 mm3). Realization of these processes is regular by this time with concentration increase. It has been educed that the second mechanism of droplet coagulation is realized oftener with droplet size increase. This is due to evaporation process intensification (Figure 8) and, as a consequence, the rate increase of water droplet loss in weight which are moving in gas flow.
6. Conclusions
Heat and mass transfer models (1)–(6) have been developed. This model allows conducting numerical investigations of water droplet motion processes through high-temperature gas area with the main factors consideration (droplet nonsphericity, their unsteady motion, evaporation, convective currents inside the body streamlined by gas flow, and others).
Possible mechanisms of water droplet coagulation in high-temperature gas flow have been determined. A good agreement with conclusions drawn on the base of numerical and experimental investigations (in particular about decreased dynamics of water droplet sizes and mass) has been established.
Values of water droplet evaporation mass rates in gas flow have been determined by experiments with usage of optical methods (PIV and IPI). Ranges of evaporation (condensation) coefficient change have been evaluated with usage of heat and mass transfer models (1) and (6) and calculative values droplet evaporation mass rates.
Educed realization features of phase transitions and heat and mass transfer processes in “water droplet-high-temperature gases” and “water droplet aggregate-high-temperature gases” systems allow predicting the conditions which promote the most effective application of water and other extinguishing compositions on its base to localize the flames and liquidate the ignitions with usage of “water fog,” “vapor-water clouds,” and “water mist.”
Footnotes
Nomenclature
Conflict of Interests
The authors declare that there is no conflict of interests regarding the publication of this paper.
Acknowledgments
This work was supported by the Russian Foundation for Basic Research (no. 14-08-00057) and the program to improve the competitiveness of the National Research Tomsk Polytechnic University.