
Abstract
This study is to measure the welding residual stress distributions in a 70 mm-thick butt weld by one-pass electron gas welding using both the inherent strain method and neutron diffraction method, respectively. Based on the measurement results, the characteristics of residual stress distribution through thickness were compared between one-pass electron gas welding and multipass flux-cored arc welding. Residual stresses in the specimens of electron gas welding measured by the inherent strain method and neutron diffraction method were well matched. The longitudinal residual stress in the multi-pass flux-cored arc welding is tensile through all thicknesses in the welding fusion zone. Meanwhile, longitudinal residual stress in electron gas welding is tensile on both surfaces and compressive at the inside of the plate. The magnitude of residual stresses due to electron gas welding is lower than that due to flux-cored arc welding.
1. Introduction
To build large structures such as ships and high-pressure vessels, extra-thick steel plates are often employed [1]. Welding is inevitable in manufacturing the large structures. The extra-thick plates have been generally joined by a multipass welding process, for example, flux-cored arc welding (FCAW). Recently, a one-pass welding process called electron gas welding (EGW) has been applied to join the extra-thick plates in order to improve efficiency and productivity [1]. Since the heat input of one-pass EGW is much higher than that in multipass FCAW, significant strength degradation occurs in the heat-affected zone due to the coarsening of the grain size by welding [2]. However, investigations of the mechanical properties, residual stress, and fracture toughness of the thick welds were very limited [3]. Thus, safety evaluation of the extra-thick welded joints has become an issue.
Currently, the distribution of residual stresses in one-pass extra-thick welds is not fully understood. Tensile residual stress in the extra-thick welded joints would be extremely harmful, because it can accelerate the propagation of cracks and then induce an abrupt brittle fracture [4]. Some experimental results [5] show that one-pass welding with high heat input and multipass welding with low heat input have totally different fracture strengths which may relate to welding stress distribution. Thus, it is quite important to predict or measure welding residual stress distribution in one-pass welds and furthermore to examine the influence of residual stress distribution on the fracture mechanism of welds for the safe design of welded structures.
Various methods have been developed to measure residual stress through the thickness of the weld plate. First of all, the deep-hole drilling method (DHD) [6, 7] is an invasive method performed by making a hole in the position where the residual stress needs to be measured. The hole is made by a gun drill and then the diameter (d0) of the hole is measured. Then a cylindrical core is trepanned including the drill holes to measure the diameter of the drill hole (d1) again. The repeated measurements of the hole diameter provides the diameter changes (Δd = d1 − d0) which can be converted to residual stress [8]. It is a measuring method of residual stresses based on the changes of the inner diameter of the core when the residual stresses are released as a cylindrical core which is trepanning. Mahmoudi et al. [9] developed the conventional DHD to increase more accurate measurement. The new DHD technique relies on incremental trepanning and employs the intermediate information of the reference hole profile to calculate the correct residual stress. This new DHD method is good for measuring residual stress regardless of the thickness of the specimen.
The contour method [10, 11] measures the curvature of a surface in high resolution using laser equipment after cutting the cross section of interest using a very thin (~100 μm) electrical discharge wire. From the measured surface, the curvature can be formed along the normal direction of the cut face. The residual stresses can be reproduced when curvature is restored to the flat initial stage by using elastic FE analysis [12]. There is no thickness limitation for the measurement, but there is a restriction that residual stresses can only be measured along the normal direction of the cut surface. The neutron diffraction method [13] measures the distance between the lattice planes of grains based on Bragg's law, which correlates the lattice distance and diffraction angle when neutrons having a constant wavelength meet the lattice parameter. Residual stresses can be calculated using the displacements and strains put in to Hooke's law. In detail, the distance between lattice planes is changed by stress. Therefore, the stresses can be inversely determined by measuring the distance (d0) between lattice planes using a stress-free specimen and distance (d1) between lattice planes of welded joints under stress. The ND method has difficulty in measuring stress in a thick welded joint because of the limited penetration capability of the neutron beam [14]. Woo et al. [15] developed a technique for measuring residual stresses in steel having a thickness up to 80 mm and the reliability of this measurement was compared with the results of the DHD method and the contour method.
One of the promising methods is the inherent strain method (ISM) [16], which can measure the overall distribution of residual stresses in welded joints and reproduce their redistribution in a welded structure even if cracks occur or propagate during performance. These inherent strains can be determined by an inverse analysis using measured elastic strains. The elastic strains can be released by cutting the specimen into small pieces and then measured by the attached strain gauges. Concretely, the relationship between inherent strains and elastic strains can be given by an elastic response matrix. Then, the final welding residual stresses can be calculated by performing elasticity FEM analysis [17], in which the nodal force vector is computed by applying inherent strains to finite elements. This method may be only one way to measure the overall distribution of welding residual stresses without limitations in thickness and materials.
The purpose of the current study is to measure welding residual stresses and their distribution through the thickness generated by one-pass EGW in a 70 mm-thick weld using the inherent strain method. The results were compared with the neutron diffraction method for verification. Furthermore, the residual stress distribution was compared in butt welds, respectively, joined by one-pass EGW and multipass FCAW with low-heat input.
2. Experimental Procedure
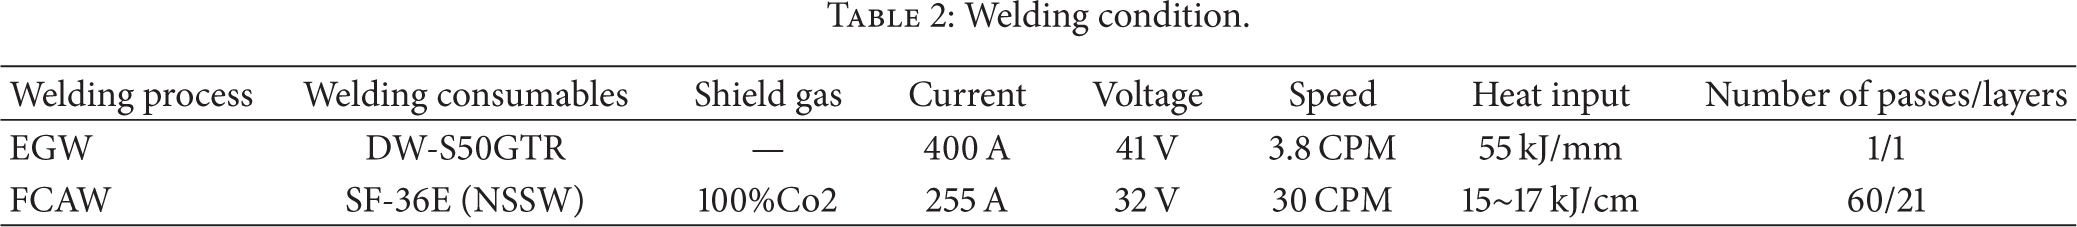
Figure 1 shows the size and shape of the butt-welded specimens joined by one-pass EGW welding and multipass FCAW. The dimensions of the test specimen were 600 mm in length, 600 mm in width, and 70 mm in thickness. The base metal was made using a thermo mechanically controlled processing (TMCP) method and high-strength steel having a yield strength of 390 MPa. Details of the mechanical properties are shown in Table 1. The EGW and FCAW conditions are summarized in Table 2. Figure 2 shows the cross-sectional macrostructure of the 70 mm-thick butt welds joined by FCAW and EGW, respectively. A multipass FCAW butt weld has 60 passes and 21 layers, while an EGW butt weld only has one pass using the attached copper backing material on both surfaces. Figure 3 represents the microstructure of the cross-sectional sections. The locations for the optical microscopy were centerline (0 mm), fusion line, and 20 mm from the fusion line at the mid-thickness of the specimen as marked by six squares, shown in Figure 2. The continuous changes in the microstructure of the FCAW and EGW welded specimens reveal typical variations of the grain size in each characteristic region associated with the weld, fusion line, coarse grain zone, fine grain zone, and base material in the TMCP joint. In particular, in Figure 3(a), the grain size of the coarse grain zone in the FCAW welded specimen was ~40 μm (obtained by the linear intercept method). For the EGW welded specimen, Figure 3(b) shows that much larger grains of ~80 μm are widespread up to 5 mm from the fusion line, which is consistent with a microstructure exposed at high temperature and high amount of heat input.
Properties of base metal.

Welding condition.

Dimension of specimen of EGW and FCAW.
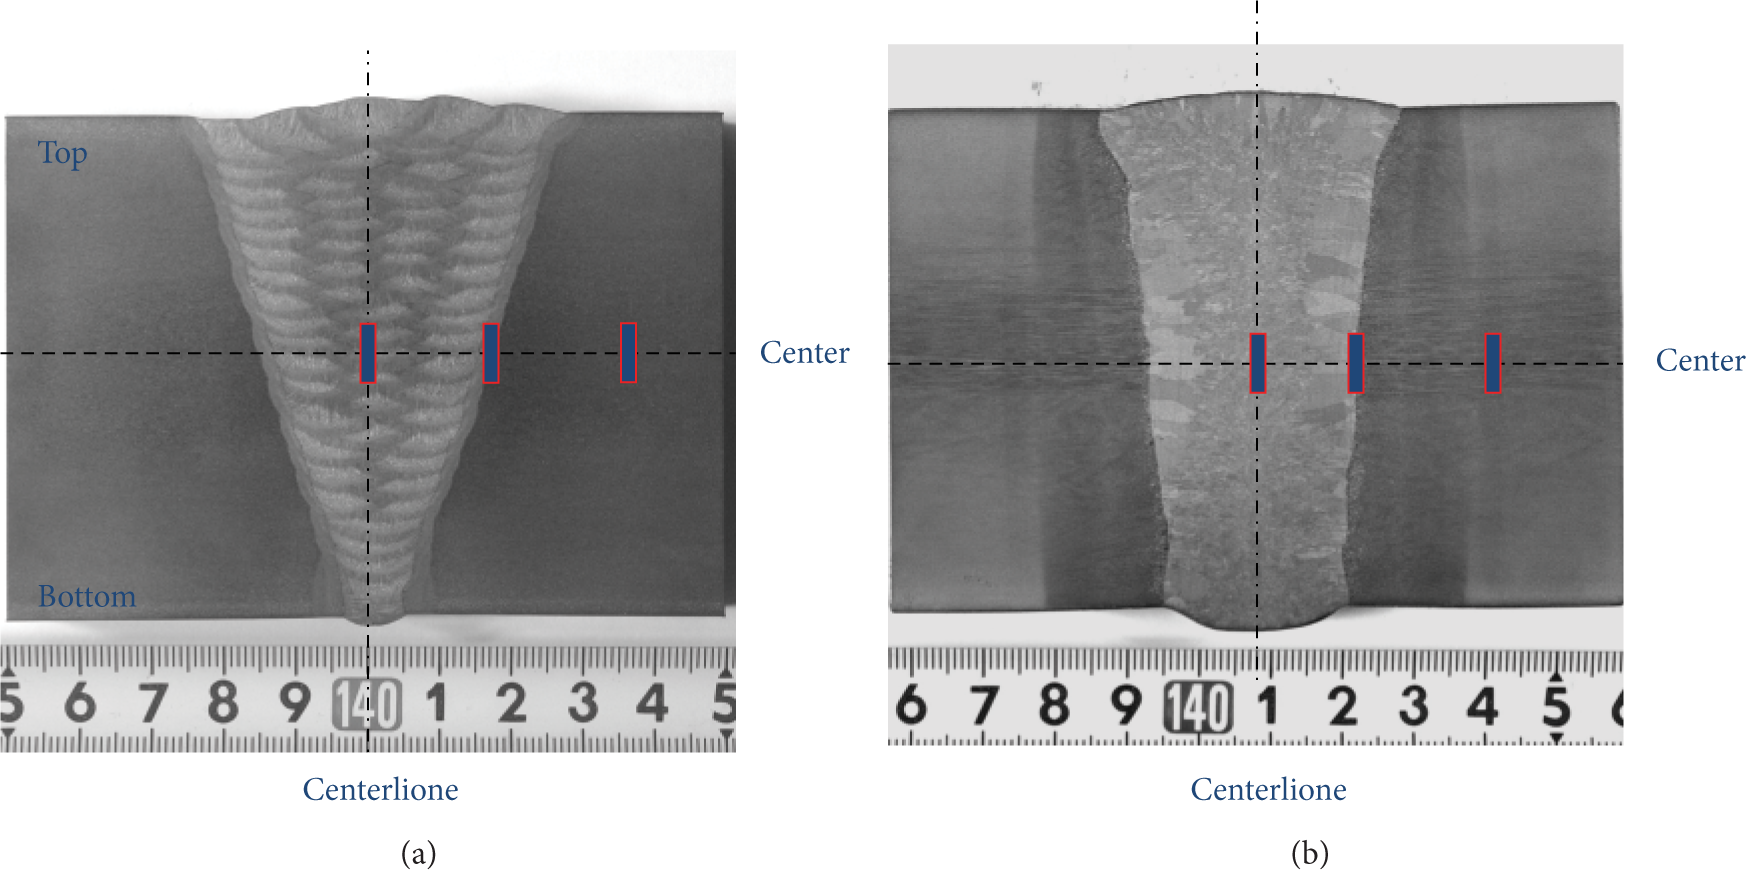
Cross-sectional macrostructure of (a) FCAW and (b) EGW.

Optical micrographs taken at the centerline (0 mm), fusion line, and 20 mm from the fusion line at the mid-thickness of (a) FCAW and (b) EGW.
In each welding process, two specimens were prepared. One was measured using the inherent strain method and the other was measured using the neutron diffraction method. Note that the results measured by the neutron diffraction method were published elsewhere [15] and the results are represented for comparison purposes.
3. Inherent Strain Measurements (ISM)
3.1. Inherent Strain Method
A major component of inherent strain is plastic strain, which is generated by welding. Therefore, if new plastic strain is prevented by machining like cutting, the inherent strain does not change. The inherent strain method (ISM) uses this characteristic and measures the elastic strain from not only the present surfaces of the specimen but also newly created surfaces after cutting.
The inherent strain generated by welding exists only near the welding zone. This existing zone is equal to the plastic deformation zone and mainly depends on welding heat input and material yield stress. Inherent strain can be categorized into two types: (i) noneffective inherent strain, which causes deformation of the structure and does not induce residual stress, and (ii) effective inherent strain (hereinafter, referred to as “inherent strain”), which causes residual stress.
The relationship between the elastic strain {ε e } existing at any arbitrary location of a measured object and the inherent strain {ε*} existing only in a welding plastic deformation zone is given by (1). The relationship can be also established between stress {σ} and inherent strain {ε*} in (2) [18]. In principle, the welding residual stress can be obtained by using (2):
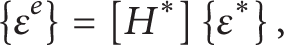

where {ε e } is elastic strain, {ε*} is inherent strain, {σ} is stress, [H*] is elastic response matrix, and [D] is elastic stress-strain matrix. The elastic response matrix [H*] can be created by performing elastic finite element analysis and applying a unit value of an inherent strain component ε i * in the inherent strain vector {ε*} to the measured object [19].
3.2. Measuring Procedures of the Inherent Strain Method
Figure 4 shows the schematic diagram for the cutting-and-measuring procedure of ISM. In order to determine the inherent strain and residual stresses, strain gauges were attached on each layer of the cross section which was cut by an electricity discharging machine. The elastic strain was recorded by the strain gauge and inherent strains are determined using (1). When a welding line is sufficiently long, the shear component of the inherent strain near middle transverse sections can be very small except at the two ends of a welded joint [19]. Thus, only the three normal inherent strain components, ε x * in the welding line direction, ε y * in the transverse direction, and ε z * in the thickness direction, are considered in this measurement.
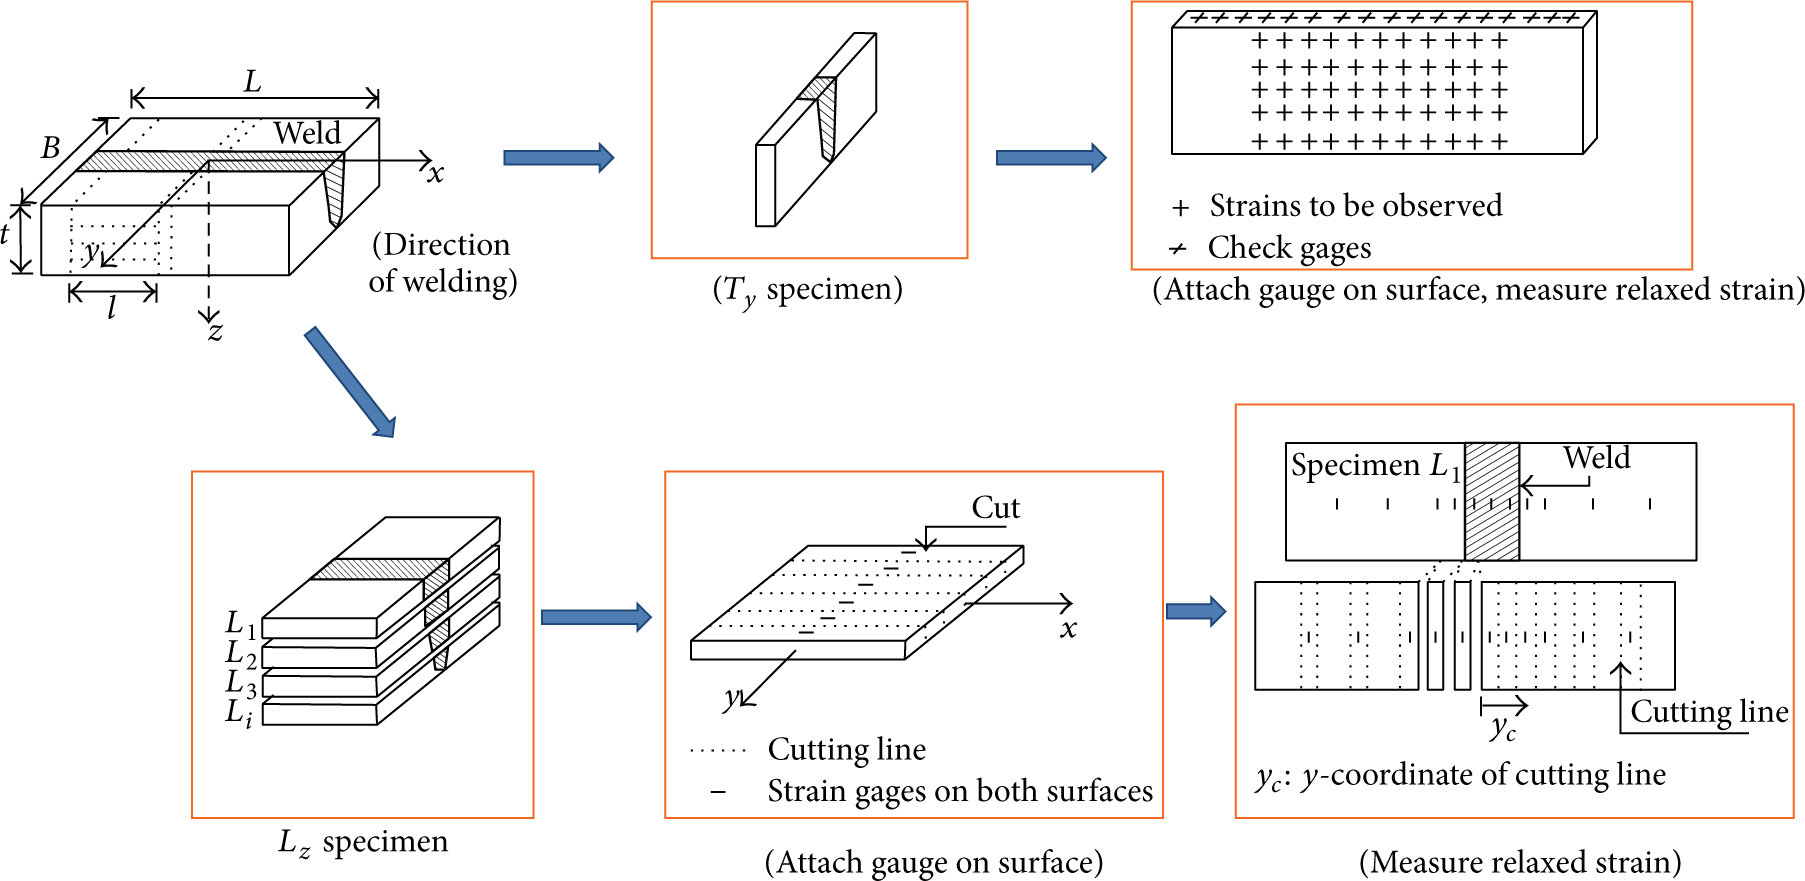
A schematic diagram of the procedure in the inherent strain method. Attached strain gauges and the measurement location were presented in the type of cutting block. Note the T y (transverse component along y-direction cut) and L z (longitudinal component along z-direction cut) blocks.
From the original welded joint (called W-specimen), L z and T y thin specimens were cut off as shown in Figure 4. The same magnitude of inherent strain that existed in W-specimen remains in L z and T y thin specimens because the inherent strains do not change.
The residual stress (σ x ) towards the welding direction of each thin specimen (L1~L n ) is not affected by the inherent strain (ε y *) toward the vertical direction and the inherent strain (ε z *) of the thickness direction. Thus, the residual stress (σ x ) on L z specimens is only generated by the inherent strain (ε x *) towards the welding direction. To measure the inherent strain (ε x *) towards the welding direction, strain gauges are attached on the surfaces of the thin specimen L z and the elastic strain (ε x e ) is measured by cutting L z specimens into small pieces until the residual strains are completely released. It can be assumed that each thin specimen L i is in the plane stress state, and inherent strain (ε x *) towards the welding direction can be calculated using (1). Meanwhile, the residual stresses (σ y ,σ z ) of the T y specimen are generated by both the inherent strain (ε y *) toward the vertical direction and inherent strain (ε z *) of the thickness direction. Therefore, the inherent strains (ε y * and ε z *) can be determined from the elastic strains (ε y e ,ε z e ) existing in specimen T y which were measured by the attached strain gauges on the surface. Therefore, welding residual stresses can be obtained by substituting inherent strains (ε x *,ε y *, andε z *) into (2).
3.3. Initial Stress-Integrated Inherent Strain Method
Initial residual stress (hereinafter referred to as “initial stress”) in a steel plate is generated due to thermal rolling. These initial stresses occurred as compressive near the surfaces, while the tensile residual stresses are generated inside the steel plate. These initial stresses are generated in the rolling direction as well as the vertical direction. The compressive residual stress is up to about 300 MPa from the surface of steel plate. Therefore, it is required to include the initial stresses into welding residual stress appropriately.
Figure 5 is a schematic illustration to show the effect of initial stress at an arbitrary location of the welding joint. The region where the initial stress exists was reheated from the fused metal to the fusion line. Thus, it is categorized as (i) region I where the effect of initial stress is nil, (ii) region II where the effect of initial stress is received partially according to the distance from the fusion line, and (iii) region III which is located at the base metal from region II where the effect of initial stress remains at its original value. Particularly, the effect of initial stress in region II was assumed to receive the initial stress effect proportionally from the fusion line as shown in the following equation (3). The initial stress contribution factor (α) changes in region II from the fusion line to the position of maximum compressive elastic strain (εmax e ). Consider the following:

where σ R is the actual residual stress, σ w is the residual stress due to welding only, and σinitial is the initial stress. Note that factor (α) is defined by α = 0 in zone I, α = y/L in zone II and, α = 1 in zone III.
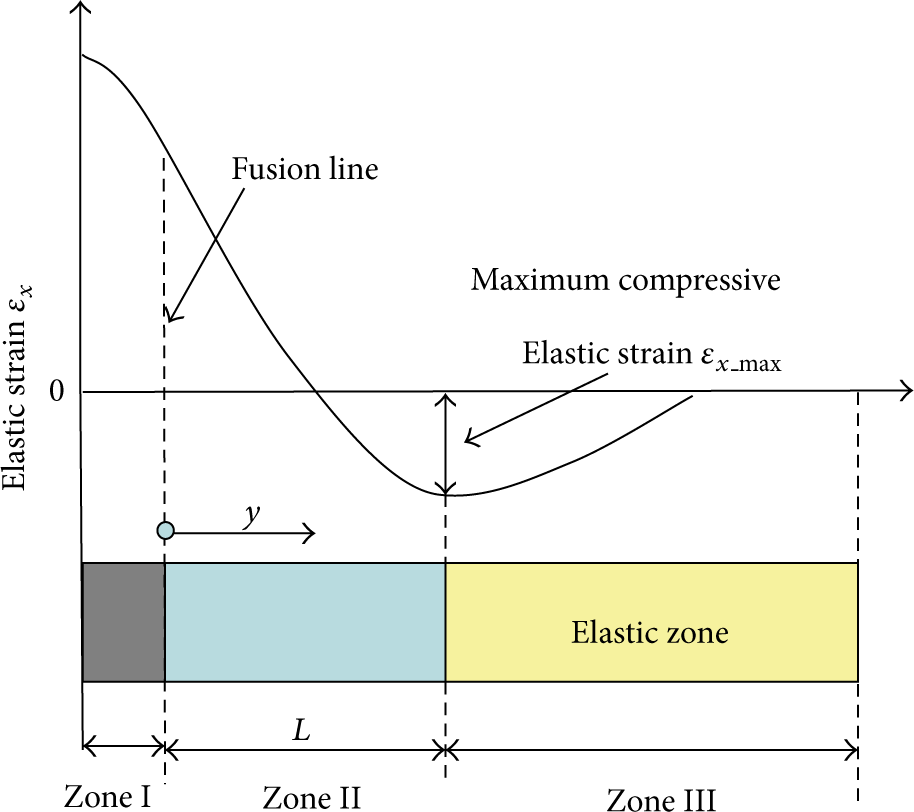
Schematic showing of initial stress effected zones I, II, and III.
The grid lines and digital values on the cross section of FCAW and EGW butt joints as shown in Figure 6 are the element lines and value of factor α of the initial stresses.
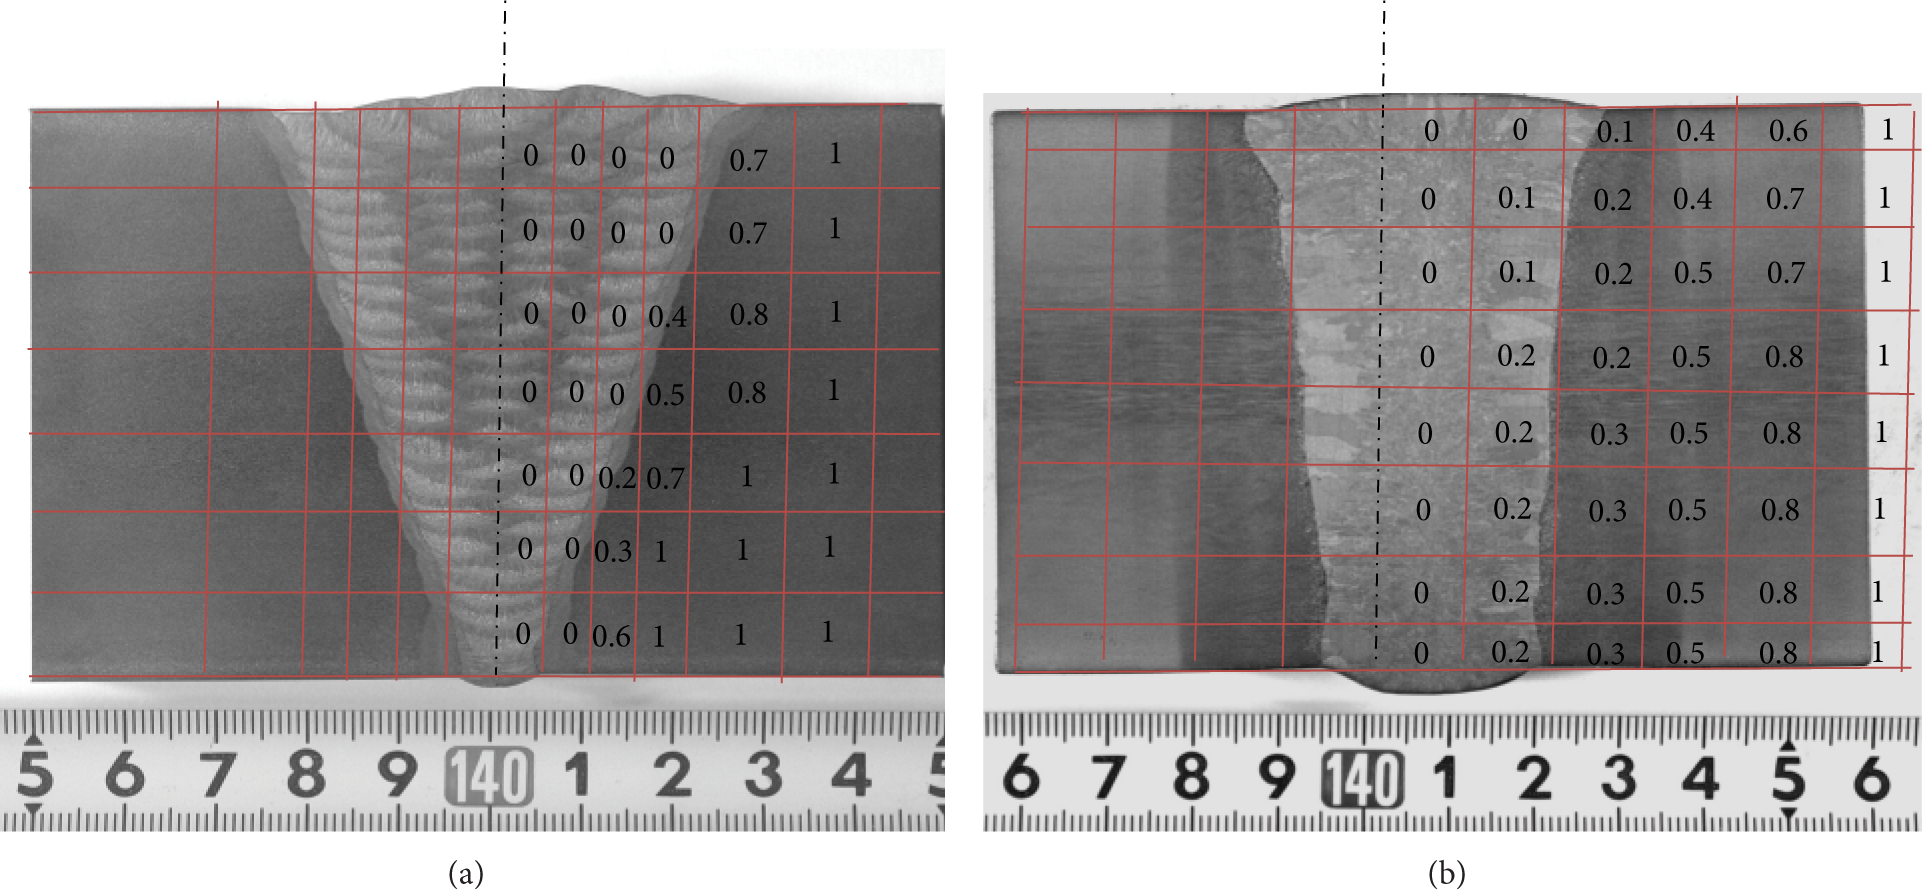
Values of influencing factors of initial stress through-thickness specimen: (a) FCAW and (b) EGW.
The initial inherent strain
where α is the contribution factor of initial stress.
4. Results
4.1. Initial Inherent Strain Generated during Manufacturing
The residual stress existing in a steel plate before welding is here named as “initial stress.” The producing mechanisms of initial stress are complicated and should strongly depend on the manufacturing process of steel plates such as rolling or bending. Figure 7 shows two initial stress components of the welding direction (x) and width direction (y) through the thickness at the points 100 mm far away from the weld centerline. It shows that a tensile stress of 100 MPa inside the specimen and −300 MPa compressive stress existed near the plate surface. The initial stresses approach up to about 76% of the yield strength of the base metal.

Distributions of initial state stresses along the x, y directions in the base steel plate, (a) x-direction and (b) y-direction.
Figure 8(a) shows the distribution of initial strain through the thickness measured directly by strain gauges. Figure 8(b) shows the initial inherent strain distribution through the thickness calculated using (1) using the initial strain (elastic strain, Figure 8(a)). The distribution of initial inherent strain in Figure 8(b) is only near the surface. This initial strain can reproduce the initial stress using (2).

Initial strain (a) and initial inherent strain (b).
4.2. Inherent Strain of EGW
To obtain the inherent strains, elastic strains were released by cutting the specimen (600 × 600 × 70 mm) into small pieces as shown in Figure 4. The released elastic strains were collected in specimens T y and L z by repeating measurement of the strain gauges attached on the cross-sectional face in sequence. Using the released elastic strains (measured strains) along the welding line from each L z specimen, the inherent strains can be calculated. In the same manner, the released elastic strains along the width and thickness directions of the T y specimen were also measured. Three-dimensional welding residual stresses were computed by applying the inherent strains calculated in the above two kinds of specimens into the original W-specimen using the aid of the finite element method with a generalized plane strain condition [19]. Meanwhile, the measurements and analysis for the welding residual stresses were performed at the center of the weld specimen to eliminate the end effect of the specimen.
Figure 9 shows the longitudinal elastic strain (ε x ) and its distribution along the width direction measured in the eight L z specimens (z = 2.5, 10, 20, 30, 40, 50, 60, and 67.5 mm from the bottom surface). The results in Figure 9 show that the maximum tensile elastic strain was about 1,200 με and the maximum compressive elastic strain was about −1,700 με. The elastic strain distribution along the transverse y-direction shows a symmetrical pattern from the center line of the weld metal and its half width was approximately equal to 60 mm. Released strains at both surface L z specimens were much higher than those inside of L z specimens because heat transfer is much faster on the surfaces than inside the welded joint. As a result, the region of the inherent strain can be predicted within y = ±60 mm from the elastic strain distribution shape in Figure 9. The inherent strain existing width does not change with the thickness coordinate z because the fusion width of EGW through the thickness is almost the same unlike that of FCAW.

Elastic welding strains in x direction, (a) L1~4 layers and (b) L5~8 layers.
Figure 10 shows the longitudinal inherent strains (ε x *) calculated from the elastic strains by using (1). The maximum inherent strain is about −3,000 με generated at the location of Lz1 which is the surface specimen, while the maximum inherent strain is about −1,200 με at the L z specimens within z = 10–50 mm from the top surface, which is smaller than that at L z specimens of two surfaces. The distributions of the inherent strain and the released strain are symmetrical in the width direction of the butt welded joint.

Inherent welding strains in x direction, (a) L1~4 layers and (b) L5~8 layers.
5. Discussion
5.1. Residual Stress of EGW and Its Validation
Figures 11(a) and 11(b) show the longitudinal residual stress (σ x ) and its distributions through the thickness of W-specimen at y = 5 mm and y = 60 mm, respectively. The mark (■) in the figures shows the welding residual stress measured by the inherent strain method without considering the initial stress. The mark (▲) indicates the final residual stress with the initial strain using the inherent strain method. The mark (◆) is the final residual stress measured by the neutron diffraction method. First of all, the results of the final residual stress at the y = 5 mm section measured by both the inherent strain method and neutron diffraction method agreed very well. Tensile residual stress was generated on both surfaces and it is almost zero inside of the specimen. If comparing the residual stress at section y = 60 mm measured by the neutron diffraction method with the welding residual stress by the inherent strain method without adding the initial stress, a large difference can be observed. This is because the contribution of initial stress at the elastic deformation zone (section y = 60 mm) to the final residual stress is larger and cannot be ignored. The final residual stress at the inside of the thickness of the section y = 60 mm was tensile due to the effect of the initial residual stress, while compressive residual stress existed near the surface. From these measured results, it can be found that welding residual stresses near the welding joint can be entirely different from those in the positions far away from the weld center line. It is also indicated that the initial stress should be considered when the welding residual stress is determined based on the inherent strain method. Furthermore, the contribution of initial stress becomes much larger as the position moves farther away from the welding center line.

Residual stress in welding directions EGW (a) at x = 300 mm, y = 5 mm and (b) at x = 300 mm, y = 60 mm.
Figures 12(a) and 12(b) show the transverse residual stress (σ y ) and its distribution through the thickness direction at section y = 5 mm and y = 60 mm, respectively. The residual stress marked by (■) does not take into account the initial stress using the inherent strain method and the residual stress marked by (▲) does take it into account. The mark (◆) indicates the residual stress measured by the neutron diffraction method. The residual stress (σ y ) distribution through the thickness direction at the fusion zone y = 5 mm is similar among the three measurement methods (ISM with initial stress, ISM without initial stress, and ND). The results were not affected by the initial stress. Welding residual stress distribution through the thickness direction changes a little. This is a basic characteristic in the one-pass EGW butt joint. This distribution characteristics through the thickness direction of the EGW butt joint is also observable at the location of the welding joint as well as that at y = 60 mm from the welding center line. Overall, a good agreement was obtained in the results between the inherent strain method and neutron diffraction method. It shows that the measurement results of the inherent strain method are reliable.

Residual stress in width directions EGW (a) at x = 300 mm, y = 5 mm and (b) at x = 300 mm, y = 60 mm.
5.2. Comparison of Residual Stress Distributions between EGW and FCAW
Generally, the distribution and value of the welding residual stress are strongly affected by the thickness, welding groove type, and welding conditions. Thus, it is necessary to select an appropriate welding process to make a reliable welded joint and know the correct residual stresses and then to estimate the fatigue strength and possibility of brittle fracture. Here the residual stress distributions between the multipass FCAW and one-pass EGW were compared.
Figure 13 shows the longitudinal residual stress and its through-thickness distribution at y = 5 mm and y = 60 mm from the center of the welded specimen. The residual stresses at the welding joint were clearly different by the different welding processes. In the case of multipass FCAW, the residual stresses became larger at the top as the welding process goes up from the first layer to the final layer due to the strong restraint of previous welded layers, as seen in Figure 13(a). Meanwhile, EGW induced the large tensile stresses on both surfaces and a small compressive stress inside. The stress distribution through the thickness direction due to EGW almost has a symmetrical distribution shape from the center of thickness. This may relate to the difference in cooling rate between the surfaces and the inside at the welding joint along the thickness direction. The difference in cooling rate can be accelerated by copper shoes which are attached to sides of the weld bead during EGW to cool the weld bead. This discrepancy in the residual stresses can be mainly due to the residual stress component acting as a secondary stress when fatigue and fracture of the structure are assessed. The residual stresses at y = 60 mm from the welding joint were similar due to the effect of initial residual stress.
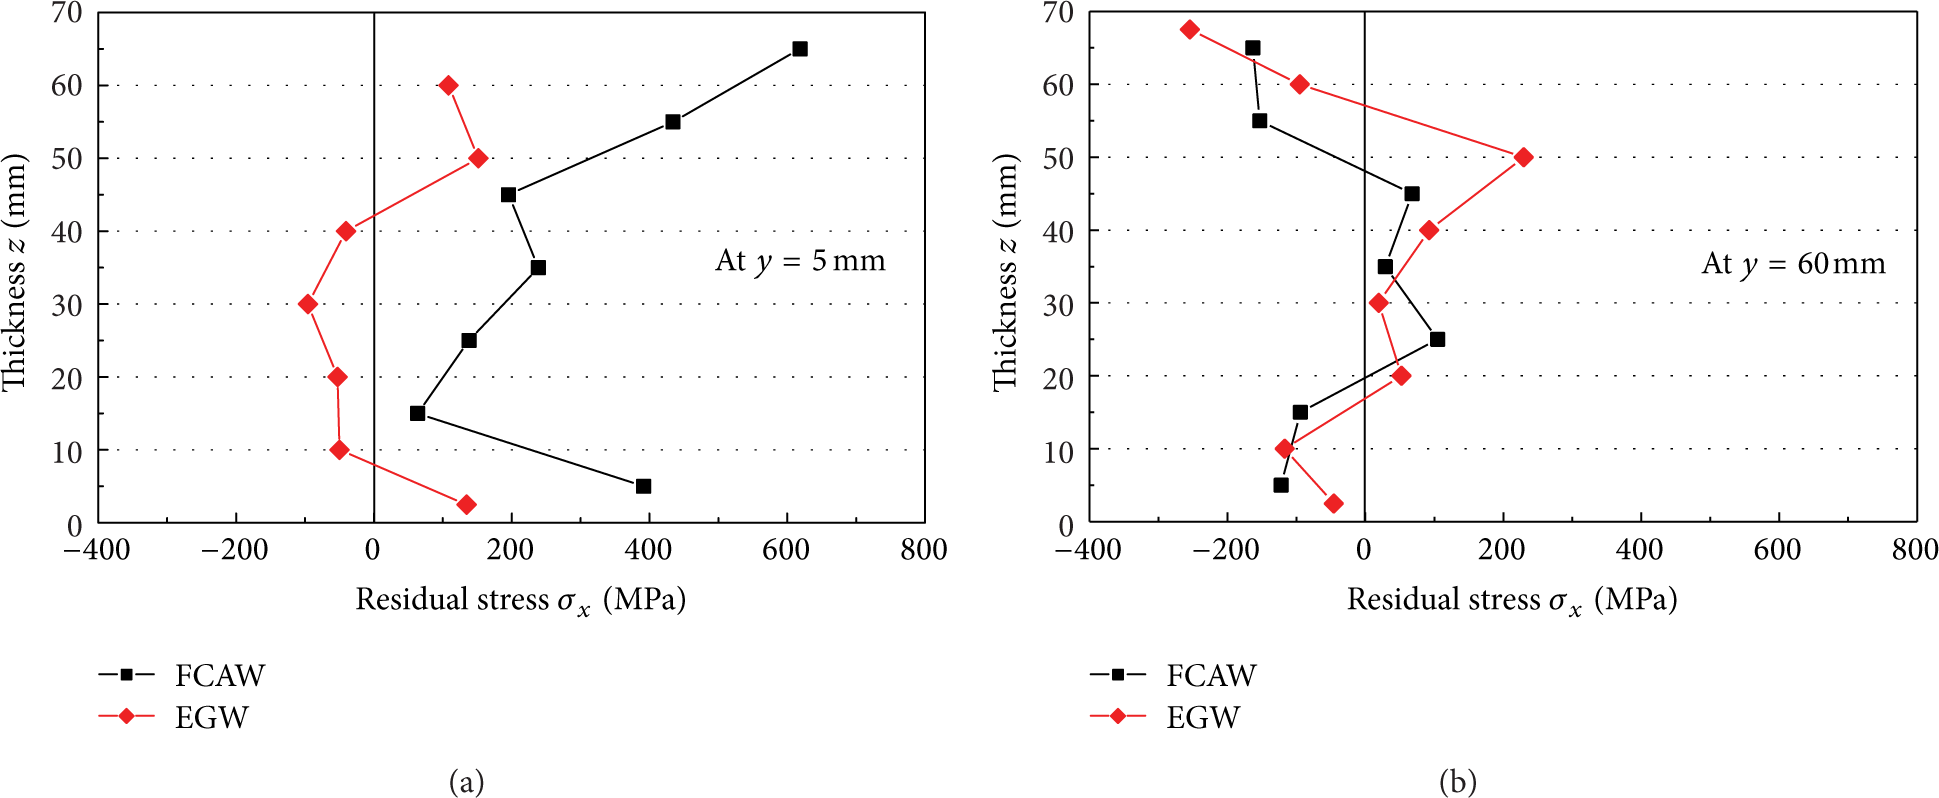
Residual stress in welding directions (x-direction) (a) at x = 300 mm, y = 5 mm and (b) at x = 300 mm, y = 60 mm.
Figure 14 shows the transverse residual stresses (σ y ) and their distribution through the thickness at the sections y = 5 mm and y = 60 mm from the welding center line. The residual stress at the weld joint (y = 5 mm) shows a significant difference in different welding processes, that is, EGW and FCAW. With multipass FCAW, a compressive residual stress of about −200 MPa was observed at the inside of the thickness direction and tensile residual stress of about 200 MPa was found on the two surfaces. Meanwhile, in EGW, almost constant tensile residual stresses of around 100 MPa were generated through the thickness direction, shown in Figure 14(a). When the stacking load is imposed toward the vertical direction of the welding line, the effect of the stacking load can be set off each other because both compression and tension are generated in FCAW. On the contrary, EGW generated tensile residual stress only and it can be added on the stacking load acting as an unfavorable load for the structure. Therefore, it is essential to consider secondary stress in the perspective of the safety evaluation of EGW joints. On the other hand, the residual stress at the location of y = 60 mm from the weld center line does not show much difference for FCAW and EGW butt joints. The residual stress (σ y ) at y = 60 mm may be dominated by the initial residual stress produced in the plate rolling.

Residual stress in width directions (y-direction) (a) at x = 300 mm, y = 5 mm and (b) at x = 300 mm, y = 60 mm.
6. Conclusions
Residual stresses in 70 mm-thick butt welds, respectively, joined by single-pass EGW and multipass FCAW were measured by the inherent strain method and neutron diffraction method. The inherent strain method was employed considering the effect of initial stress generated before welding. Based on the measurement results, reliability of the residual stress measurement method was confirmed and the characteristics of residual stress distributions through the thickness for EGW and FCAW butt joints are summarized as follows.
When residual stress was measured by the inherent strain method, though initial stress did not affect the final residual stresses near the fusion zone of the welded joint, the effect of initial stress became larger at the positions far from the welding fusion zone. Therefore, to measure welding residual stress more accurately for the welded joint having the large initial stress, initial stress should be necessarily considered.
The longitudinal residual stress due to multipass FCAW is tensile in the fusion zone, particularly a maximum residual stress generated near the final welding pass. Meanwhile, the longitudinal residual stress by single-pass EGW is tensile on both surfaces and compressive inside of the plate. The magnitude of residual stresses in EGW butt joints is smaller than that in FCAW butt joints. The longitudinal residual stress at the positions away from the welding fusion zone and their distribution are similar to the initial stresses.
The transverse residual stress due to multipass FCAW is compressive (about 200 MPa) inside of the plate and tensile (about 200 MPa) on both surfaces. However, the residual stress due to single-pass EGW is tensile (about 100 MPa) through thickness. The transverse residual stress away from the welding fusion zone and its distribution are similar to initial stress.
The distribution and magnitude of residual stresses are consistent when measured using the inherent strain method and neutron diffraction. Specifically, the residual stresses through-thickness distribution of the EGW butt joints were mostly within the range of ±50 MPa by both measurement methods. Furthermore, both results confirm that the through-thickness distributions of residual stresses are significantly different between EGW and FCAW. Thus, those destructive and nondestructive measurement methods are complementary for the accurate safety evaluation in welds.
Conflict of Interests
The authors declare that there is no conflict of interests regarding the publication of this paper.
Footnotes
Acknowledgment
This research was supported by the Basic Science Research Program through the National Research Foundation of Korea (NRF) funded by the Ministry of Education, Science, and Technology (no. 2013-056169).