
Abstract
Noise reduction and efficiency enhancement are the two important directions in the development of the multiblade centrifugal fan. In this study, we attempt to develop a bionic airfoil based on the owl wing and investigate its aerodynamic performance and noise-reduction mechanism at the relatively low Reynolds number. Firstly, according to the geometric characteristics of the owl wing, a bionic airfoil is constructed as the object of study at Reynolds number of 12,300. Secondly, the large eddy simulation (LES) with the Smagorinsky model is adopted to numerically simulate the unsteady flow fields around the bionic airfoil and the standard NACA0006 airfoil. And then, the acoustic sources are extracted from the unsteady flow field data, and the Ffowcs Williams-Hawkings (FW-H) equation based on Lighthill's acoustic theory is solved to predict the propagation of these acoustic sources. The numerical results show that the lift-to-drag ratio of bionic airfoil is higher than that of the traditional NACA 0006 airfoil because of its deeply concave lower surface geometry. Finally, the sound field of the bionic airfoil is analyzed in detail. The distribution of the A-weighted sound pressure levels, the scaled directivity of the sound, and the distribution of dP/dt on the airfoil surface are provided so that the characteristics of the acoustic sources could be revealed.
1. Introduction
The multiblade centrifugal fan with forward-curved impeller is widely used in the range hoods, air conditioners, and other numerous equipment. However, the noise of the multiblade centrifugal fan still needs to be reduced to improve the human comfort. A lot of researches have been conducted to suppress the noise and enhance the efficiency of the multiblade centrifugal fan in recent years. An industrial-type centrifugal fan was measured by Cau et al. [1] to obtain a fully detailed relative flow pattern in the impeller. The secondary flow effect of the appreciable magnitude interacting with the primary flow discharge was revealed. The flow passage of the impeller was considered as the main noise source of the multiblade centrifugal fan. Velarde-Suárez et al. [2] studied the tonal noise sources in a centrifugal fan by using the experimental method. The results illustrated that the unsteady forces exerted on the fan blades constitute the strong noise generation. Sasaki and Hayashi [3] studied the wake characteristics to predict the broadband noise of the multiblade centrifugal fan. It was found that the difference in the relative velocity caused by the biased internal flow was related to the noise levels.
In order to reduce the noise of the multiblade centrifugal fan effectively, some biological methods have been developed to realize the noise reduction and efficiency enhancement. Shi et al. [4] used a numerical simulation to investigate the effect of the bionic serrated structures on the aerodynamic noise of a circular cylinder. The results illustrated that the bionic-serrated structure could effectively reduce the frequency of the vortex shedding and control the fluctuating aerodynamic force acting on the cylinder, thus suppressing the aerodynamic noise caused by the flow over a circle cylinder. Furthermore, the biological method has also been applied to the blade of the multiblade centrifugal fan in recent years. A numerical simulation was conducted by Liu et al. [5] to investigate the noise-reduction mechanism of the bionic blade based on the dentate structure on the trailing edge of goshawk wing. The results showed that the noise caused by the wake vortex can be suppressed effectively. Chen et al. [6] developed a bionic fan based on the long-eared owl wing, with the Taguchi method used to optimize the aerodynamic performance of the bionic blade. An ideal blade of fan obtaining the improvement of the flow rate and the reduction of A-weighted sound pressure level is designed and tested. The owl wing with the excellent flight characteristics at low Reynolds number has also been attracting the keen interest of the bionics researchers. Wang et al. [7] studied the effects of the front arc curvature, leading edge thickness, leading edge angle, lower surface curvature, and trailing edge thickness on the lift-to-drag ratio of a bionic airfoil based on the long-eared owl wing. And then, a type of optimized bionic blade was employed to improve the aerodynamic performance of the multiblade centrifugal fan [8]. In addition, a bionic structure of the sawtooth was applied to the leading edge of the blade in axial-flow fan byLiang [9] to reduce the noise. The results showed that the aerodynamic noise decreased by 2.2 dB (A), that the flow rate increased by 11.2%, and that the efficiency increased by 5.3%. Ren et al. [10] employed the nonsmooth leading edge shape of the owl wing to build a bionic nonsmooth airfoil model for an axial fan, with the airflow noise level reduced by 5–10 dB. Qiao et al. [11] optimized the SD 2030 airfoil with the trailing edge serrations. They pointed out that the trailing edge noise could be effectively reduced by using the bionic feather structure of the owl wing. In the frequency range of 10 kHz, the largest noise reduction of sound pressure level is about 5.0 dB. The references mentioned above only concerned the feather structures of the owl wing as the key to the noise reduction but ignored the contribution of its unique geometry characteristics. Liu et al. [12] compared and analyzed the avian wing geometry and kinematics of seagull, merganser, teal, and owl. The results showed that the pressure coefficients of these wings were higher than those of the S1223 airfoil. Kondo et al. [13] adopted the large eddy simulation method to analyze the performance of the airfoil based on the cross-section profile of the owl wing under the low Reynolds number condition. The results illustrated that the owl-like airfoil could obtain the higher lift-to-drag ratio compared with the conventional thin symmetrical airfoils. Klän et al. [14] investigated the effects of both the surface structure and the cross-section profile of a typical owl wing on the aerodynamic performance of the owl-based wing model. The results showed that the length and density of the hair and the softness of the owl wing surface can minimize the size of the separate bubbles and improve the aerodynamic performance of the owl-based wing model. Ikeda et al. [15] presented the aeroacoustic field generating from the flow around two NACA four-digit airfoils by using a numerical method at relatively low Reynolds number condition. The sound scattered on the airfoil surface is directly resolved as the unsteady pressure fluctuation. In their studies, the mostly amplified frequency in the boundary shear layer does not agree necessarily with the primary frequency of the trailing edge noise of the airfoil. This is an evidence of the boundary-layer instability. Ge et al. [16] investigated numerically the effects of the owl-based slat on the lift coefficient of the airfoil before they extended the current study to reveal the noise-reduction mechanism. Even at a high angle of attack, the lift coefficient of the airfoil with the bionic slat is high. Klän et al. [17] studied the aerodynamics of a newly constructed wing model based on the wing of a barn owl. The results show that the size of the transitional separation bubble on the suction side of the airfoil is decided by the Reynolds number and the angle of attack, whereas the location is influenced mainly by the angle of attack.
These numerical simulations and experimental results showed that the aerodynamic performance of the owl-like airfoil got a remarkable improvement and provided an efficient design of the bionic airfoil under the low Reynolds number condition. However, to the best of our knowledge, the related research on the aeroacoustic performance of the cross-section geometry of owl wing and its noise-reduction mechanism is still missing.
As is known, the sound field of the airfoil is the reflection of its flow characteristics, with both the unsteady flow fields and the aerodynamic sound fields of a bionic airfoil owl-based wing concerned in this study. The aim of this study is to reveal the mechanism of the high efficiency and low noise of the owl wing during the flight and to explore the relationship between the sound field and the flow field of a bionic airfoil based on the owl wing profile. In order to achieve the goals, large eddy simulation was adopted to simulate the unsteady flow at different angles of attack, with the Ffowcs Williams-Hawkings equation based on Lighthill's acoustic theory used to predict the propagation of the acoustic sources at the angle of the attack of 9.0 degrees. The studies presented here on the flow field and sound field would provide some useful references for the blade design of the multiblade centrifugal fan with higher efficiency and lower noise based on the bionic technology.
2. Computational Methods
The numerical simulation based on the finite volume numerical method using a CFD commercial software [18], FLUENT 14.0, has been carried out to investigate the aerodynamic performance of the studied airfoil and to understand the unsteady flow characteristics. The details of this analysis are presented in the following sections.
2.1. Airfoil Model
According to the background mentioned above, the owl wing was selected as the research object because of its geometrical features which were preferable for the low Reynolds number flight and could suppress the sound generated by the unsteady pressure pulsation on the wing surface. The lift-to-drag ratio of the most significant aerodynamic performance to an airfoil will be investigated. Moreover, the sound level of the bionic airfoil will also be predicted by using the numerical method.
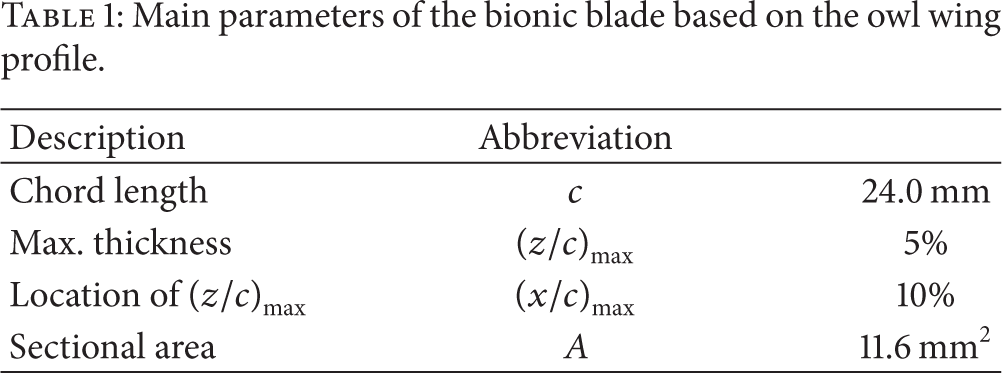
The bionic airfoil was built by the data extracted from the cross-section of the owl wing with 40% of span length. The geometry of the owl wing is based onLiu et al.'s study [19]. The cross-sectional profile of the bionic blade is shown in Figure 1. The characteristics and main parameters of the three-dimensional owl-based profile are shown in Table 1. The upper and lower surfaces are smooth. The camber of upper surface is large and that of the lower surface is concave. The maximum thickness which appears at x/c = 0.11 is 5.5% of the chord length. When x/c is greater than 0.3, the thickness is less than 3% of the chord length.
Main parameters of the bionic blade based on the owl wing profile.
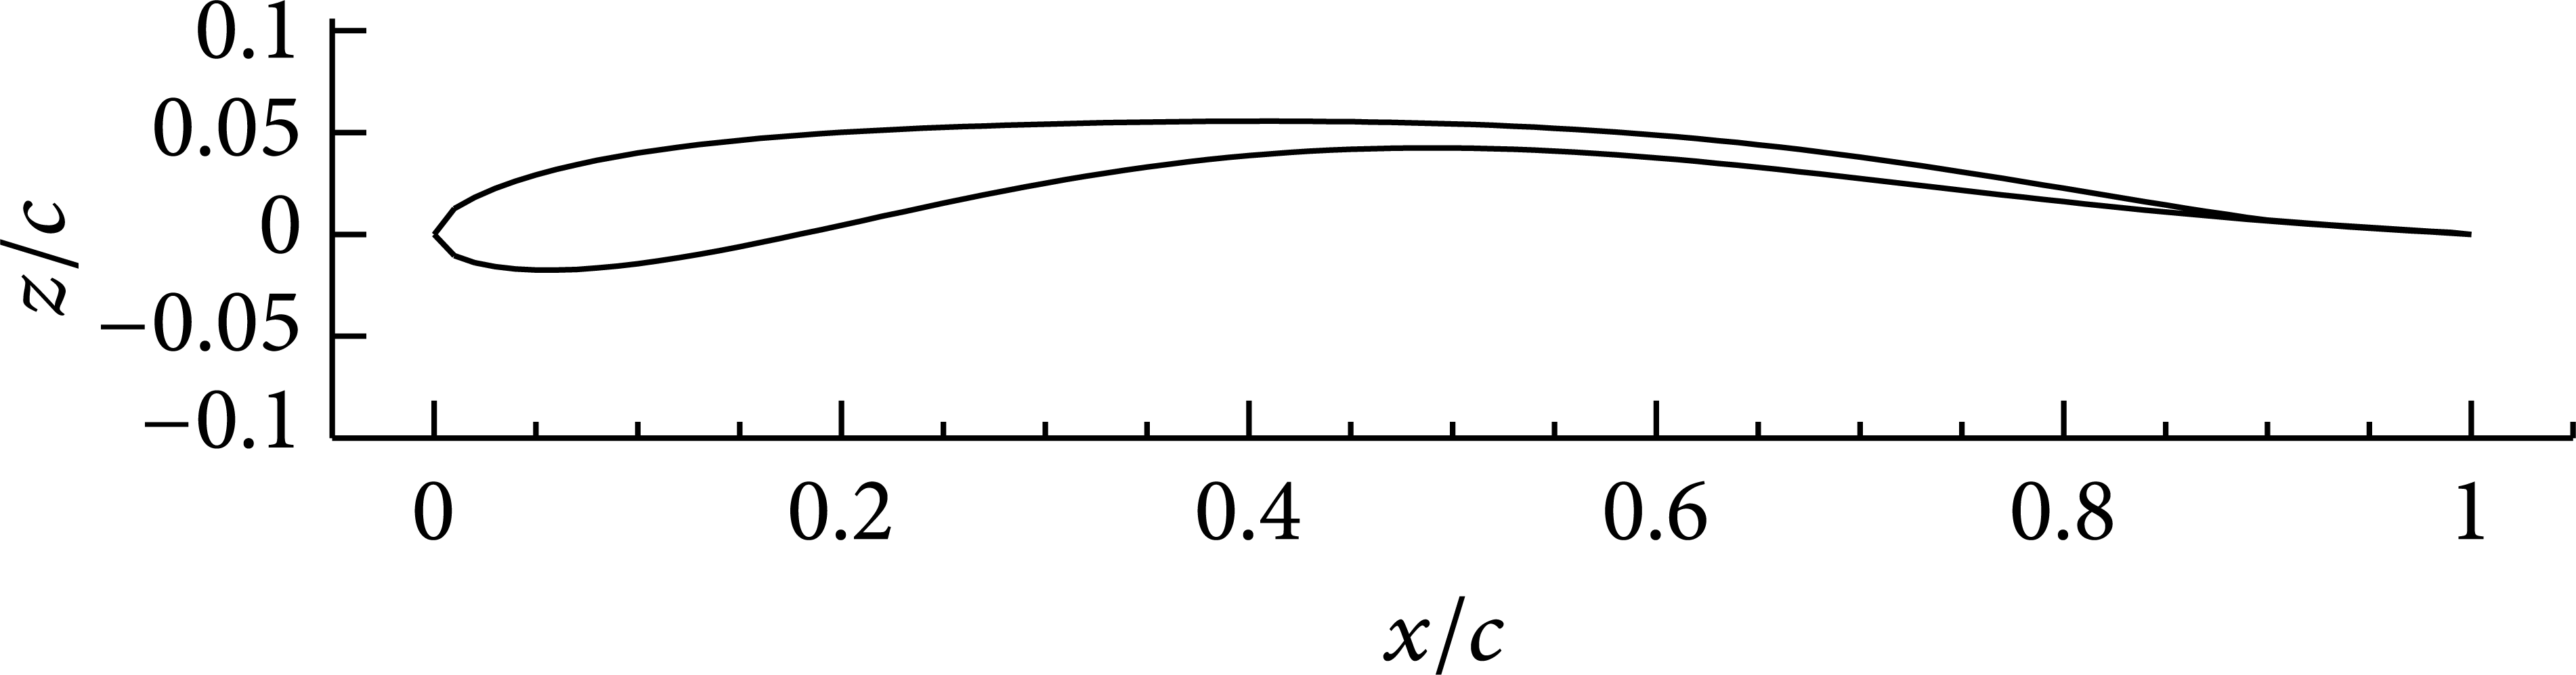
The cross-section of the bionic airfoil.
The freestream Mach number is 0.02, so that the compressibility of the fluid can be ignored. The Reynolds number based on the chord and freestream velocity is 12,300, which agrees with the Reynolds number in the flow passage of the multiblade centrifugal fan. The angles of attack (AOA) are selected in the range of 0 to 9.0 degrees.
2.2. Governing Equation for Flow Field
The governing equations of the large eddy simulation (LES) are obtained by filtering the time-dependent Navier-Stokes equations in configuration space. When the scales of eddies are smaller than the grid spacing, they will be filtered out in the filtering process.
A filter of a function
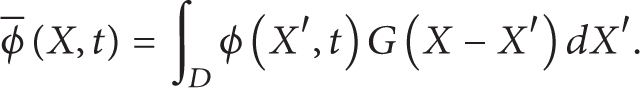
Here, D is the involved fluid domain and G is the filter function which decides the scales of eddies.
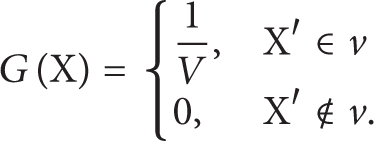
The “top hat filter” operation is widely used on the previous experimental or numerical data:

where V is the volume of a computational element, with the function G expressed as
Thus, the filtered incompressible Navier-Stokes equations can be rewritten as
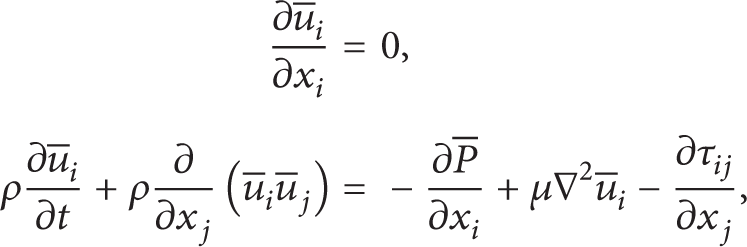
where

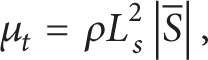
As the subgrid-scale stresses tensor is an unknown quantity, it is necessary to build a model for the subgrid-scale tensor. Therefore, the eddy-viscosity assumption is employed as follows:

where δ
ij
is the Kronecker function,

where

where k a is a von Kármán constant; d is the nearest distance to the solid wall; V is the volume of a computational element; and C w is a constant value of the WALE model, which equals 0.1.
2.3. Governing Equation for Sound Field
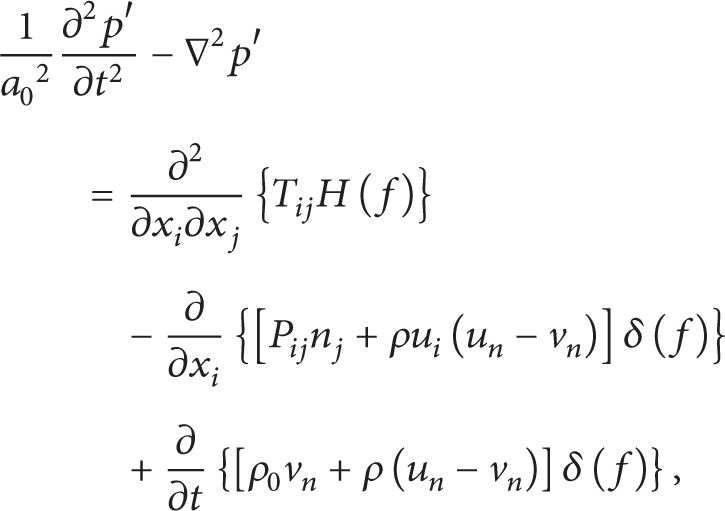
The Williams and Hawkings (FW-H) equation [21, 22] is employed to describe the acoustic field in this study. The equation is expressed as
where a0 is the far-field sound speed. p′ is the sound pressure in the far field. u
n
is the normal component of the fluid velocity. v
i
is the surface velocity components in the x
i
direction. v
n
is the normal component of the surface velocity component. δ(f) and H(f) are Dirac delta function and Heaviside function, respectively. f is a moving Kirchhoff surface
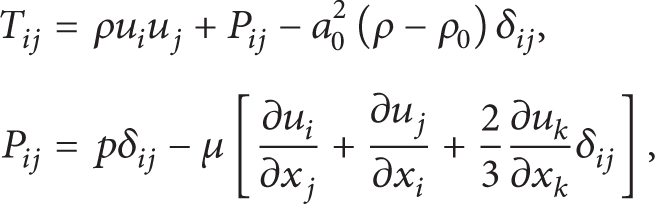
where p is the reference pressure.
In (10), the three terms on the right-hand side represent the contributions of the quadrupole, dipole, and monopole sources, respectively, which are obtained in the unsteady numerical simulations. Using the free-space Green function, the solution to (10) is obtained. When the flow is incompressible, the contribution of the quadrupole sources becomes small and ignorable.
2.4. Grid Distribution and Boundary Condition of Computational Domain and Numerical Scheme
The computational domain of the bionic airfoil is shown in Figure 2. The distance from the Sin surface to the leading edge of the airfoil is 30 times the chord length (c). In both the downstream and crosswise direction, the computational domain of the airfoil is also extended 30 times the chord length (c). At the Sin surface, the velocity-inlet boundary condition is given as the inlet condition. The magnitude of velocity is 7.5 m/s and the direction of velocity is decided by a direction vector along the inlet flow. At the Sout surface, the pressure-outlet boundary condition is given as the outlet condition and the pressure is set as 101325 Pa. In the spanwise direction, the two surfaces, Sp1 and Sp2, apart from 0.2 times chord length (c), are regarded as periodic boundary conditions. The adiabatic and no-slip boundary conditions are applied to the airfoil surface. Near the wall region, the wall function is used and the wall shear stress is solved by the laminar stress-strain relationship.
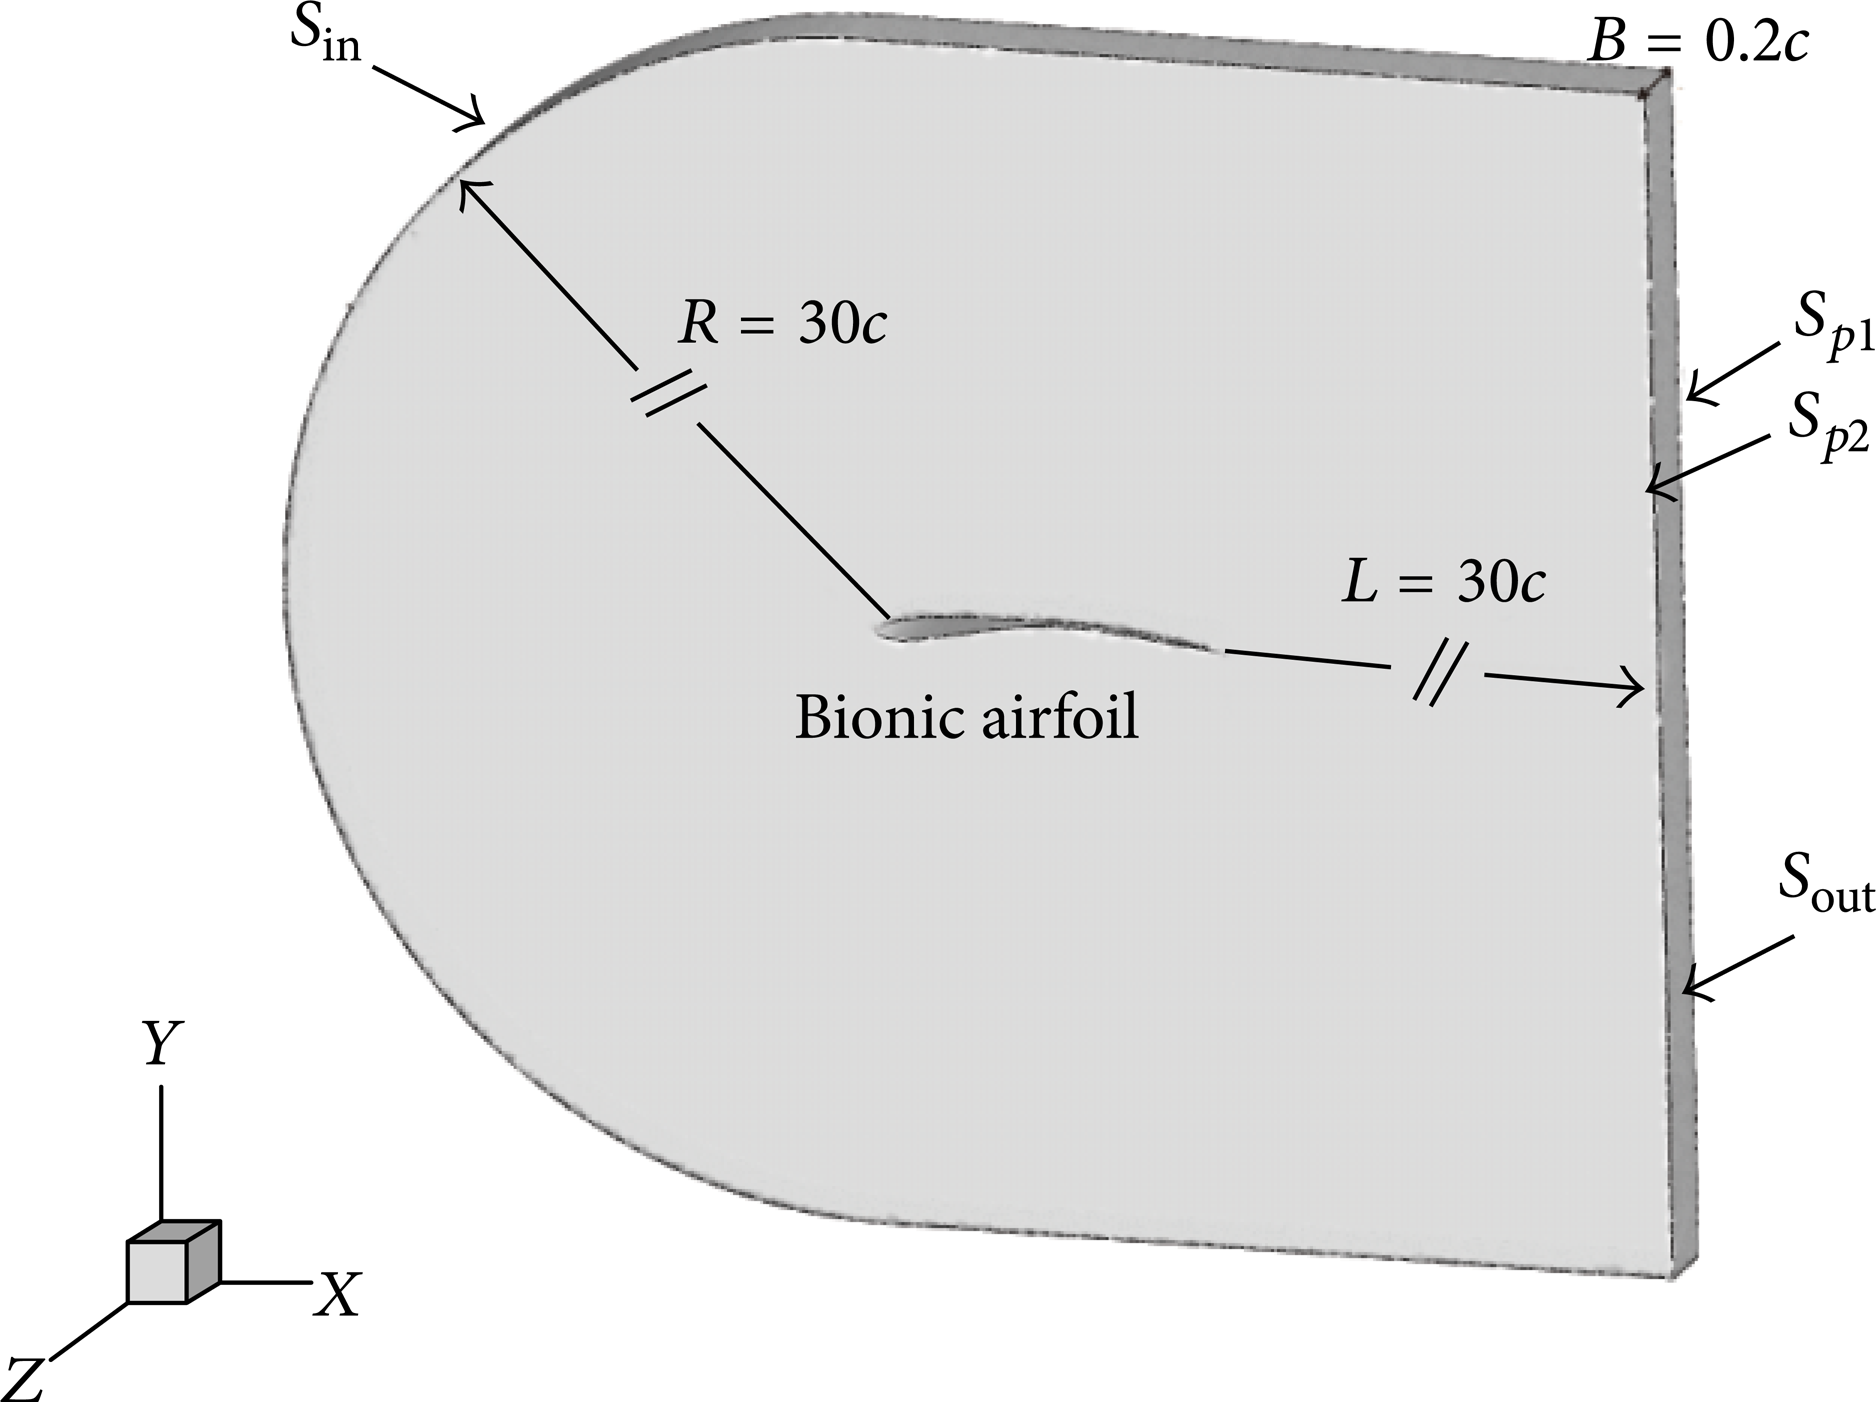
Computational domain and its boundary conditions.
The C-type nonuniform structured mesh is adopted to simulate the flow over the three-dimensional airfoil. In order to ensure the accuracy of the numerical simulation, the effect of the grid number on the lift-to-drag ratio is shown in Figure 3. The grid numbers of 7.0 × 10⁵, 9.5 × 10⁵, 1.2 × 10⁶, 1.45 × 10⁶, and 1.7 × 10⁶ are tested, respectively. As shown in Figure 3, when the grid number is over 1.45 × 10⁶, the variation of the lift-to-drag ratio is lower than 0.1%. In order to obtain more details of the flow fields, the number of 1.7 × 10⁶ was chosen as the computational grid number for the flow simulation of the bionic airfoil. In this grid scheme, the inner mesh size increased gradually according to the distance away from the airfoil surface. The local computational grid distribution near the bionic airfoil is shown in Figure 4. The corresponding grid numbers in the C-direction (ξ), the radial direction (ζ), and the spanwise direction (η) are 680, 125, and 20, respectively.
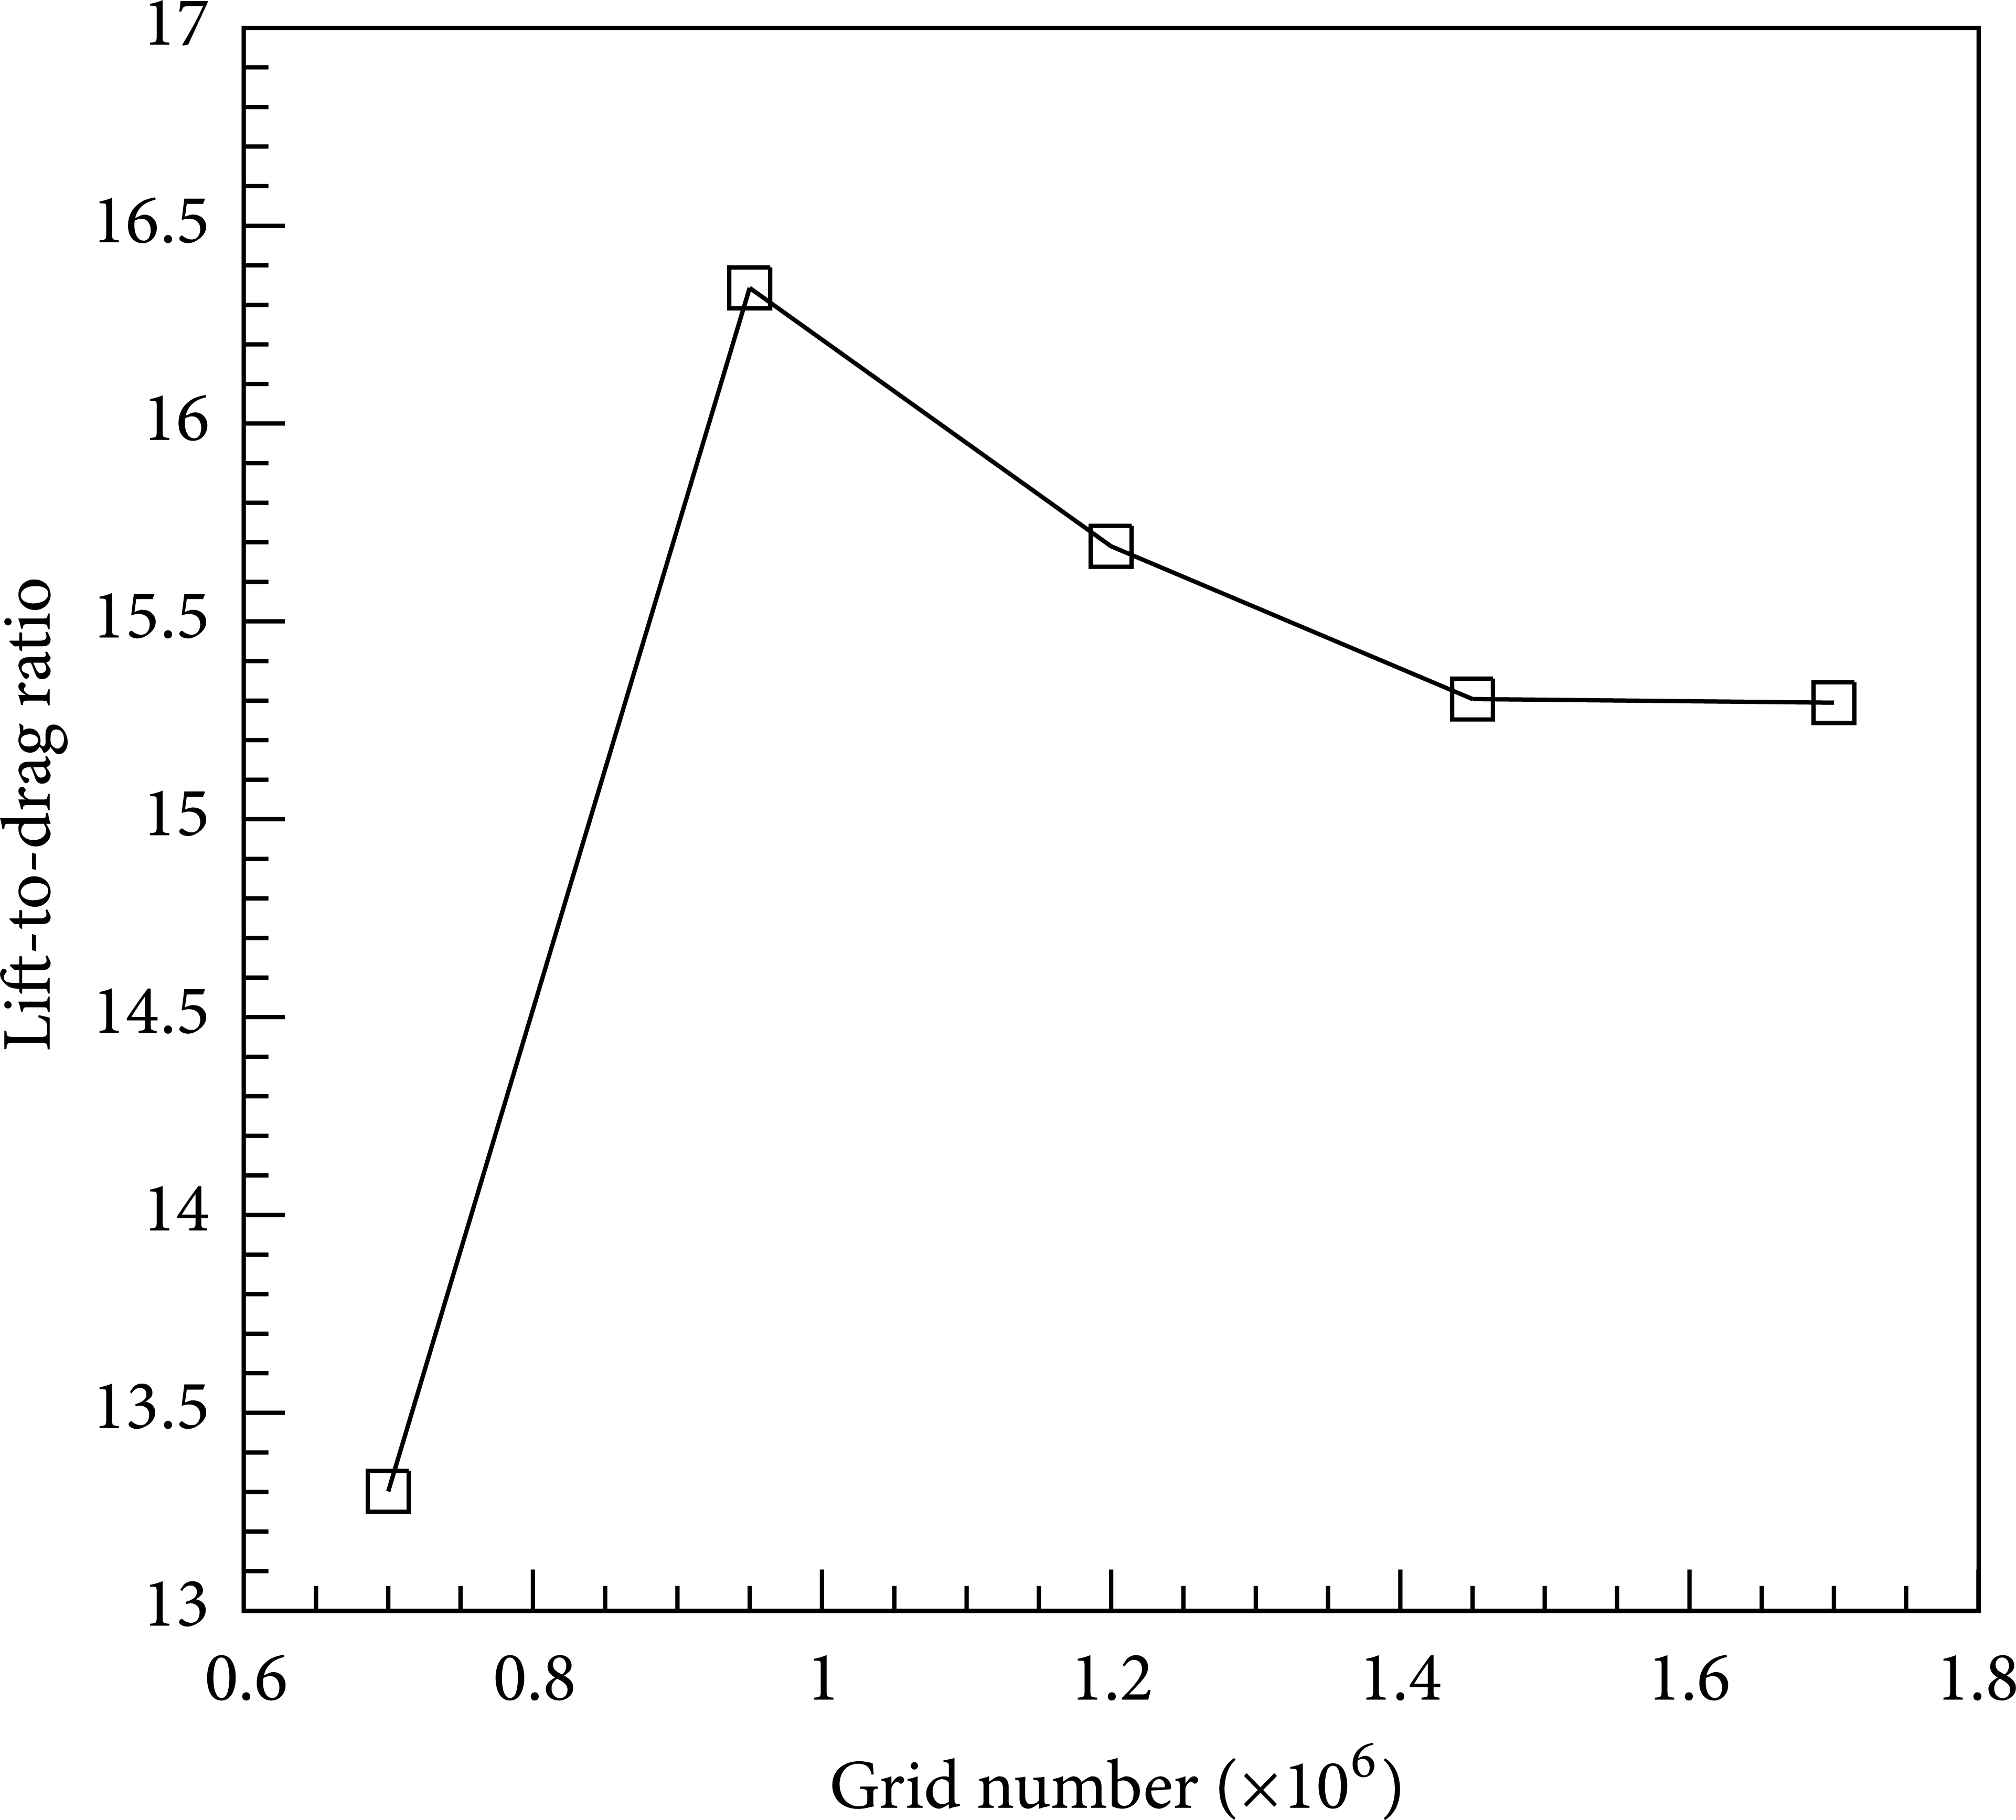
The effect of the grid number on the lift-to-drag ratio.
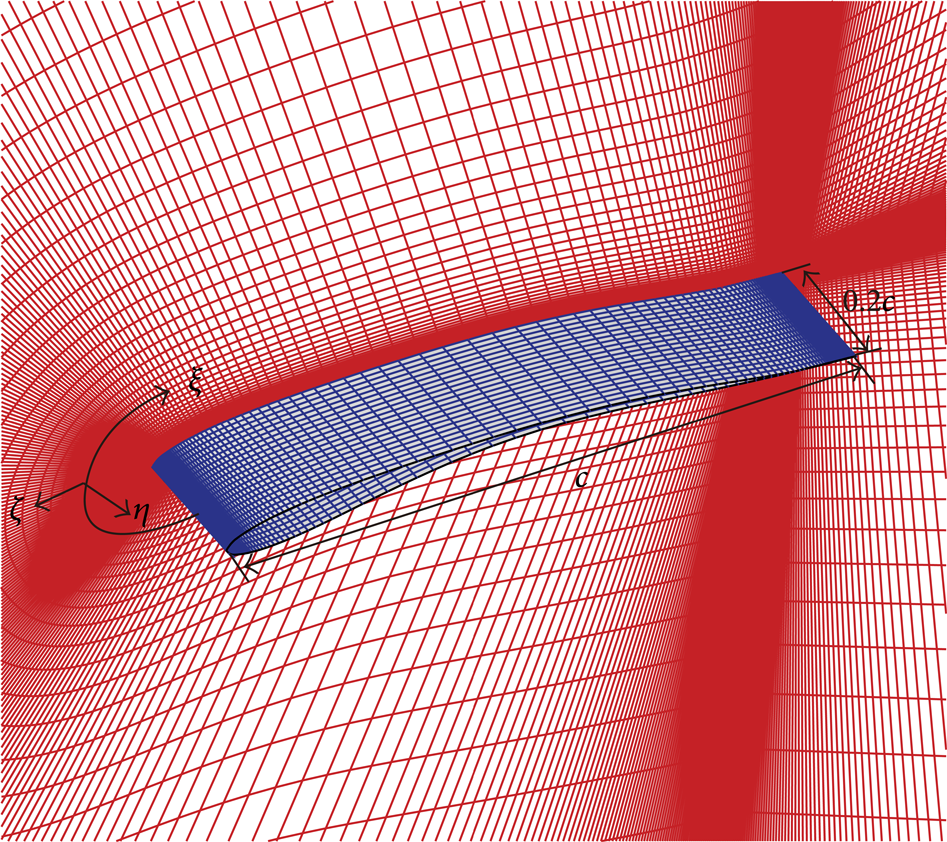
Computational grid of the bionic airfoil.
When the LES model is adopted to simulate the unsteady flow fields, the value of y+ must be less than 1.0 to avoid the calculation error. Here, the meaning of y+ is the nondimensional wall distance between the airfoil surface and the centroid of the first layer of the grid.
The definition of y+ is expressed as follows:
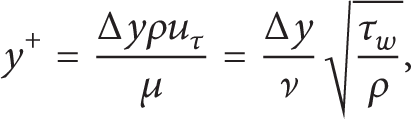
where μ and ν are the kinematic viscosity coefficient and the dynamic-viscosity coefficient of the fluid, respectively. uτ is the wall friction velocity which can be defined by the following equation:
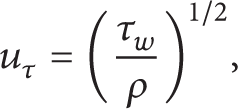
where τ w is the wall shear stress, while Δy is the distance between the blade surface and the first layer of the grid [23].
Figure 5 shows the y+ distribution of the bionic airfoil. The maximum value of y+ for the bionic airfoil under this study is 0.72, appearing at the leading edge of the airfoil, which meets the requirement of the grid distribution near the wall region when the LES method is adopted in the numerical simulation.
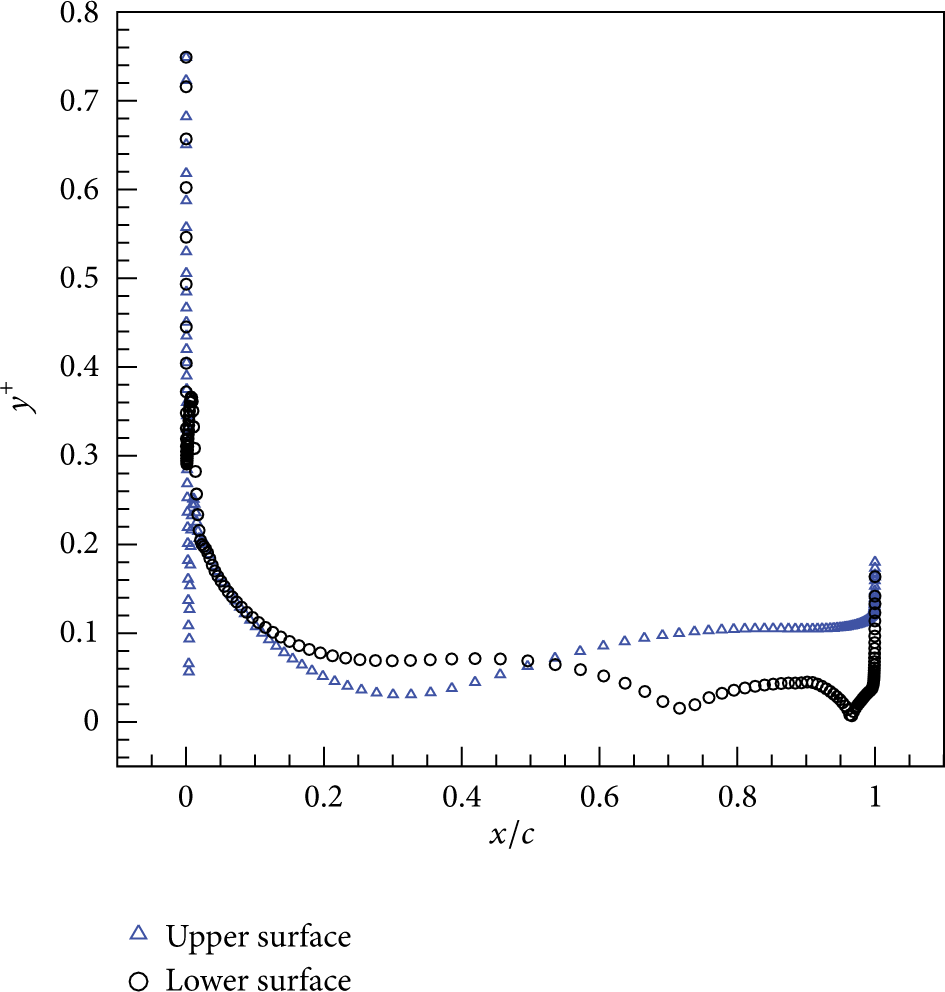
The y+ distribution of the bionic airfoil.
Moreover, a proper time step is also needed to ensure the accuracy and efficiency of the unsteady calculation. Δt = 1.0 × 10⁻⁵ s is small enough to obtain the necessary time resolution and to capture the flow information because it is 1/10 000 of the time that the air flows over the whole flow field when the fluid flow velocity is 7.5 m/s. The number of iterations in each time step is set as 20 iterations and the unsteady field is calculated as 5 000 steps to ensure that the calculation of the field is convergent and stable.
In the numerical simulations, the LES coupled with the WALE subgrid-scale model is used to predict the unsteady flow over the airfoil. Firstly, the steady flow over an airfoil is simulated by using the pressure-based solver and the SIMPLE algorithm is used for pressure and velocity coupling. For the turbulence calculation, the Spalart-Allmaras model is adopted. When the maximum residual of the solution variables is less than 10−4, the steady results are used as the initial flow fields to carry out the LES for the unsteady flow. Spalart-Allmaras turbulence model is changed into LES coupled with the Smagorinsky-Lilly subgrid-scale model. The unsteady flow variables provided by the CFD calculations are used as inputs in the FW-H equation to predict the acoustic behavior of the airfoil numerically. The finite volume method is adopted to solve the flow equations. For the time-dependent term, the implicit second-order scheme is adopted. The second-order upwind scheme is used to discrete the convection term. For the discretization of diffusion term, the second-order central difference scheme is used.
3. Results and Discussion
3.1. Instantaneous Fields
The instantaneous three-dimensional flow fields of the bionic airfoil are shown in Figure 6. The angle of the attack for the bionic airfoil varies from 0.0 degrees to 9.0 degrees, and the streamline is also depicted in Figure 6. As shown in Figures 6(a) and 6(b), the separation bubbles appeared on both the deep concave of the pressure side and the trailing edge of the suction side. When the angle of attack (AOA) is 0 degrees, the flow separation on the pressure side happened at 15% of the chord length, and the flow reattachment can be observed at 71% of the chord length. Meanwhile, a smaller bubble is observed on the trailing edge of the suction side. The two separation bubbles are caused by the owl-like unique geometry characteristics of deep concave and long thin trailing edge. As the AOA increases to 1.5 degrees, the scale of two separation bubbles becomes smaller. The flow separation over the pressure side occurred at 21% of the chord length, with the flow reattachment happening at 58% of the chord length and the separation bubble on the suction side almost vanishing.
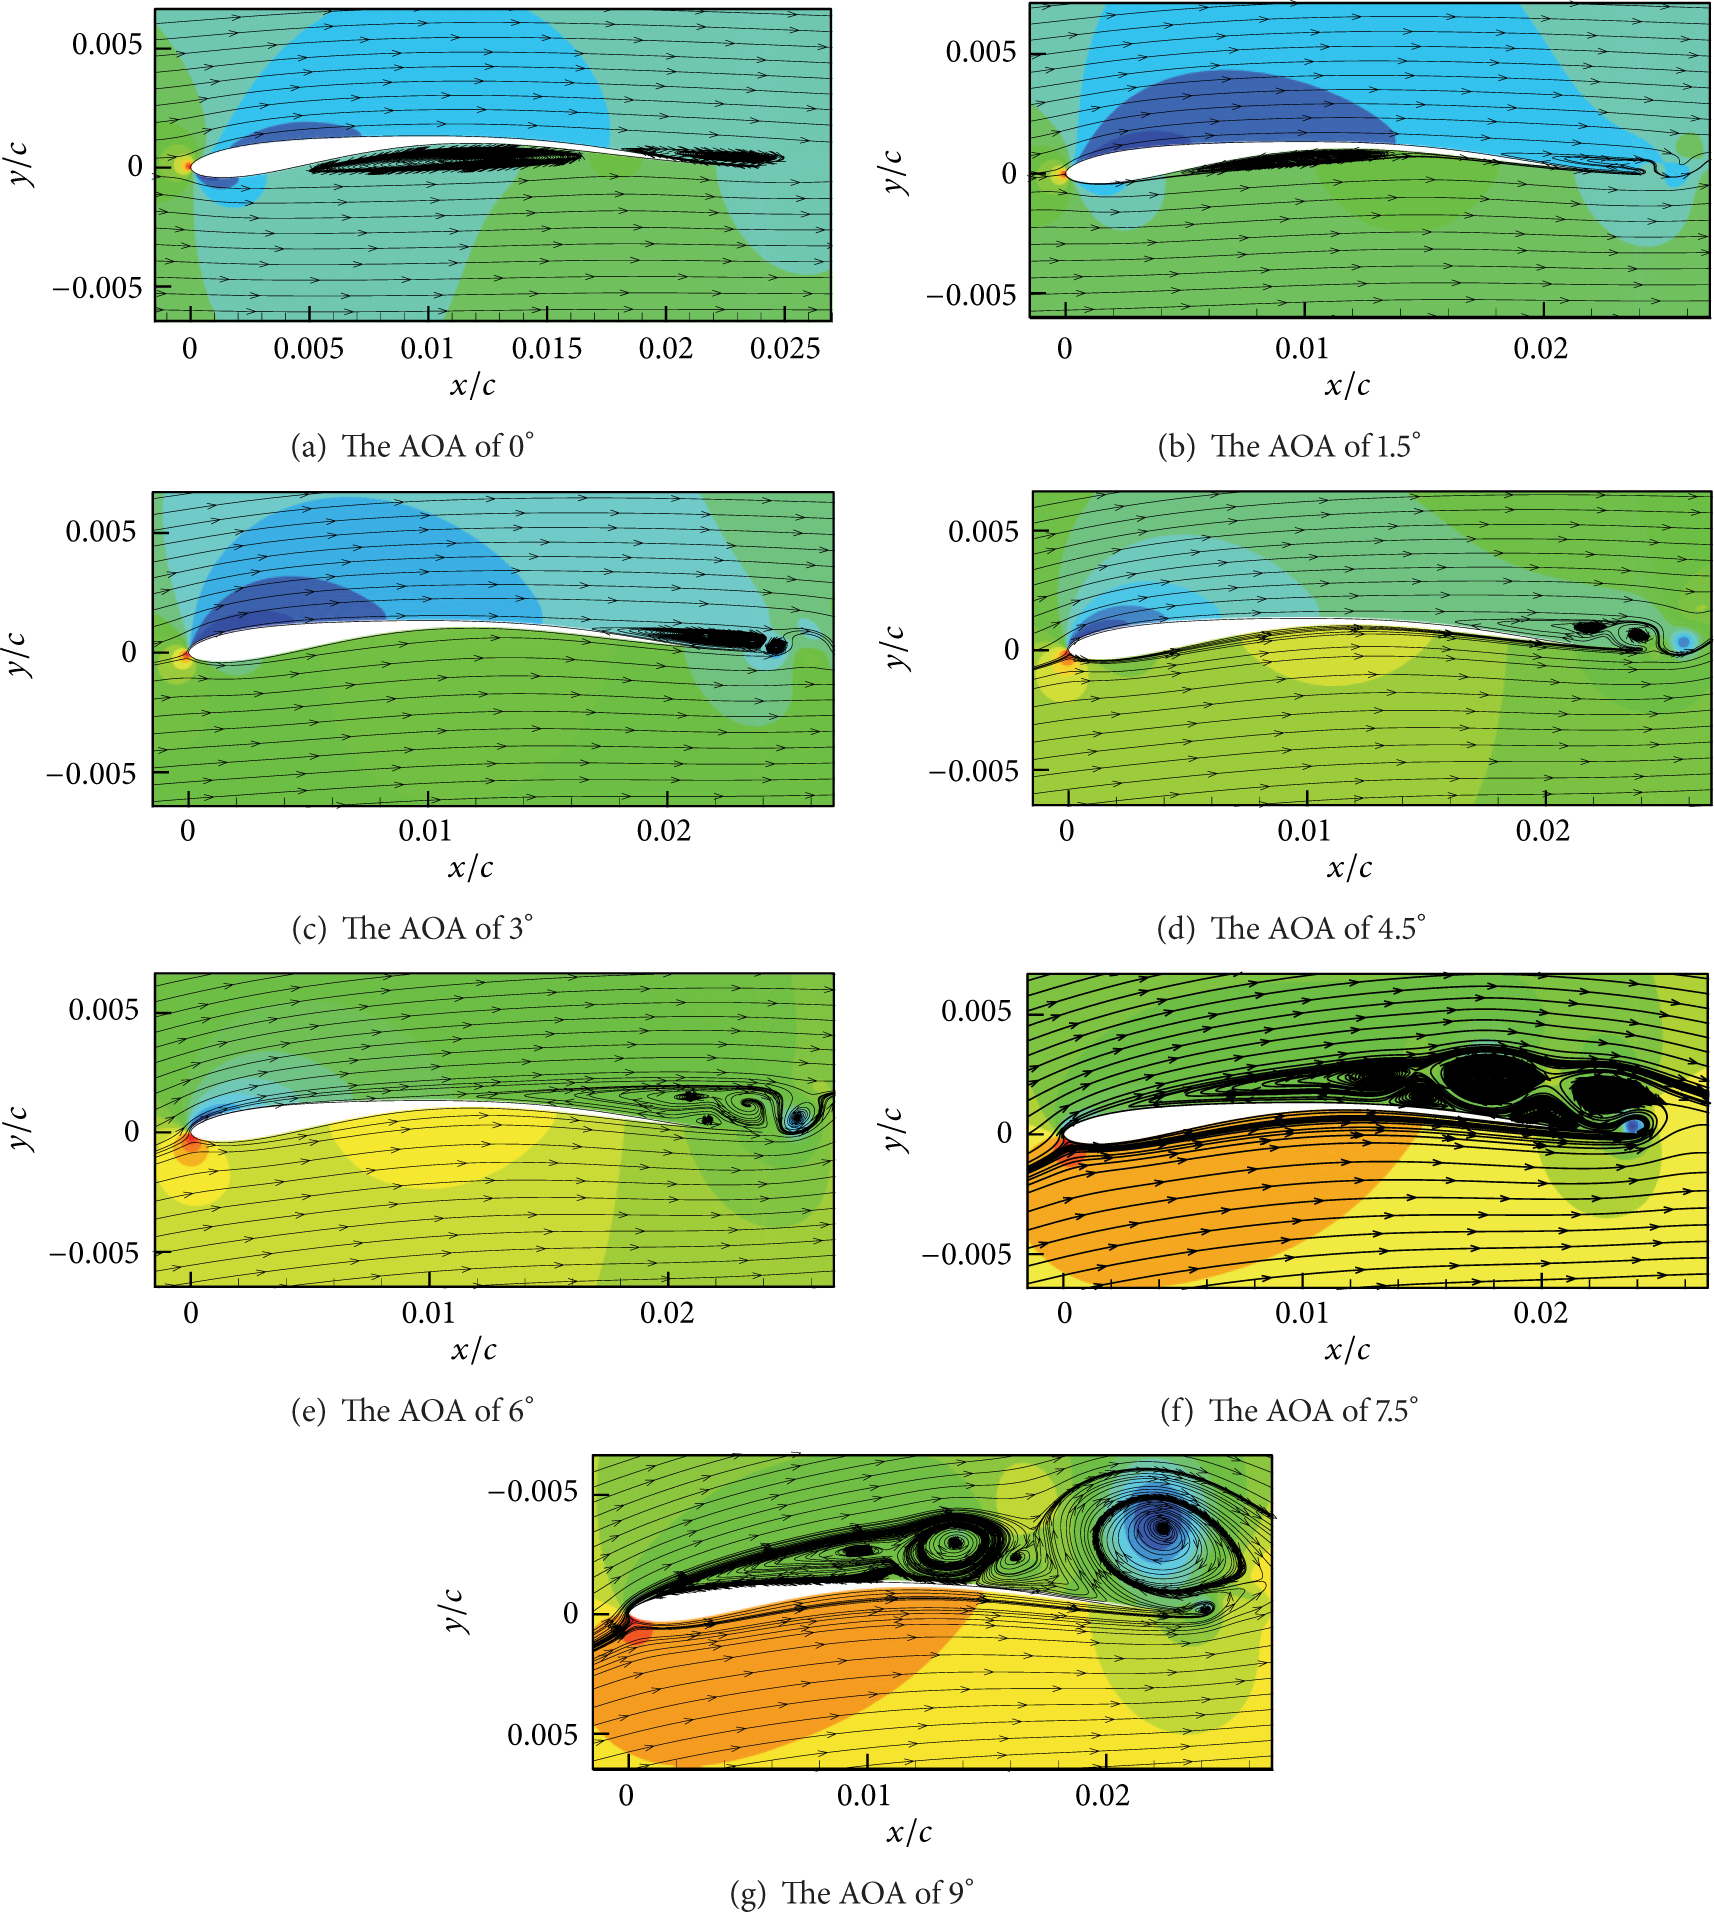
Time-flow fields of the bionic airfoil.
As shown in Figures 6(c)–6(g), the separation bubbles on the pressure surface are completely suppressed. However, the scale of the separation bubbles on the suction side increases with the increase of the AOA. At the AOA of 3.0 degrees, the separation point on the suction side reaches 70% of the chord length. When the AOA increases to 4.5 degrees, the scale of the separation bubble on the suction side is almost the same. However, the eddy observed in the separation bubble at AOA of 3.0 degrees is divided into two small eddies. The separation point continuously moves to the leading edge of the suction side when the AOA increases. At the AOA of 7.5 degrees, the separation point on the suction side reaches 8% of the chord length and the scale of the separation bubble keeps increasing. It can be observed that the separation bubble contains three eddies. At the AOA of 9.0 degrees, the separation point is at the leading edge of the bionic airfoil. The suction side of the bionic airfoil is completely covered by the flow eddies.
In order to show the variation of the separation bubbles clearly, the locations of the separation point on both the pressure side and the suction side are shown in Tables 2 and 3. And the generation of the separation bubble on the pressure side and the suction side can be seen in Figure 7. It should be noted that the reattachment points cannot be observed on the suction side.
Separation point on the pressure side.

Separation point on the suction side.


Locations of computed separation points and reattachment points.
3.2. Lift Coefficient and Drag Coefficient
The lift coefficient and the drag coefficient of the bionic airfoil at the AOA from 0 degrees to 9.0 degrees are shown in Figures 8 and 9, respectively. As shown in Figure 8, it can be seen that the value of the lift coefficient increases with the increase of the AOA. The separation appears on the pressure side when the AOA is less than 3.0 degrees. When the AOA is more than 3.0 degrees, the separation is found on the suction side. And the lift coefficient increases linearly as the AOA increases. It can be found in Figures 6 and 8 that the value of the lift coefficient is proportional to the scale of the separation bubble when the separation appears on one side of the bionic airfoil. However, when the AOA is 3.0 degrees, the separation bubble varies from the suction side to the pressure side. And the value of the lift coefficient gets a significant promotion. Therefore, it can be concluded that the scale and the location of the separation bubble play an important role in the characteristics of the lift coefficient.

The lift coefficient (C L ) of the bionic airfoil at different angle of attack.

The drag coefficient (C D ) of the bionic airfoil at different angle of attack.
Unlike the lift coefficient shown in Figure 8, the drag coefficient shown in Figure 9 reaches the minimum value of 0.037 at the AOA of 1.5 degrees. The scale of the separation bubble shown in Figure 6(b) is smaller than that of any other conditions. It can be explained that the owl-like geometry characteristics fit the flow at the AOA of 1.5 degrees well. When the AOA is more than 1.5 degrees, the value of the drag coefficient increases with the increasing AOA, which is just similar to that of other airfoils.
Finally, the lift-to-drag ratio of the bionic airfoil is investigated. In order to show the aerodynamic characteristics of the bionic airfoil, obviously, the standard NACA 0006 airfoil with the similar relative thickness of 6.0% is selected as the referenced airfoil. The variations of the lift-to-drag ratio of the bionic airfoil and NACA0006 airfoil with the AOA are plotted in Figure 10. It can be found that the lift-to-drag ratio of the bionic airfoil is greater than that of the standard NACA0006 airfoil at every AOA. The maximum value of the lift-to-drag ratio of the bionic airfoil reaches 15.32 at the AOA of 6 degrees, while the maximum value of the lift-to-drag ratio of the standard NACA0006 airfoil is 10.27.
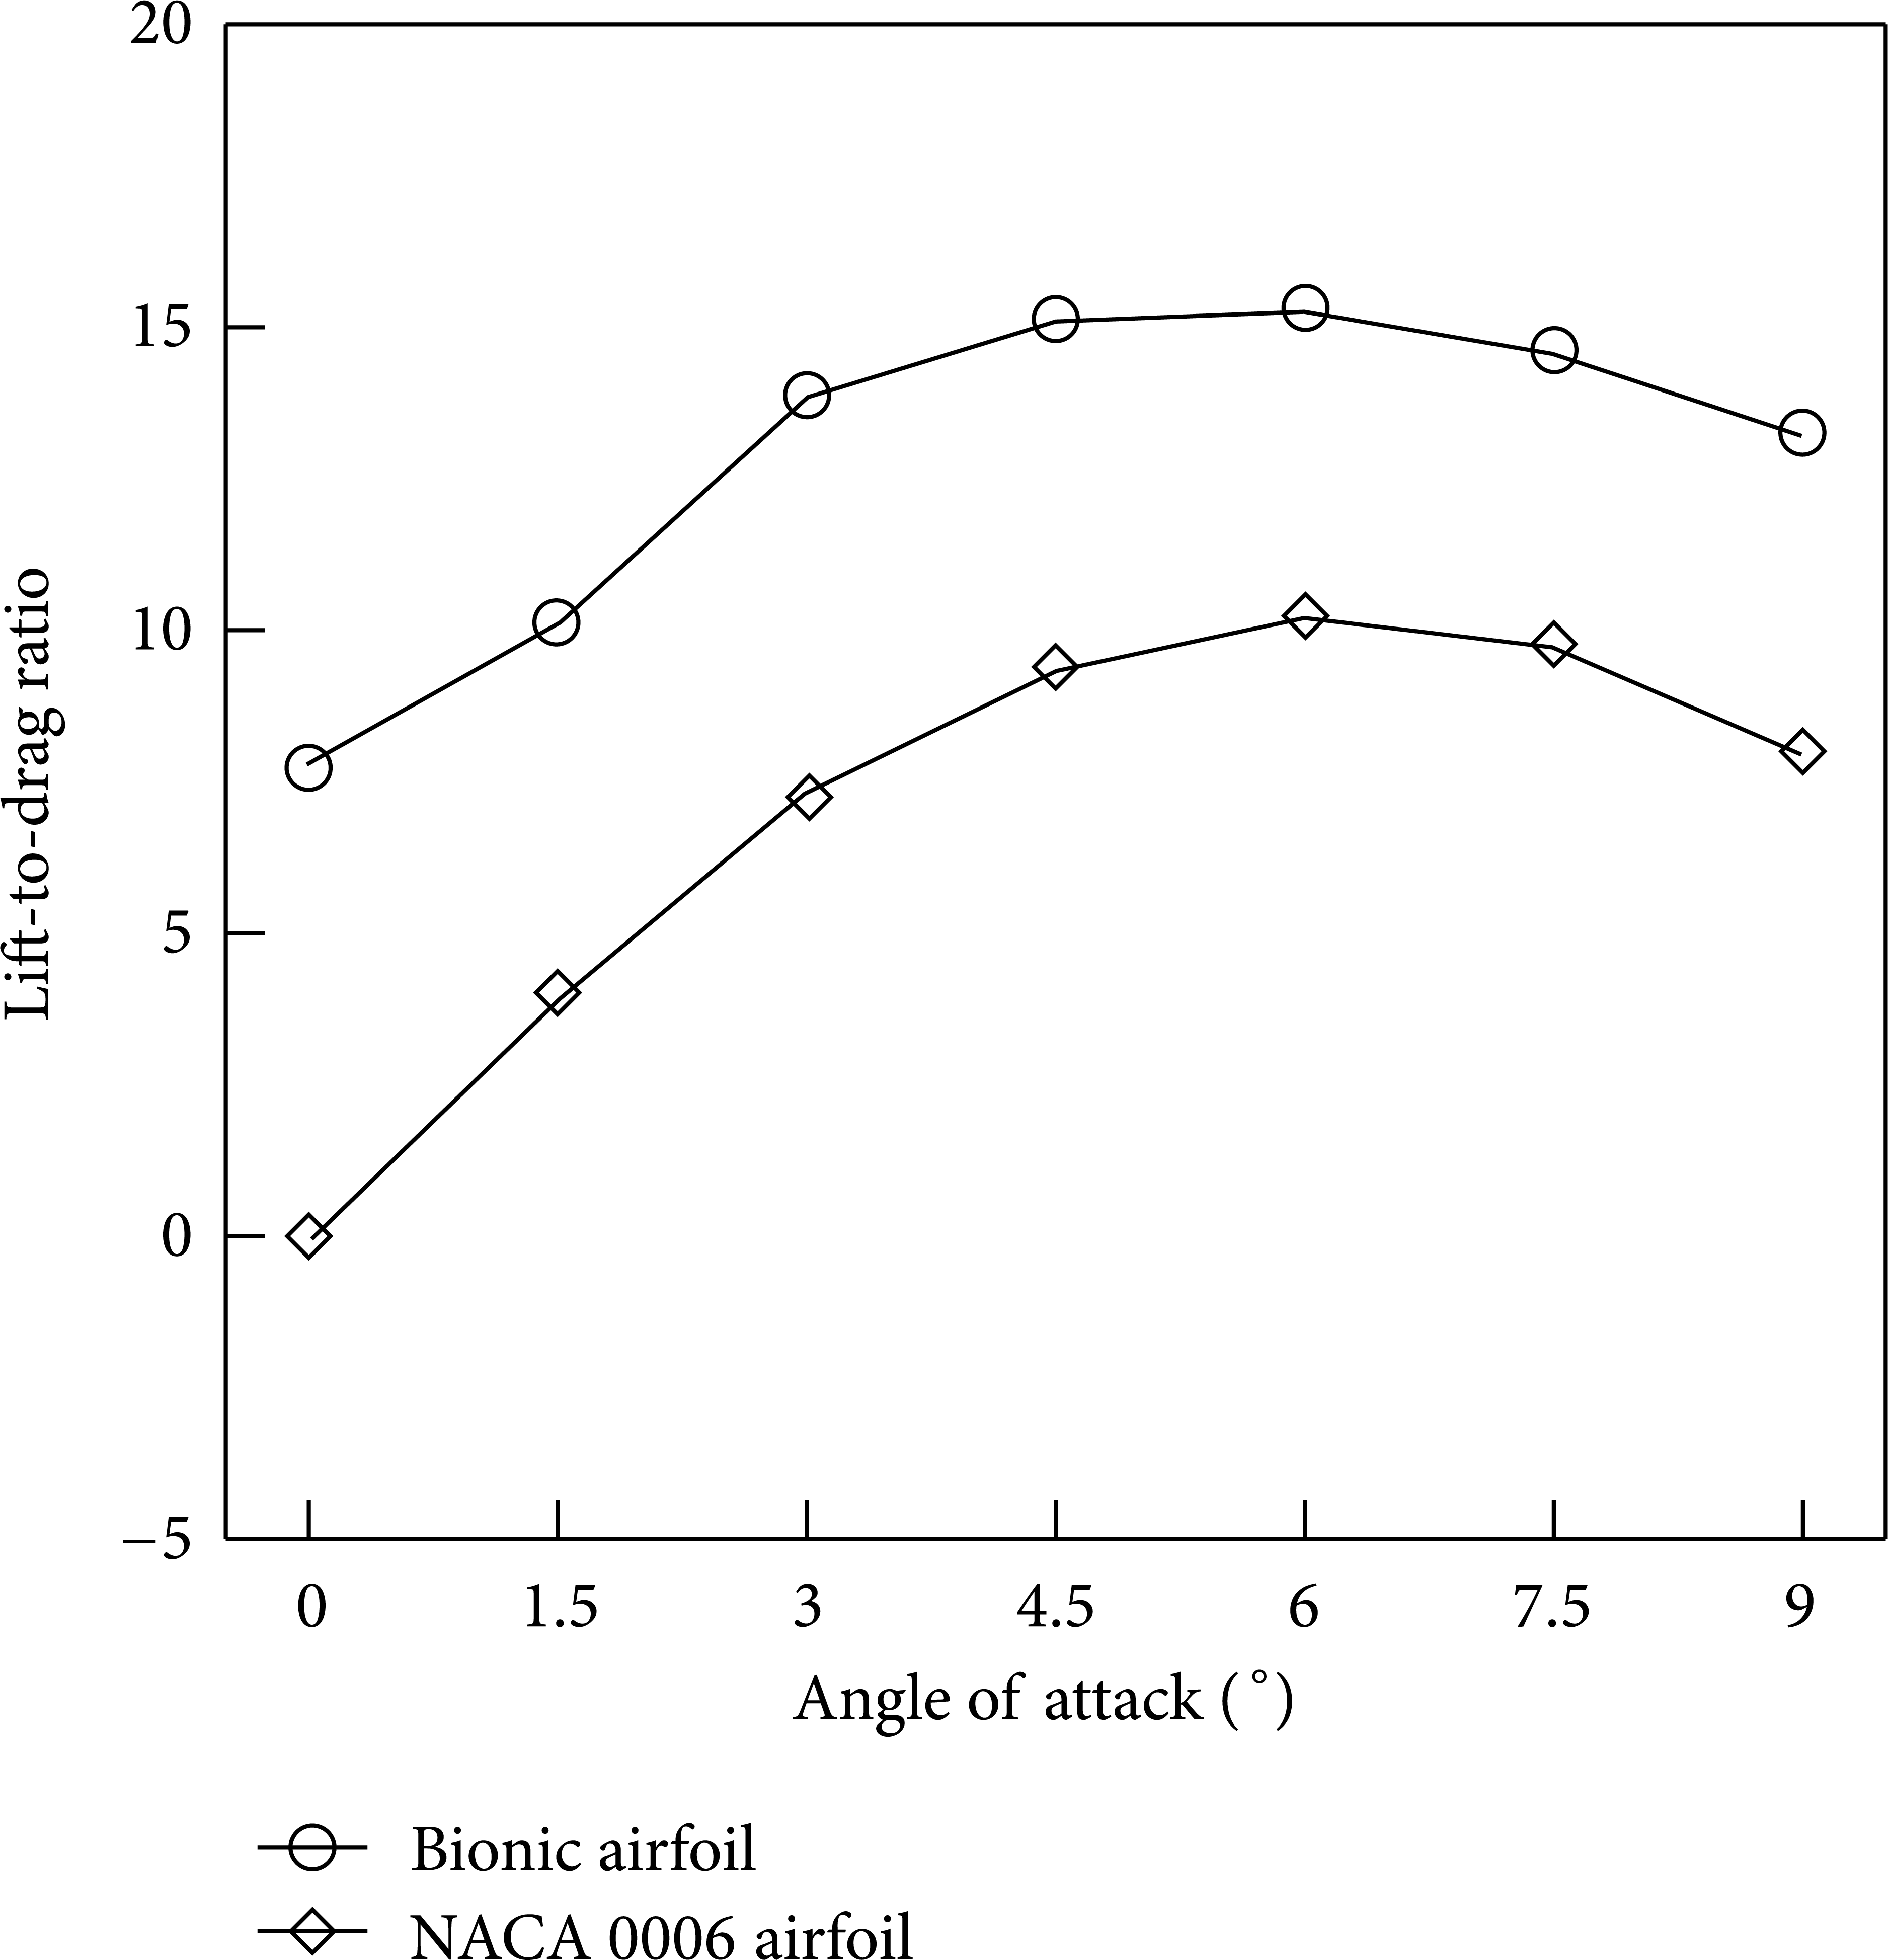
The lift-to-drag ratio of the bionic airfoil and NACA 0006 airfoil at different angle of attack.
3.3. Sound Field Analysis
The analysis of aerodynamic characteristics for the bionic airfoil was also included in the present study to realize the noise reduction of multiblade centrifugal fan in our future work. In order to consist with the blade installation angle, the AOA of 9.0 degrees is adopted by the bionic airfoil in this study.
The locations of 12 noise receiving points in the numerical simulation are shown in Figure 11. The distance from the receiving points to the leading edge of the bionic airfoil is 15 c.

The acoustic source and the receiving points.
The results show that the A-weighted sound pressure levels (SPL) of the 12 receiving points are in the range of 3.9 dB to 28.3 dB and that the average value is 21.7 dB. The scaled directivity of the sound is shown in Figure 12. The values of the SPL in different angles can be seen in the flow field. It should be noted that the SPL of the receiving points 1 and 7 is much lower than that of other receiving points. The sensitivity of the directivity may be due to the effect of the interference. Moreover, the SPL of receiving points 4 and 10 are the two maximum values in the flow field beyond 28 dB. The scaled directivity shows some characteristics of the distribution of the dipole sources, which suggests that the dipole sources play a main role in the sound field.

The scaled directivity of the sound.
The receiving point 4 obtaining the maximum value of the SPL was selected as the research point. Figure 13 shows the SPL distribution of the receiving point 4 when the frequency varies from 0 Hz to 15,000 Hz. It can be found that the peak sound pressure level of the bionic airfoil is about 22.6 dB at f = 192 Hz and the SPL at a low frequency is much higher than that at a high frequency. It can be explained that the inlet velocity of the flow field is not high enough to form the high frequency eddies. As a result, it can be concluded that the noise at a low frequency is the main component in the sound field at a relatively low Reynolds number.

The SPL distribution of the receiving point 4 for the bionic airfoil.
Figure 14 shows the distribution of dP/dt on the airfoil surface, a reflection of the variation of the pressure with time. It can be seen from Figure 14 that the values of dP/dt are related closely to the locations of the eddies near the airfoil. The maximum values of dP/dt appear on the trailing edge of the bionic airfoil where the largest scale of eddies appears. Moreover, as is shown in Figure 14, the values of dP/dt on the rear of the suction side are greater than those of the pressure side. As a result, most eddies are formed on the rear of the suction side. It can be concluded that the sudden change of the pressure on the surface of the airfoil has great influence on the generation of eddies in the unsteady flow field.

The distribution of dP/dt on the surface of the bionic airfoil.
It is known that the pressure pulsation over the airfoil is correlated with the propagation of the acoustic sources. The distribution of dP/dt on the surface of the airfoil shows that the main acoustic sources are on the rear of the airfoil. Therefore, suppressing the scale of eddies over the rear of the airfoil is one of the important technological approaches to reduce the aerodynamic noise of the airfoil.
4. Conclusions
The flow fields around bionic airfoil at Reynolds number of 12,300 are investigated with large eddy simulation when the AOA varies from 0 to 9.0 degrees. The FW-H equation is added to the large eddy simulation to predict the sound pressure level at the AOA of 9.0 degrees. The results demonstrated that with the same relative thickness, the bionic design of the airfoil is more effective than NACA 0006 in improving the lift-to-drag ratio.
The separation points, reattachment points, and separation bubbles on both the pressure side and the suction side are analyzed on the instantaneous flow around the bionic airfoil. The results implied that the values of lift coefficient and drag coefficient are correlated with the location and scale of the separation bubbles. Moreover, the owl-like unique geometry characteristics with deep concave and long thin trailing edge also increase the lift-to-drag ratio. As a result, the lift-to-drag ratio of the bionic airfoil is much higher than that of NACA 0006 airfoil.
The sound field around the bionic airfoil was predicted numerically. Firstly, the scaled directivity of the sound field was investigated. The distribution of the directivity suggests that the dipole sound is dominative in the sound field. Secondly, by predicting the SPL of the bionic airfoil, it can be found that the maximum value appears at a low frequency. According to these results, further research on the dipole sources and the noise under the low frequency is needed on the reduction of the SPL of the bionic airfoil. Finally, the main acoustic sources were observed by analyzing the distribution of dP/dt on the bionic airfoil surfaces.
Conflict of Interests
The authors declare that there is no conflict of interests regarding the publication of this paper.
Footnotes
Acknowledgments
The work presented here was supported by the Doctoral Program of Higher Education of Special Research Fund (Grant no. 20120201110064) and Shaanxi Province Science and Technology Research and Development Program of China (Grant no. 2014K06-24).