
Abstract
External gas-assisted injection molding (EGAIM) technology can be applied to effectively reduce the sink marks generated from the shrinkage of plastic parts. In this paper, the interaction mechanism of gas and melting during the EGAIM stage was discussed. The causes of the sink marks on plastic parts as well as the influence of gas-melting interaction on the sink marks were analyzed. A corresponding physical model was established. Using plastic plate parts with stiffeners, for example, the EGAIM process was one-parameter simulated using Fluent software. The sink marks on the stiffeners, the interface morphology between the condensate layer and the gas, and other parameters were obtained. The effectiveness of the model, as well as the simulation process, was confirmed by experiment.
1. Introduction
Gas-assisted injection molding (GAIM) is divided into two categories: internal gas-assisted injection molding and external gas-assisted injection molding (EGAIM). Different than the internal gas-assisted injection molding process in which the gas is injected into the interior of plastic melts, the EGAIM process injects the gas into the space between the melt and cavity after the melt filling procedure for maintaining auxiliary pressure. Hence, there is no air inside the melt. As a result, in the cooling stage, the gas acts uniformly on the condensate layer for pressure maintaining and feeding, reducing the defects of sink marks and warpage of the plastic parts.
The main difference between the EGAIM process and other conventional injection molding processes is the packing procedure. Both the material curing and the gas interaction take place in the packing procedure of EGAIM. Up till now, the research of EGAIM focused mainly on the influence of process parameters on the quality of the formed products. For example, Hendry [1] studied complex plastic products with many stiffeners and analyzed the pressure distribution of the internal cavity and the shrinkage of the products under three different conditions: no packing, traditional packing, and EGAIM packing. Chen and Chang [2] simulated the melt filling stage and the gas packing stage of the EGAIM process by using finite element software Modex3D and ANSYS and assumed that the melt was Newtonian fluid. However, a mathematical model established using basic viscous fluid dynamics could not accurately describe the melt flow of the EGAIM process. In this paper, the sink marks of the plastic parts were applied as the index to analyze the EGAIM process, and the influence of the gas-melt interaction on the sink marks was discussed mainly on the view of polymer mechanical properties. Based on the basic equations of viscous fluid dynamics, a mathematical model for EGAIM was established. Using plastic plate parts with stiffeners, for an example, the EGAIM process was one-parameter simulated using Fluent software. The sink marks on the stiffeners, the interface morphology between the condensate layer and the gas, and other parameters were obtained. The effectiveness of results was confirmed by experiment.
2. Analysis of the EGAIM Process
EGAIM is a technique derived from conventional GAIM that is specifically designed to treat plastic parts that do not have airways. It is mainly used to tackle the sunken deformation—the sink mark—in the thick sides of the plastic parts. While EGAIM is very similar to conventional injection molding, it has an advantage during the pressure maintenance stage. In this section, we extensively discuss the impact of gas on the melt during the pressure maintenance stage.
2.1. The Impact of Gas on Sink Marks
The reinforced plastic parts interface is shown in Figure 1, where h stands for the sink mark depth. In EGAIM, the gas works in two ways: first, the gas imposes pressure on the entire surface and, second, the gas imposes pressure on stiffeners along the contracting regions. With the variation of temperature and pressure during the EGAIM process, the melt is influenced by several factors, such as thermal expansion and contraction, molecular orientation, and density changes. The volume of the melt contracts during the cooling and solidification procedure [3]. Firstly, a condensate layer with a certain thickness forms near the inner face of the cavity after filling, as shown in Figure 1(a). With the decrease of the melt surface temperature, the thickness of the condensate layer gradually increases, which is pulled into the interior of the melt, generating the sink marks. Then, with the injection of the gas, the melt is gradually pushed to the other side of the cavity surface and the contraction volume of melt is complemented by filling melt. Meanwhile, the melt activated by gas is pushed to the shrink parts for feeding, improving, and gradually eliminating the sink marks. (As shown in Figure 1(b), the sink mark depth h gradually decreases to zero.) After that, the melt surface is close to the other side of the cavity, maintaining the gas pressure and the previous state (Figure 1(c)). Finally, the thin wall is completely solidified (Figure 1(d)), while the melt at the root centre of the stiffener is not completely solidified and is continuing to shrink. However, the gas pressure is insufficient to maintain the state shown in Figure 1(c), and the sink marks reappeared. Nevertheless, the depth of sink marks is greatly reduced compared to those without gas packing.

The variation of sink marks under gas effect [14].
2.2. The Action of Gas on the Condensate Layer
The packing effect of the EGAIM process is mainly related to the pushing capability of the gas, promoting the solidification of the plastic with high quality surface requirements close to the cavity wall. The injected gas interacts directly with the condensate layer. With the continuous shrinkage of the internal melt and the pushing effect of the gas, the surface interacts with the gas, departing from the surface of the mold core and increasing the surface area, which indicates that the surface of the condensate layer is extended under the action of the gas. Hence, the gas should overcome the deformation resistance of the condensate layer when it pushes the melt flow throughout the mold.
According to the temperature dependence property of the polymer deformation during the solidification of the melt, the noncrystalline polymer transitions from a viscous flow state to a glassy state. In the transition, the polymer undergoes a special state, known as the high elastic state, in which the modulus of elasticity reduces 4 to 5 orders of magnitude and the shear modulus reduces 3 orders of magnitude compared to those in a solid state. In a certain temperature range, modulus varies little with the temperature. There, the condensate layer within a certain range of temperature and time has strong elasticity and flexibility to meet the requirement of the gas interaction in the EGAIM process. Different from a noncrystalline polymer, a crystalline/semicrystalline polymer has no high elastic state and directly transits into the viscous flow state above the temperature T g , whose deformation property is insufficient to bear the gas effect. Meanwhile, the formed crystalline/semicrystalline material would still shrink after demolding due to the crystallization process, greatly reducing the EGAIM effect. Hence, EGAIM is not suitable for eliminating sink marks in crystalline/semicrystalline polymer plastic parts. However, the warping of parts can be eliminated because of the uniform gas pressure of EGAIM.
As the deformation resistance of the condensate layer increases with the increase of the thickness, the packing effect of gas becomes invalid when the pressure is insufficient to extend the condensate layer. The thickness of the layer is mainly related to the mold temperature. In the delay time of the gas, the lower the temperature of the mold, the thicker the condensate layer. According to [2], longer delay time will lead to the reduction of the packing effect. However, if the gas delay time is too short or the mold temperature is too high, strength or thickness of the condensate layer may be insufficient to bear the gas pressure, leading to the gas penetrating the condensate layer into the melt or the other side of the cavity.
2.3. The Melt Flow Pushed by Gas
The gas above the condensate layer indirectly promotes the flow of melt. According to Pascal's principle in fluid dynamics, it can be considered that the gas pressure on different positions of the melt is uniform. When the melt begins to shrink, the pressure of shrinkage changes, and the gas promotes the melt for feeding. The melt viscosity is the most important impact factor in this process. For the melt at the packing stage with a low shear rate, as the temperature decreases, the apparent shear viscosity varies in the range of 103~104 Pa·s. As the melt solidifies, it is more and more difficult for the gas to push the melt flow; that is, higher gas pressure or a shorter delay time is required to ensure the effect of the gas.
3. The Mathematical Model for Packing Stage of EGAIM
According to the above analysis and the physical description, as the two kinds of fluids (gas and melt) interact in the EGAIM packing stage, the molding process is very complex. However, melt model should be based on the flow state of nonisothermal non-Newtonian fluid [4], and the main problem is still the interaction of the fluid. Therefore, in this paper, the flow field was solved by using the melt flow equation with the boundary conditions of gas pressure at the interface between the gas and the melt, establishing the model for packing stage of EGAIM.
3.1. Flow Model
For the conventional injection molding process, the inlet pressure of packing is a known quantity, solving the fluid flow. For the EGAIM packing process, the pressure is a known quantity. As the gas packing replaces the traditional packing, the melt mass is nearly unchanged. Because of the small Reynolds number of the melt in the packing process, the inertial force can be ignored, that is, assuming the steady state and ignoring the convection term. Comparing the effect of pressure in the packing process, the effect of melt gravity is too small to be ignored. The elasticity effect of the melt flow is ignored, only considering the elasticity of the solidified condensate layer. There is no heat source either inside or outside the melt. Different from the conventional packing process, the melt flows mainly along the thickness in a z-direction because of the gas pressure. Therefore, only the z-direction movement, pressure variation, and heat transfer are considered. As the melt flow is much slower than that in the filling stage, the working of shear stress (shear heating) is ignored. Melt flow equations used to describe the packing process could be expressed as follows.
Continuity equation is given as follows:

Equation of motion is given as follows:
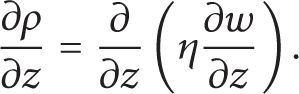
Energy equation is given as follows:

where u,v,w are the velocity components of the melt in the direction of x,y,z; ρ is the density; t is the time; C p is the specific heat capacity at constant pressure; T is the fluid temperature; k is the thermal conductivity of the fluid.
3.2. The Effect of the Gas
As shown in Figure 2, the condensate layer is subjected to the action of the gas with the pressure p. Taking microcell abcd projected on the xy plane, the force F t is related to the pressure p [5]:

where the boundary of condensation layer is x-y plane, z is the sag, F t is the tension per width unit on the condensate layer, and p is the gas pressure.
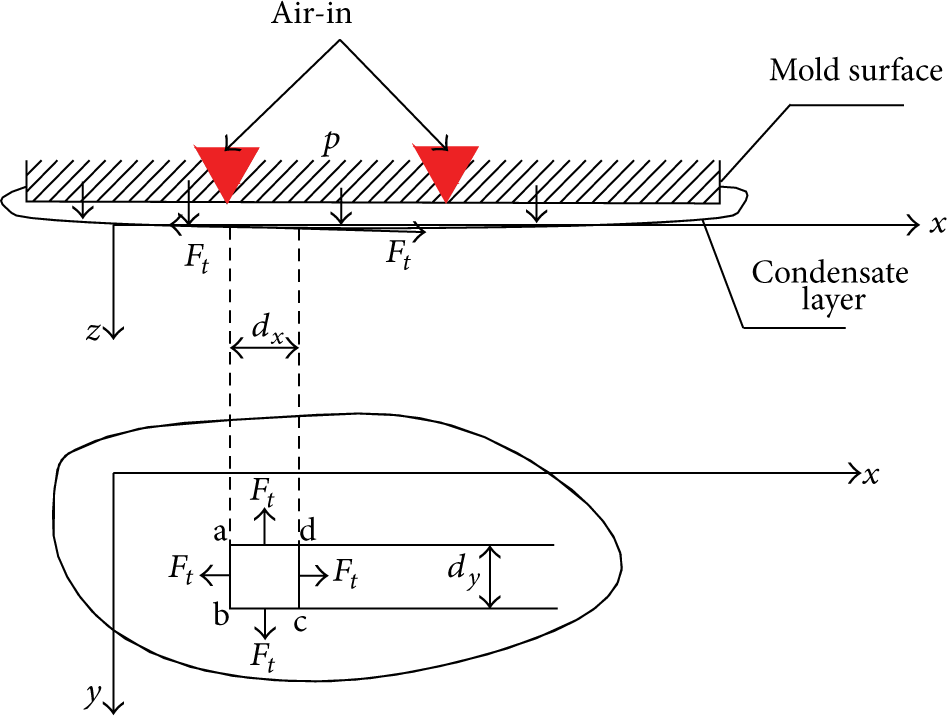
The influence of the gas on the condensate layer.
As p increases, F t increases, pulling condensation layer. When F t is large enough, the condensation layer is ruptured and the gas penetrates into the melt. For EGAIM, the gas flow process is very short, and the viscosity and density are also much smaller than those of the plastic melt. Hence, the gas can be considered as an incompressible fluid, ignoring the viscosity and density. The cavity pressure is considered equal everywhere and only changes over time; p = p(t). Compared to the internal gas-assisted injection molding process, the gas layer for EGAIM is very thin. As the thermal conductivity of the gas is very small, the energy exchange of the internal gas can be ignored. The internal temperature of the gas could be considered equal everywhere and only changes over time.
3.3. Material Model
Accompanied with the cooling of the material in the packing process, the temperature of the material, density, and viscosity will be dramatically changed. In particular, in the cooling process, the melt temperature undergoes the glass transition temperature T g . When the temperature of the material drops below T g , the material transits from a high elastic state to a viscous flow state, where its mechanical property greatly varies. Therefore, the material model for the packing stage should adapt to a wide range of temperatures.
(1) The Rheological Model of the Material. Rheological parameters of the plastics mainly refer to the relationship of melt viscosity to the temperature, pressure, and the shear rate, whose basic rheological property is characterized by the viscosity. Both the Cross-Arrhenius model and Cross-WLF models can accurately reflect the change in viscosity under pressure, whose main difference is adaptation range of the temperature [6]. Despite the Cross-Arrhenius model being able to adapt to the higher and lower shear rates, its temperature range adaption is relatively narrow. As the temperature change in packing process is large, the Cross-WLF model with a wider range of temperature adaptation is applied to calculate the melt viscosity. Consider the following:

where D1, D2, D3, A1,
(2) Model for Material State (P-V-T). As the material solidifies from a molten state to a solid state during the packing process, the P-V-T relationship should describe the volume variation of the material in both a solid state and a liquid state. The double domain Tait equations (see (2)–(7)) are applied to describe the polymer [7–13], which can describe the specific volume variation of both the solid and the liquid:


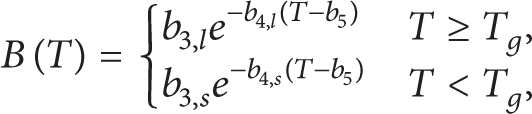

where b1,l~b9 are the material constants and T g is the glass transition temperature (noncrystalline material) or the crystallization temperature (crystalline material). The T g can be considered as a linear function of pressure as in T g (p) = b5 + b6p.
(3) Thermal Properties. The temperature in the packing stage would change drastically for both EGAIM and traditional injection molding processes. As the thermal properties of polymers are greatly influenced by temperature, the specific heat and thermal conductivity with the temperature of the molding process must be considered. For amorphous polymers, the specific heat can be expressed as

where C1, C2, C3, C4, C5 are material constants.
Thermal conductivity variation with temperature is described using the following equation:

where λ1, λ2, λ3, λ4, λ5 are material constants.
The variation of the specific heat and the thermal conductivity in regard to temperature can be solved by (10) and (11), respectively.
3.4. Boundary Conditions
(1)C p is the interface of cavity and core. At the interface of the melt contacting the cavity or the core, they meet the following nonpenetration boundary conditions [8]:

where
(2)C g is the gas interface. A certain displacement of interface between the gas and the melt occurs due to the pushing of the gas. According to the previous assumption of the gas movement, the gas pressure is simplified as uniform pressure at the interface, whose value is equal to the gas pressure at inlet and varying over time (see Figure 3)

that is, the inlet pressure variation, and whose temperature T = T m , that is, the mold temperature.

Boundary conditions.
4. The Simulation of Sink Mark
4.1. Simulation Procedure
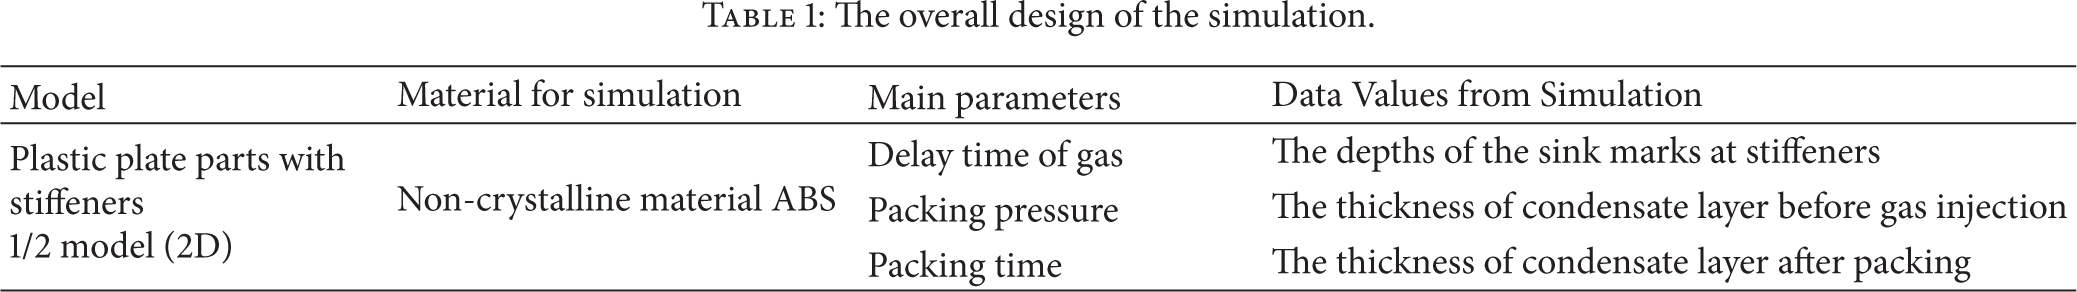
Based on the above mathematical models and boundary conditions in the molding process, the EGAIM packing process was simulated using fluid analysis software Fluent. Solidification and melting model is a model simulating the solidification of melting of the fluid in Fluent software, in which the liquid volume fraction is applied to characterize the degree of solidification. The region with the volume fraction of 0 indicates the solid area; the region with the volume fraction of 1 is of the liquid area; and the region between 0 and 1 is an incompletely solidified area or solid-liquid interface. The overall ideas of the simulation are shown in Table 1.
The overall design of the simulation.
The 3D model of the plastic state is shown in Figure 4, where the middle position symmetrical cross-section B-B is set as the analysis object.

Model of plastic parts.
Plastic material is ABS, whose properties are put into the software Fluent by programming language C. As shown in Figure 5, the symmetry plane of the model was taken as a 2D model with mesh of 0.04 mm in size, where A is the symmetric boundary and the surface of the cavity are other outer boundaries (B, C, D, E). The applied temperature is the mold temperature. The lower side of boundary B in the gas action stage is the inlet of the gas pressure, which is the packing pressure.
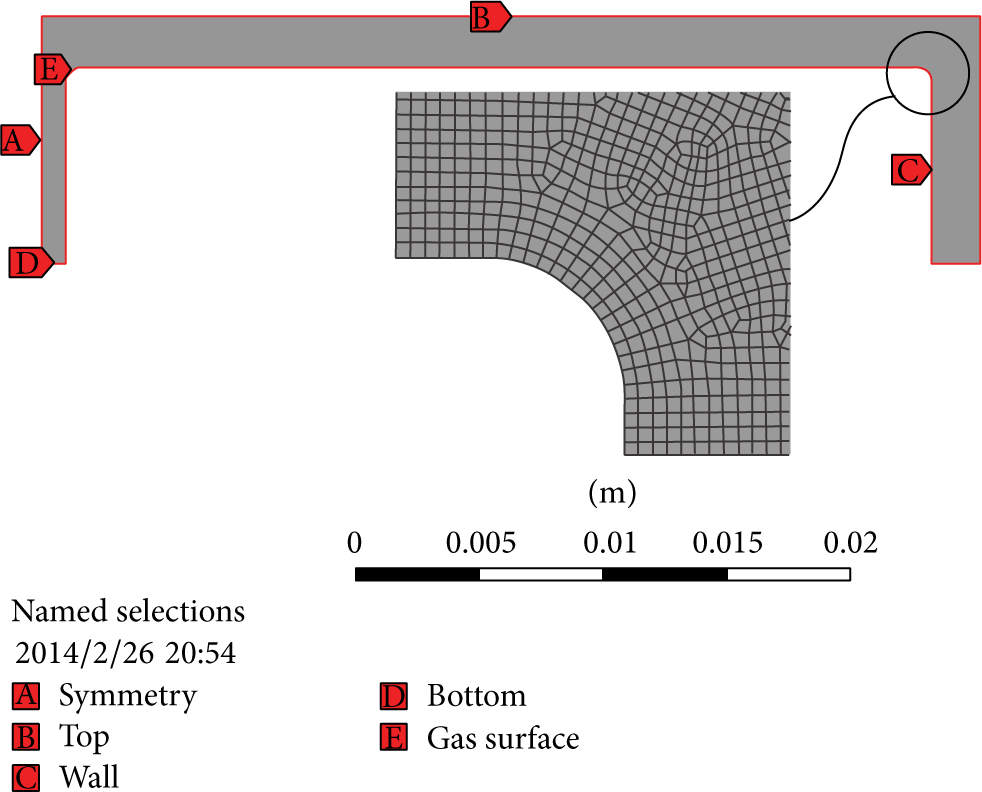
Boundaries and mesh for one section.
According to the main process parameters of EGAIM, the designed one-parameter influence experiments are shown in Table 2, exploring the influences of the delay time of gas, as well as the packing pressure and time, on the molding quality. The mold temperature is set as 50°C, and the melt temperature is set as 220°C, according to the recommendation process of the material. The delay times of the gas are set to 0.5 seconds and 1 second; the gas pressures are 2 MPa and 6 MPa; and the packing times are 5 seconds and 15 seconds, respectively. When a parameter is changed, the other parameters are set at their maximum values. A group of naturally cooling experiments without packing is set as the control group.
Simulation grouping.

4.2. Analysis of Simulation Results
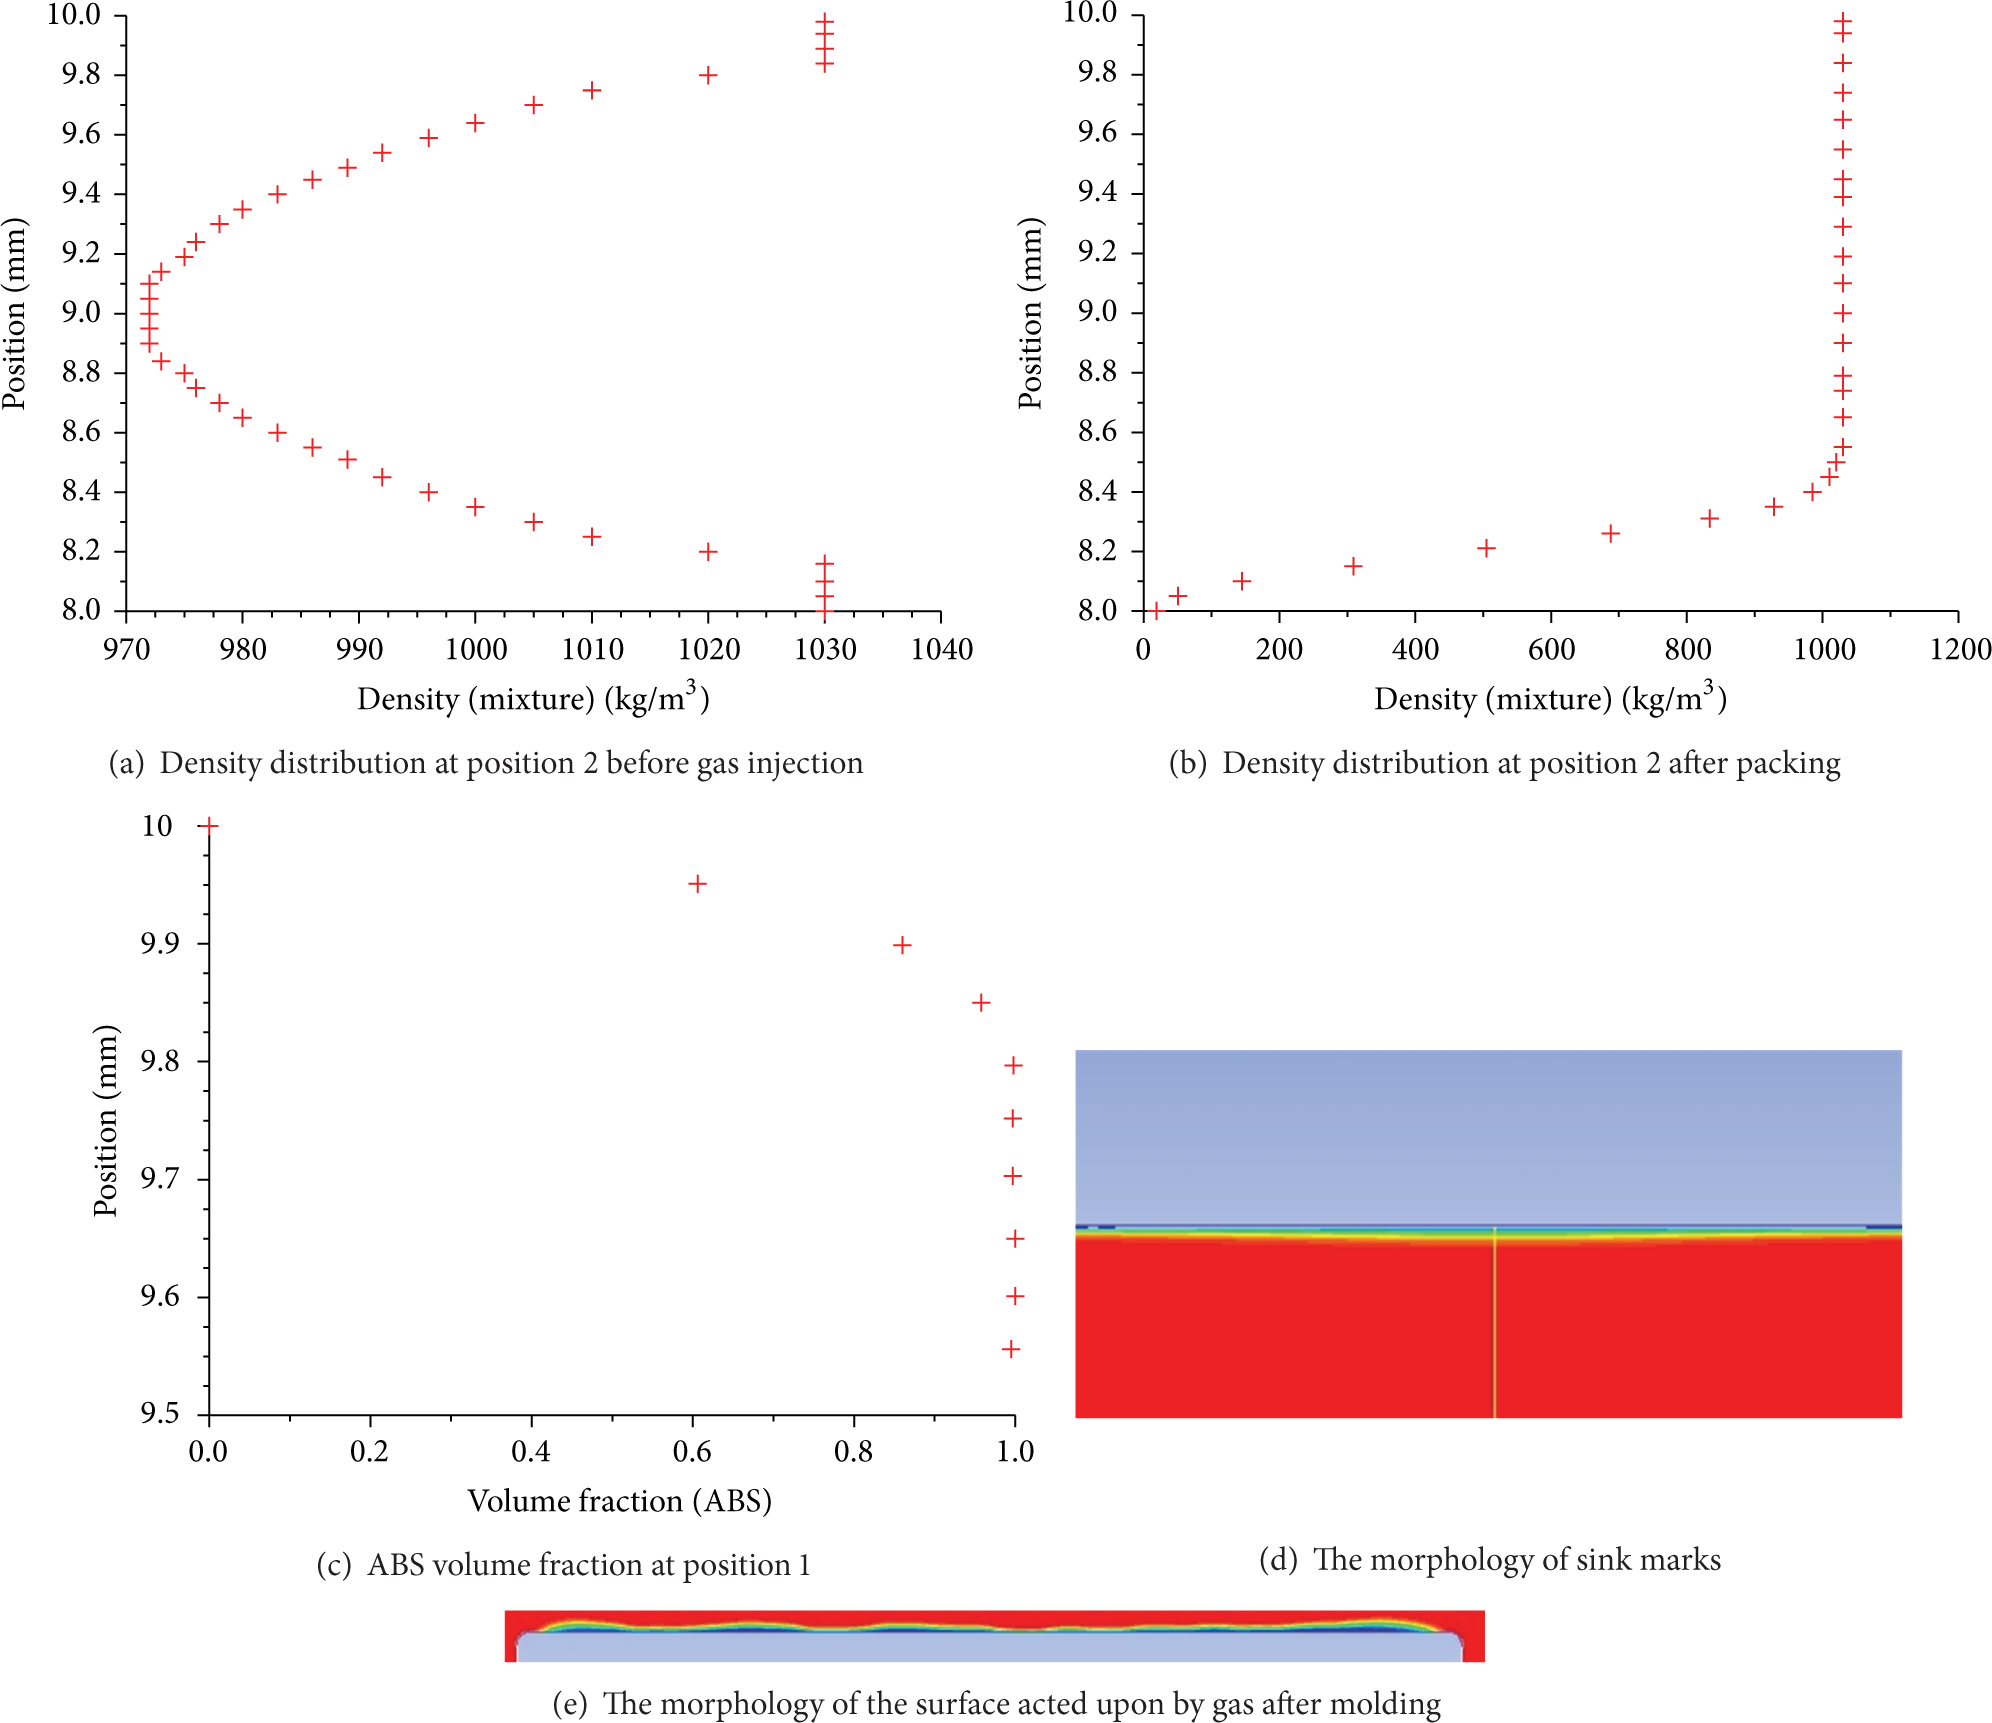
Two simulation values at three time points and two positions are selected as the result, as shown in Figure 6. The three time points are the time between delay time and the gas injection, the ending time of the packing, and the time of the melt cooling to mold temperature. The two simulation values are (1) The density distribution at Position 2 (middle position) after the delay time of gas, before the injection, and the end of the packing, which is available to obtain the thickness data of the condensate layer (By taking the density distribution, not only could the thickness of the condensate layer be obtained, but also the penetration depth of the gas could be get. Hence, the density distribution rather than the liquid volume fraction calculated by Solidification and Melting model is applied), and (2) the ABS and gas volume fraction distribution at Position 1 (axis of symmetry) during the time of demolding, which the final depth of the sink mark is available to obtain.

Value location.
The results are as follows.
In the control group (Figure 7), the depth of sink mark is 510 μm.

Sink marks of the control group.
Simulation 1. As shown in Figure 8(a), the density reaches the maximum values at the upper and lower positions of the curve, and the distance indicates the thickness of the condensate layer. Hence, the thickness of the condensate layer before the injection of the gas is 187 μm. Figure 8(b) shows that the density curve becomes vertical when the position is over 0.4 mm, indicating the complete solidification of the thin-walled parts after packing. Figures 8(c) and 8(d) indicate that the surface of the stiffener is almost flat at this time. According to the melt volume fraction distribution, the depth of the sink mark is 20 μm. Figure 8(e) shows that waviness of the surface is relatively larger after the action of the gas. At the two ends near the stiffener, the penetration depth of the gas is deeper than that at the middle position.
Simulation 1.
Compared to other groups of simulation results, Simulation 1 has the largest delay time of gas, packing pressure, and time. The morphology of the sink mark is almost flat and visually indistinguishable, partly because the gas pressure is strong enough, leading to the surface being close to the mold wall, and partly because the packing time lasts until complete solidification of the melt, resulting in the highest surface quality.
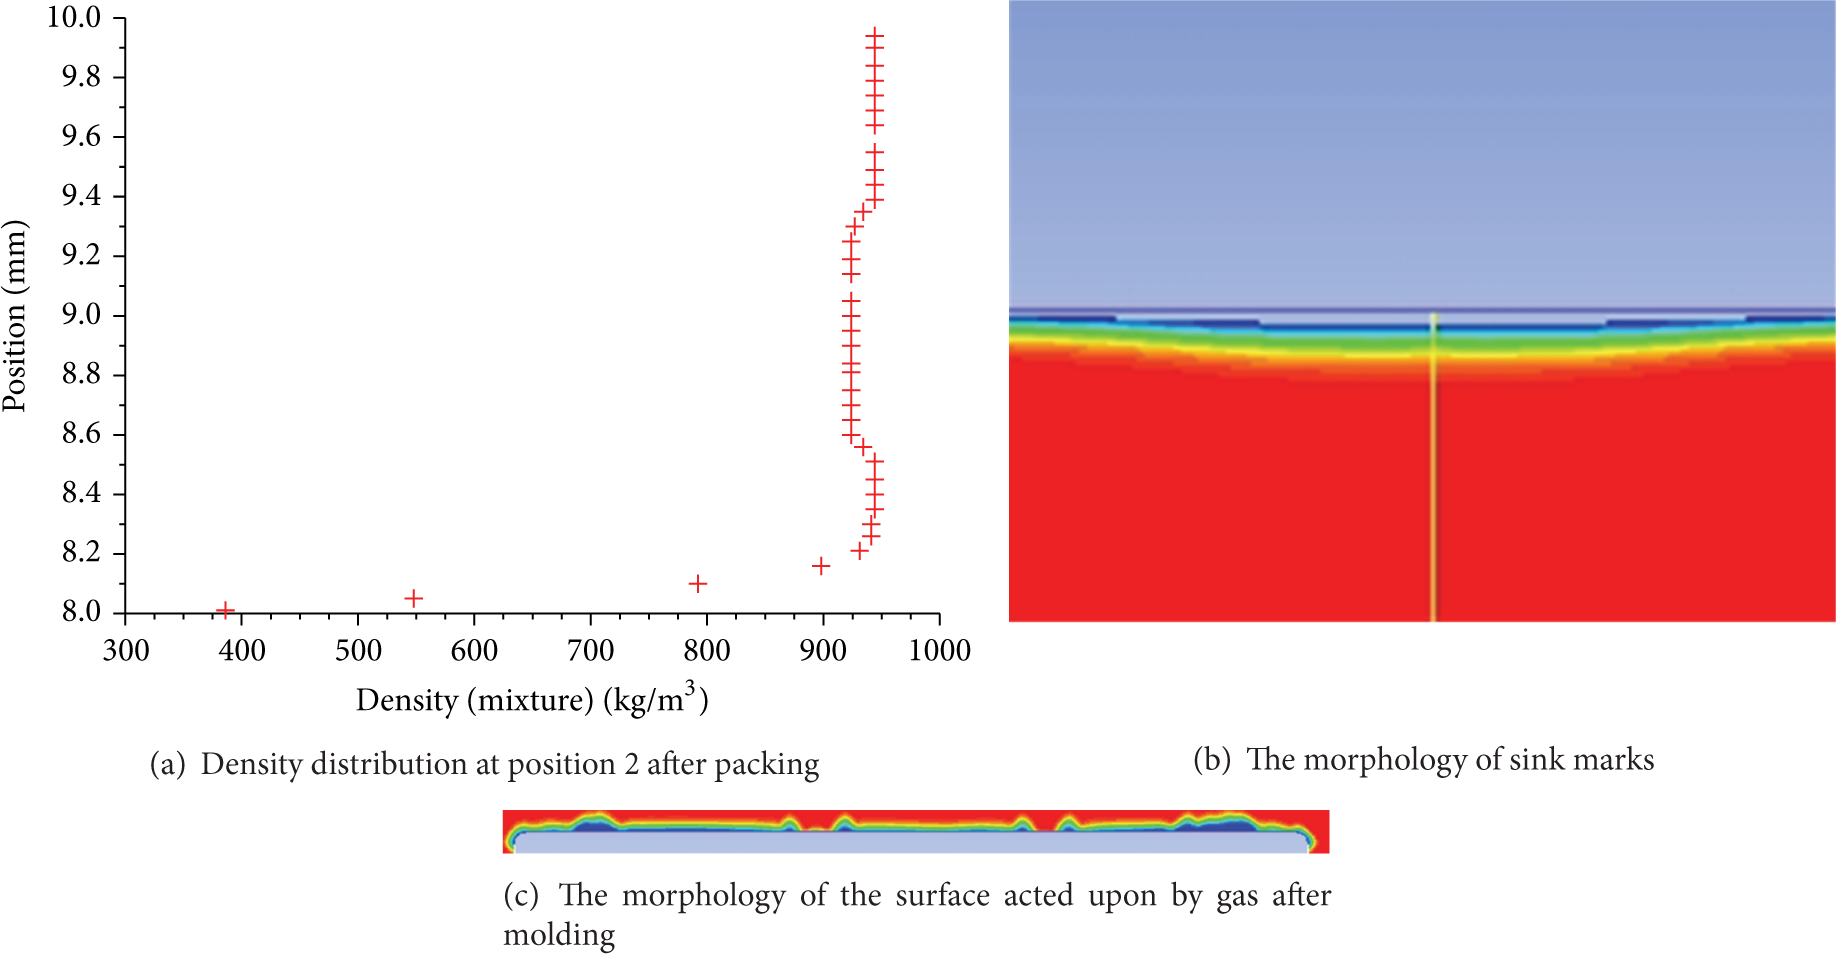
Simulation 2. The thickness of the condensate layer is 187 μm before gas injection. It can be seen in Figure 9(a) that the thickness of the condensate layer is 282 μm after 5 s packing, and the condensate layer acted upon by gas is thinner than that on the other side. The depth of the sink mark is 39 μm.
Simulation 2.
The packing time in Simulation 2 is reduced to 5 seconds, as shown in Figure 9(a). After the 5s gas packing, the thin wall is not completely solidified, and the thickness of the condensate layer acted upon by gas is only 282 μm, thinner than that on the other side. Because thermal conductivity between the melt and the gas is lower than that between the melt and the mold, it leads to the slow cooling rate on the surface acted upon by gas. As shown in Figure 9(b), the depth of the sink mark significantly enlarges due to the insufficient packing pressure. It can be seen in Figure 9(c) that the melt continues to shrink after five seconds of being under gas pressure. As there is no gas maintaining the condensate layer in the tension state, coupled with the pressure releasing of the internal melt, the stronger movement occurs inside, generating the folds on the surface acted upon by gas, as shown in Figure 9(c). This is the result of the insufficient gas action and the sudden relaxation of the condensate layer.
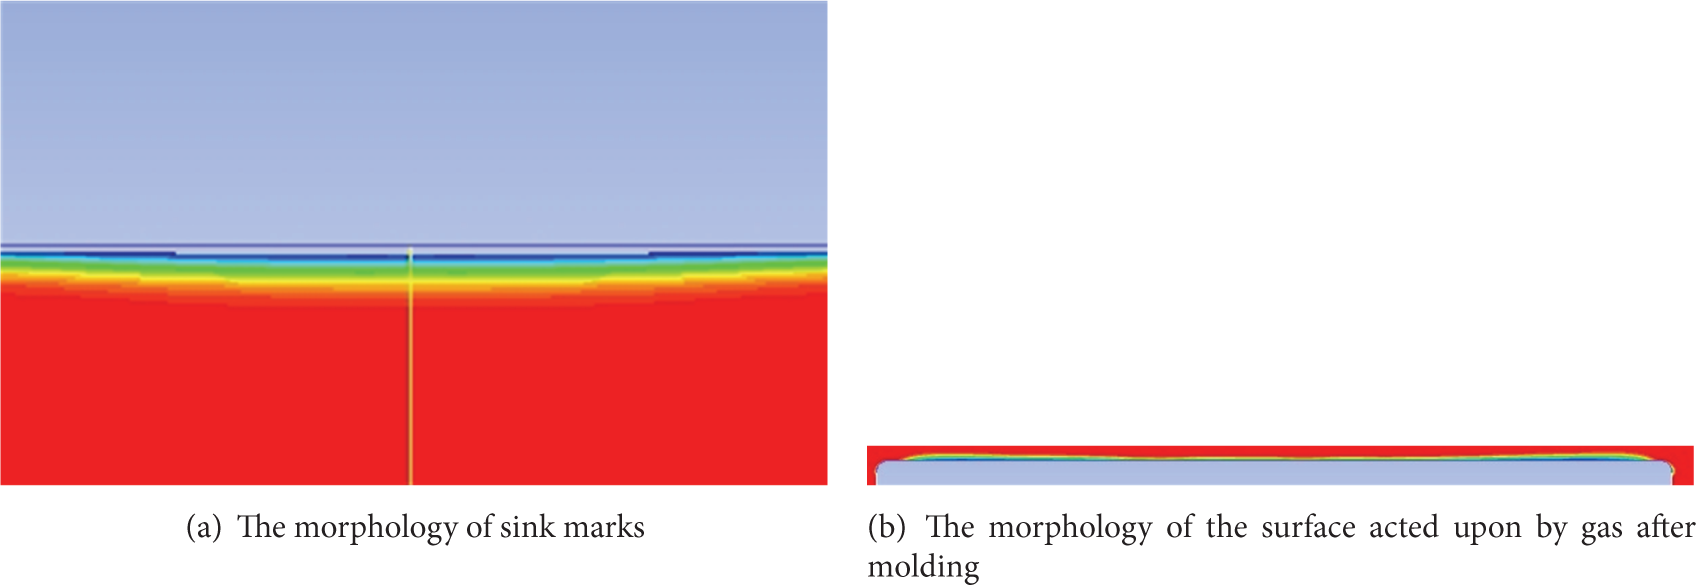
Simulation 3. The thickness of the condensate layer is 187 μm before gas injection. The thin wall completely solidified after packing. The depth of shrink mark is 42 μm.
The packing pressure in Simulation 3 is reduced to 2 MPa. Compared to the previous simulation, from the morphology of the surface acted upon by gas (Figure 10(b)), it is clear that the packing pressure is insufficient, the pushing effect of the gas is greatly reduced, and the depth of the sink mark significantly increases (Figure 10(a)).
Simulation 3.
Simulation 4. The thickness of the condensate layer is 155 μm before gas injection. The thin wall completely solidified after packing. The depth of shrink mark is 21 μm.
Comparing the previous simulations, the delay time of the gas is reduced to 0.5 seconds. The depth of the shrink mark is obviously reduced (Figure 11(a)). However, from the morphology of the surface acted upon by gas (Figure 11(b)), it can be seen that the depth of gas pushing increases. The penetration phenomenon may occur by continuing to increase the gas pressure.

Simulation 4.
Comparing the simulation results of the control group, it can be seen that the sink marks of the plastic parts produced by EGAIM are significantly improved over those without packing. In the above group of simulations, after the packing, the density distribution of position 2 has a small sloped area in the bottom, which is the pushing area of the gas below position 2, indicating the interface of melt pushed by gas, that is, the gas penetration depth. From the morphology of the surface acted upon by gas, it can be seen that the position of maximum gas penetration is the position near the stiffener, rather than the middle of the thin wall, because shrinkage of the melt at the stiffener position is relatively larger than that at middle position of the thin wall and near the sink marks generating position, promoting the feeding of the melt. According to the basic theory of fluid mechanics, gas moves along the direction of minimum pressure, leading to the large gas penetration depth on the two sides.
5. Experiments
As the experimental data are mainly used to verify the above mechanism from simulation, five groups of data were selected in accordance with the situation of the simulated data. In this work, the experiments were performed on a BT200V-1 injection molding machine from Guangzhou Bochuang Machinery Co. The fixed nitrogen generating device, gas compressor, and gas control equipment used in the experiments are shown in Figure 12. The mold is shown in Figure 13. Experimental measuring instrument is shown in Figure 14.

The gas generation and control equipment.

Mold for experiments.
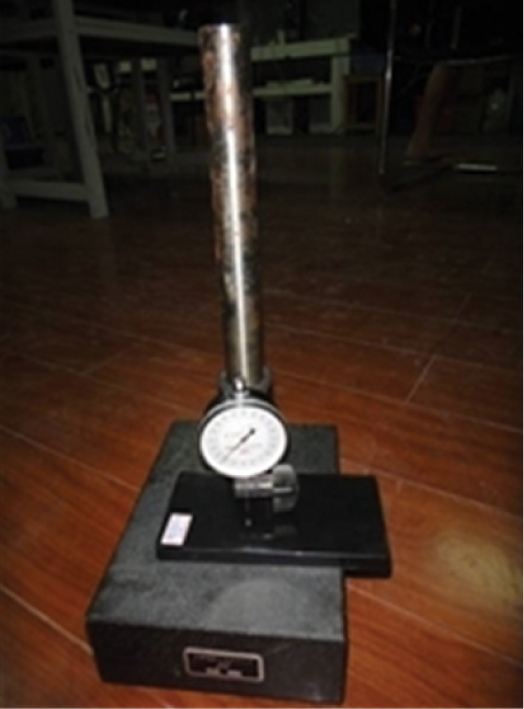
Mechanical dial gauge.
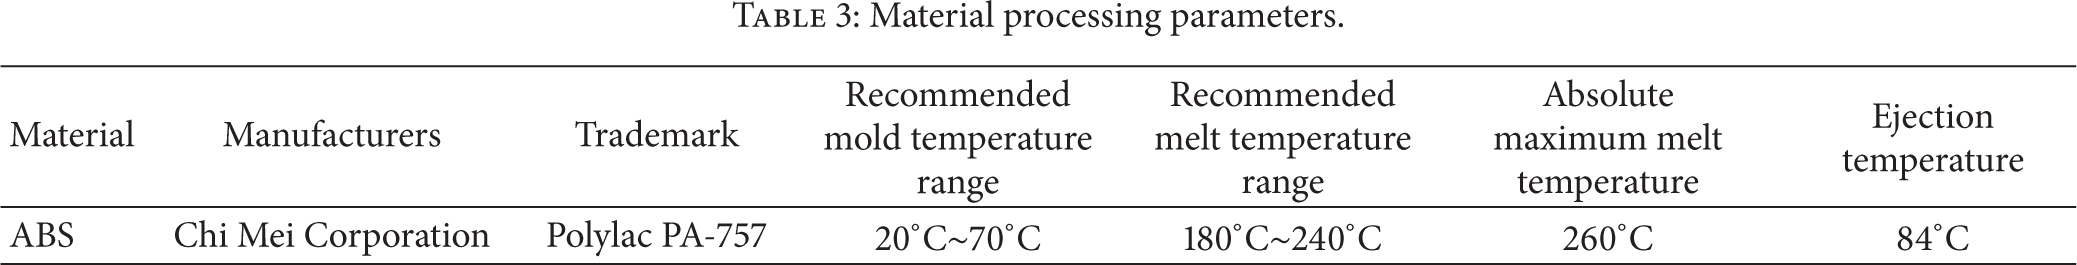
As the main purpose of this experiment is to verify the aforementioned model of the mechanism and to study the impact of EGAIM on the sink marks, the ABS plastic was selected as experimental material, which was also applied in the simulation, whose parameters are shown in Table 3.
Material processing parameters.
The seven groups of experimentally measured depth of sink marks on the surfaces are shown in Figure 15 and Table 4.
The depths of sink marks from one-parameter experiment.


Experimental sink marks.
Comparing the earlier simulation results, it can be seen that the measured sink marks in the experiment were generally about 10 μm larger than those of the simulation results. However, the simulation results agree with the experimental results in the changing trend to a certain extent. The main reason for the data difference is that the numerical simulation ignored the crystallization and orientation of the polymer during the solidification procedure. Hence, the crystallization and molecular orientation of the material may lead to the shrinkage of plastic parts in the injection molding process and after demolding, resulting in the larger experimental value than that from simulation.
6. Conclusions
The EGAIM process was discussed. The interaction between the gas and the melt was analyzed on the view of polymer mechanical properties, mainly focusing on the impact of gas on the sink marks. A mathematical model for the packing stage of EGAIM was established.
Taking plastic plate parts with stiffeners, for example, the EGAIM process was one-parameter simulated using Fluent software. The simulation model was simplified and verified, getting a result directly reflecting the EGAIM effect. The thickness of the condensate layer, the depth of sink marks, and the morphology of the surface acted upon by gas under different gas delay times, packing pressures, and packing times were obtained.
The actual products were produced using EGAIM. The trend of results for actual measured depth of sink marks is consistent with that from simulation, confirming the effectiveness of the mathematical model for the packing stage.
Conflict of Interests
The authors declare that there is no conflict of interests regarding the publication of this paper.
Footnotes
Acknowledgment
The research work was supported by the National Natural Science Foundation of China (51375451, 51005211).