
Abstract
A new design of thermal management system for lithium ion battery pack using thermoelectric coolers (TECs) is proposed. Firstly, the 3D thermal model of a high power lithium ion battery and the TEC is elaborated. Then the model is calibrated with experiment results. Finally, the calibrated model is applied to investigate the performance of a thermal management system for a lithium ion battery pack. The results show that battery thermal management system (BTMS) with TEC can cool the battery in very high ambient temperature. It can also keep a more uniform temperature distribution in the battery pack than common BTMS, which will extend the life of the battery pack and may save the expensive battery equalization system.
1. Introduction
Vehicle electrification has been considered as a promising solution to the upcoming energy and environmental issues. However, the success of electric vehicles depends on the development of the battery. Among all types of batteries, lithium ion batteries are nowadays widely used for automotive applications due to their advantages in energy/power density and charge efficiency among others [1]. However, its narrow desirable operating temperature range imposes a significant challenge on the thermal management of lithium ion batteries.
It has been shown that temperature affects the longevity, efficiency, and safety of the battery. Thermal runaway, electrolyte fire, and in certain cases explosions can occur when the temperature in the battery is too high. Therefore, an efficient BTMS is required in order to maintain the battery temperature between 20°C and 40°C. Moreover, to let the battery work in a similar circumstance, an even temperature distribution must be achieved in the battery pack. For achieving a uniform temperature distribution, the temperature difference from cell to cell and module to module should be normally within 5°C [2].
Various techniques have been proposed to manage the battery pack within the safety temperature range. In general, these thermal management techniques can be categorized into two groups, namely, active cooling method by means of forced air convection or liquid cooling and passive cooling method by using phase change materials (PCM) [3]. Xu and He [4] design a double “U” type duct in a forced air cooling pack. Under 1C discharge, the maximum temperature difference is 3.29°C. Park and Jung [5] compare the air and liquid type BTMS on the power consumption. The air type BTMS consumes much more power compared with the liquid type BTMS under high load. Many researchers focus on PCM cooling, because it is easy to use and energy saving. Sabbah et al. [6] compare PCM cooling with forced air cooling of a large Li-ion battery pack. They find that even under extreme circumstance, the temperature difference in the pack is less than 0.1°C. Qu et al. [3] find that even under 3C discharge, the PCM can successfully keep the battery temperature below 55°C. Mills et al. [7] use a graphite matrix to enhance the conductivity of the PCM. Generally speaking, the traditional active cooling is unable to keep the temperature difference in a pack very small, and it is even more difficult to control the battery pack temperature in the optimum range (20~40°C) under high ambient temperature. As to PCM cooling, although it effectively minimizes the thermal gradient inside the battery pack, the concept has some disadvantages. For example, the PCM increases the volume and weight of the overall battery pack. Furthermore, complete melting of the PCM matrix is possible during multiple charge/discharge cycles. If the PCM completely melts, the low thermal conductivity of PCM matrix creates an additional large thermal resistance between the cooling fluid and the batteries [8].
In view of the disadvantages of the present BTMS, a new BTMS using TECs combined with liquid cooling is proposed. A TEC is a device in which an electric current is applied to semiconductor devices to produce an appreciable temperature difference at the two ends of the semiconductor. The cold end may then be utilized for cooling purposes [9]. In the BTMS, the cold end of the TEC is adhered to the battery and the hot end is cooled by water. Thus the TEC serves as a heat pump between the battery and the cooling fluid, so the heat can be controlled precisely. Therefore, the new BTMS can control the battery temperature in the optimum temperature range and keep a more uniform temperature distribution in a battery pack than the present BTMS. It is helpful to extend the life of a battery pack.
The paper presents the cooling system firstly, followed by descriptions of the model development including the battery and thermoelectric cooler models and descriptions of the experiments. Results and discussions are then presented. Finally, some conclusions are drawn.
2. Model Development
2.1. Thermal Model of the Battery
There are a lot of battery thermal models. Many researchers [1, 10] use lumped model in which the temperature in a battery is identical to study the battery thermal behavior. Normally when the battery is small and heat exchange is not excessive, it does not cause large errors. However, the battery used here is a big one and by experiment we have found that under 1C discharge, natural convection, the temperature difference within a battery can reach 5°C. Under forced convection, the temperature difference will go higher. Moreover, the TEC on the battery surface causes a high temperature difference, so only 3D model could catch the phenomenon. The thermal model of the battery is
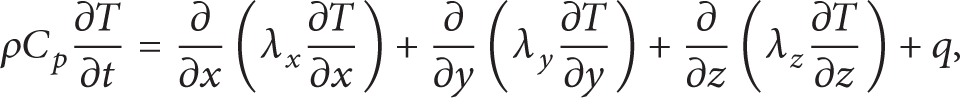
where ρ is the density, C p is the specific heat, λ x ,λ y ,λ z is the heat conductivity in the x,y,z direction, and q is the volume heat generation rate.
To simplify the solution, the following assumptions are made. (1) Despite the complicated components of the battery, the material property in any part of the battery is identical. (2) The heat conductivity and specific heat would not change with the temperature and SOC. (3) The volume heat generation in the battery is uniformly distributed.
The product value of density, heat capacity, and the thermal conductivities for the cell domain are calculated through [11]

where V i , L i , and A i are the volume, thickness, and transverse area of each material i, respectively. The dimension and thermal and physical properties of each material are listed in Table 1.
Material parameters of the battery cell.
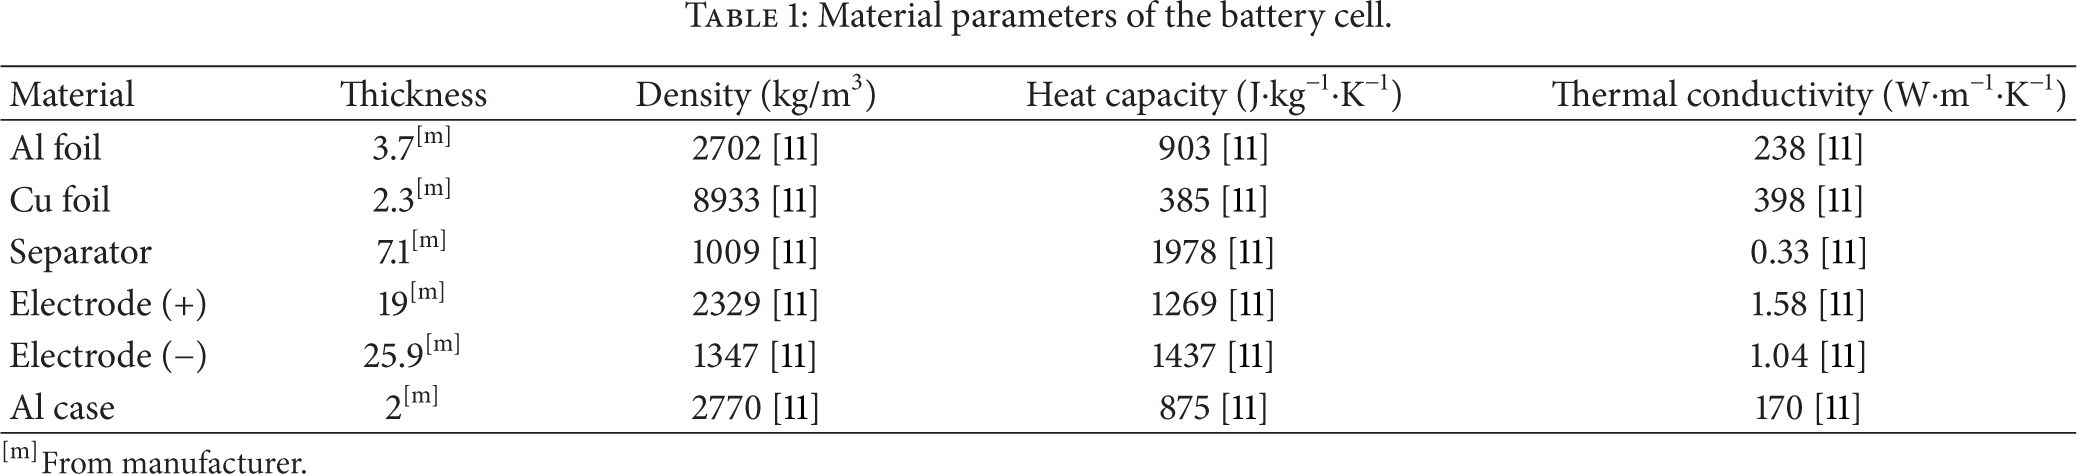
[m]From manufacturer.
The volume heat production rate q is determined from the total heat generation of the battery Qgen divided by the battery volume V, shown as

The heat generation in the Li-ion battery constitutes ohmic heat, irreversible heat, and reversible heat [12]. Reaction heat or irreversible heat generation is due to the transfer of electrons to or from the electrode during the electrochemical reaction, reversible heat generation is because of the entropy changes of cathode and anode, and ohmic heat generation is due to the ohmic resistance of the solid active materials and electrolyte [12]. The entropy change in the electrodes is related to the change of their equilibrium potential with temperature and this varies with SOC. The equation proposed by Bandhauer et al. is cited frequently in the literature in its simplified form [8]

where I is the current, Eoc is the open circuit potential, and U is the cell potential.
Even though the model works well by some authors [12, 13], accurately testing the U and dEoc/dT as a function of temperature and SOC is time consuming. For a BTMS design, knowing the maximum heat generation under common circumstance is enough, so this model is discarded. Instead, the heat generation is found by experiment.
2.2. Boundary Condition and Initial Condition
Radiation will be significant for most systems cooled by natural convection [14]. Therefore, a radiation analysis should normally accompany a natural convection analysis unless the emissivity of the surface is low. The heat that dissipates into the ambient is calculated by

where h denotes the convection heat-transfer coefficient at the battery surface, T0 is the ambient temperature, T w is the battery surface temperature, q b is the heat flux, ε and σ are the battery surface emissivity and the Stefan-Boltzmann constant, respectively.
To determine h on all battery faces, the h on the faces around the battery is the same. The h on the top face and on the bottom of the battery is different. Here, using empirical correlation to determine h,

where L c is the characteristic length, Δt is the temperature difference between the hot wall and the ambient air, g is the gravitational acceleration, and α, ν, and P r are air's coefficient of volume expansion, kinematic viscosity, and Prandtl number, respectively. C and n are constant, referring to [14].
For the surface emissivity ε, referring to [14], the emissivity of the alumina is between 0.2 and 0.3. Here, ε is set to 0.2.
In this study, the battery is kept at ambient temperature prior to discharging. Therefore, the initial condition can be written as

2.3. Thermal Model of the TEC
The schematic diagram of the TEC is shown in Figure 1. It is unnecessary to model every PN pair, so all the PN pairs are treated as a bulk. Similar to [9], the TEC is modeled by three parts: cold end, hot end, and PN bulk (see Figure 2).
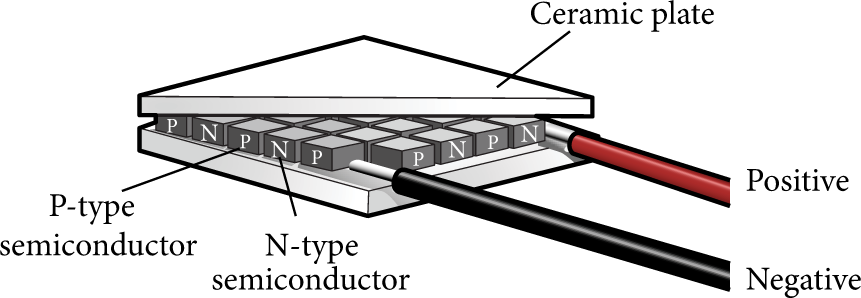
Schematic diagram of the TEC.

The simulation model of the TEC.
The cold end that included a ceramic plate is adhered to the battery surface. The hot end that included a ceramic plate is cooled by water to keep a stable temperature. The PN bulk has the same area as the ceramic plate, so the thermal parameters would change accordingly.
The general equations of the thermal models of the three parts are the same as the battery. Only the heat generation term q in (1) is treated differently, shown as follows.
For cold end,

for PN bulk,

for hot end,

where I is the current supplied to the TEC, R is the resistance of the TEC, α p and α n are the Seebeck coefficients of the P-type and N-type elements, T c and T h are the cold end and hot end temperature, respectively, and V c , V b , and V h are the volume of the three parts.
The three parts are assumed to be thermal isotropy. All the simulation parameters of the TEC model are shown in Table 2.
Simulation parameters of the TEC model.

[M]From manufacturer.
3. Experiment
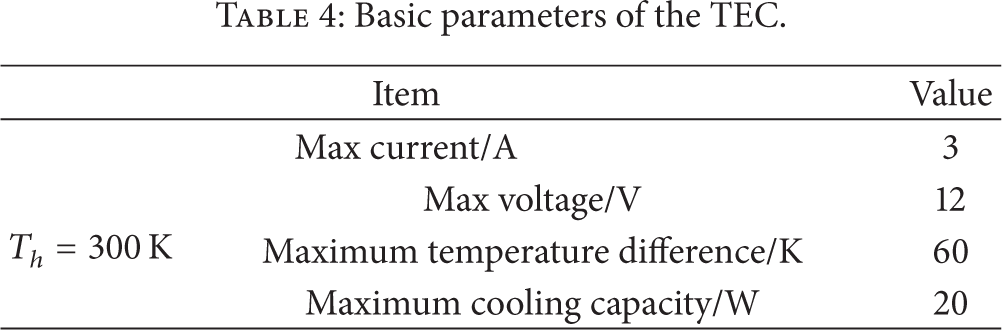
The battery cell in this study is prismatic with a big capacity often used in electric buses. It is fabricated by Zhicheng Champion Corporation, China. Figure 3(a) shows its appearance. The basic parameters of the battery are shown in Table 3. The thermoelectric cooler used in this paper is TEC1-12703. Its appearance is shown in Figure 3(b). Its basic parameters are shown in Table 4.
Basic parameters of the battery cell.

Basic parameters of the TEC.

Product appearance.
The battery is put into a room where the temperature is kept at 20°C, under natural convection circumstance. In order to measure the temperature and show the temperature difference within a battery, 18 thermal couples are placed on the battery surface, 9 in one face and 9 in the opposite face, shown in Figure 4. All the signals of the 18 thermal couples are processed by an acquisition card and are sent to a computer and recorded in a 10 s interval.

Measuring position of the 18 thermal couples.
The battery is discharged with a current of 1C and 1/2C to find the thermal behavior of the battery under constant discharge rate. The maximum discharge current of the battery is 200 A. The thermal behavior at the maximum discharge current will not be studied, partly because one electric vehicle will not need such high current in a long period and partly because of the limitation of the self-developed discharge device. The battery is discharged from 3.6 V to 2.5 V. Then, through the test results, the heat generation of the battery in the simulation is calibrated. Then two TECs are placed on the battery surface, one on the center of one surface and the other at the opposite position. Since the battery under 1C discharge generates much more heat, the study focuses on this condition. The battery is discharged in 1C, while the TECs are supplied by a DC current which can be controlled. The temperatures of the cold end and the hot end of the TECs are measured. In order to cool the hot end of the tablet, a water cooling device is adhered to the hot end of the tablet. The cooling device is manually controlled to keep the desired temperature of the hot end. To reduce the thermal resistance between the cold end and battery, a liquid metal sheet is placed between them.
4. Results and Discussions
4.1. Thermal Behaviors under 1C and 1/2C Discharge
Under both 1C and 1/2C discharge, the highest temperature lies in the center of the battery surface. The temperature in the lower side of the battery is a little higher than the upper side of the battery, because the board below the battery is a poor heat conductivity of material and stops the heat from dissipating. At the end of the discharge, the max temperature difference when under 1C charge is about 5°C (see Figure 5); it is really large compared to the control object in a battery pack that the temperature difference is within 5°C. When under 1/2C charge, the temperature difference is 3.8°C (see Figure 6) and the highest temperature is lower by about 4°C compared with the 1C discharge. In the last stage of the discharge, the heat generation rate goes a little higher, probably due to the polarization effect of the battery [12]. However, the heat generation does not vary much in general, so in the simulation the heat generation in the battery is treated as constant.

Temperature variation of different points at 1C discharge.
Temperature variation of different points at 1/2C discharge.
4.2. Model Validation
Focusing on the 1C discharge, we will use the average dT/dt and the average surface temperature at the end of the discharge to calculate the heat generation rate Qgen, and then Qgen = 19.4 W. It is noted that more than 96% heat generation is stored in the battery as the internal energy. Setting Qgen = 19.4 W in the simulation, the battery surface average temperature compared to experiment result is shown in Figure 7. They are well matched. The maximum temperature deviation is about 2°C. However, the surface temperature difference within a cell is 1.3°C, much smaller than the experiment result, mainly due to the untested thermal conductivity and uniform heat generation.

Battery surface average temperature under 1C discharge.
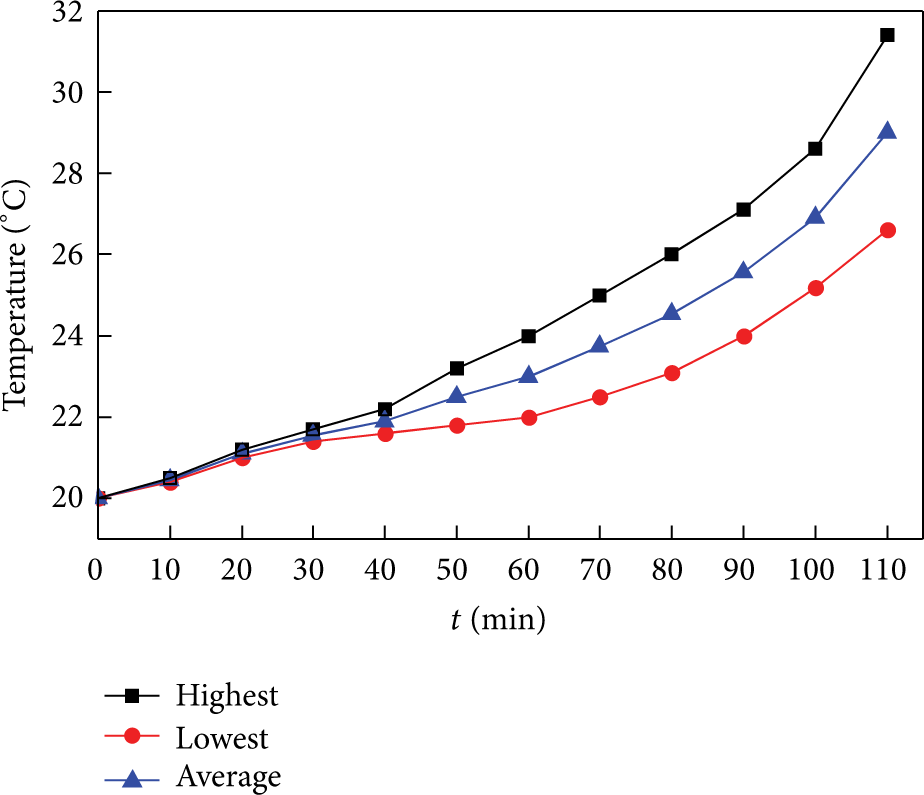
Then the calibrated model is used to investigate the cool effects of the TEC. The TEC is supplied with a current of 1 A and the temperature of the hot end of the TEC is kept at 40°C. Figure 8 shows the average temperature of the battery surface. At first, the simulated temperature is a little higher than the experiment results, but the temperature in the experiment goes much higher than simulation after 10 minutes. At the end of the discharge, a maximum temperature difference of 2.6°C is reached. This is partly because of the error of the battery model, partly because the performance of the TEC is a little overestimated. Nevertheless, the model has an acceptable accuracy and is appropriate to study the battery thermal behavior in a battery pack.

Battery surface average temperature under 1C discharge with TEC cooling.
4.3. Temperature Distribution in a Cell
Figure 9 shows the temperature distribution at the end of the discharge with and without the TEC cooling. The maximum temperature on the battery surface is 26.1°C, while the minimum temperature on the battery surface is 18.1°C. Without TEC cooling, the maximum temperature is 31.7°C, while the minimum temperature is 30.4°C. It is found that the TEC will increase the temperature difference in a battery, because the contact area of the TEC is small compared to the battery surface. Thus too much heat is dissipated from a small region, which causes the temperature in a battery to be a large nonuniform temperature. This can be alleviated by inserting a high conductivity material between the battery and TEC.
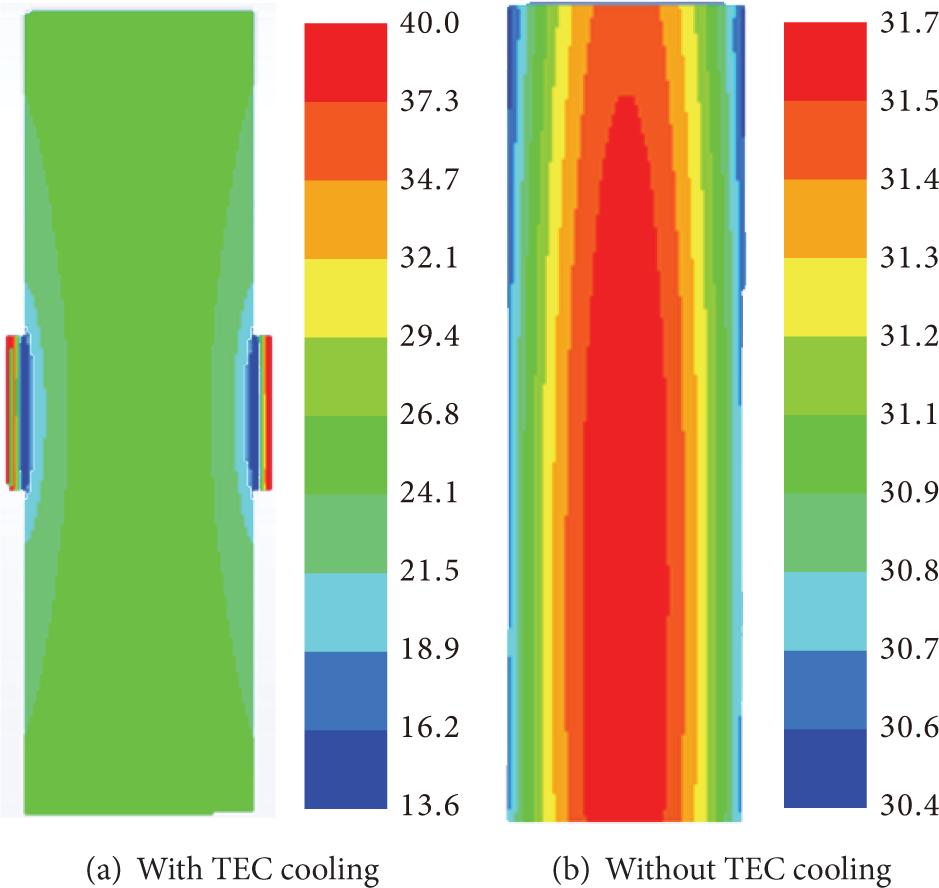
Temperature distribution at the end of discharge.
4.4. Cooling a Battery Pack
The most attractive functions of the TEC cooling are that it can cool the battery in high ambient temperature circumstance and provide the required cooling power. Sometimes the ambient temperature can reach 40°C; normal cooling including air or liquid cooling would not keep the battery in the optimum temperature range. Here how TEC can cool a battery pack under high temperature circumstance is studied. The battery pack consists of 8 battery cells, shown in Figure 10. The original cooling of the pack is through water cooling. The battery is installed on a water jacket which transfers the heat of the battery to the water. The TEC is installed on the bottom of the battery. Suppose that the ambient temperature is 40°C and the temperature of the water inlet is also 40°C. The battery is discharged in 1C rate and the heat generation is the same as that in Section 4.2. To show how the TEC can keep a more uniform temperature in the battery pack, the heat generation of the first cell and the last cell is set different from the other cells. The heat generation rate of the first cell is 0.8 of the common cells, while that of the last cell is 1.2.
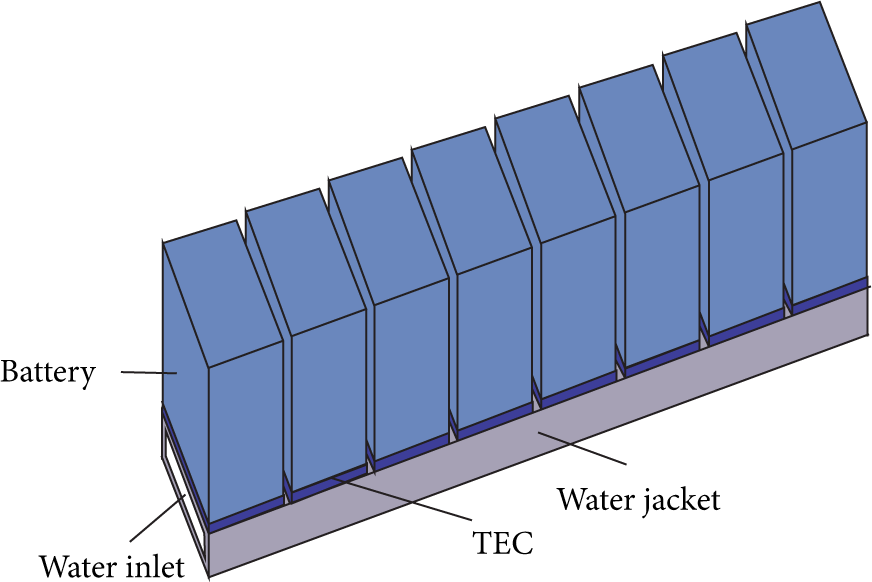
3D model of the pack.
First, the case without TEC cooling is studied. Figure 11 shows the temperature distribution of the pack. The temperature of the last cell is the highest and the temperature of the first cell is the lowest. The water jacket remains at nearly a uniform temperature, so the heat dissipation conditions of the 8 cells are the same. Therefore, the nonuniform temperature distribution is due to the different heat generation rate. The surface average temperatures of the first cell, the last cell, and the others are 42.7°C, 45.9°C, and 45.3°C, respectively. Then the pack is cooled with TEC, and the cooling power is regulated to give the required cooling. Figure 12 shows the temperature distribution. The surface average temperatures of the first cell, the last cell, and the others are 39.2°C, 38.4°C, and 38.5°C, respectively. It can be concluded that, with TEC cooling, the battery temperature can successfully decline below 40°C. The average temperature difference is less than 1°C, much smaller than the cooling without TEC. However, the TEC enlarges the battery nonuniform temperature. This can be overcome through increasing the contact area between the cooling device and the battery to avoid excessive cooling in a small part of the battery.

Temperature distribution with water cooling.

Temperature distribution with TEC and water cooling.
5. Conclusions
A new design of thermal management system for Li-ion battery pack using thermoelectric coolers (TEC) is proposed. Then, by simulation and experiment, it is proved that the design is feasible. The new BTMS can keep a more uniform temperature distribution in the battery pack than common BTMS, which may save the expensive battery equalization system. It can also keep the battery temperature in the optimum temperature range even under high ambient temperature, thus extending the life of the battery pack.
A 3D thermal model containing the battery and the TEC thermal model is proposed, and the model can be used to study the battery thermal behavior under TEC cooling with acceptable accuracy. It is helpful to design and optimize the proposed BTMS.
The disadvantage of TEC cooling is that it causes the temperature difference within a battery to go higher. This can be overcome through increasing the contact area between the TEC and the battery or inserting a high conductivity material between the battery and the TEC.
The TEC can be used not only to cool, but also to heat the battery when the ambient temperature is too low. It is good for electric vehicles to quickly warm up in winter.
Conflict of Interests
The authors declare that there is no conflict of interests regarding the publication of this paper.