
Abstract
A wireless sensor network-based distributed measurement system is designed for collecting and monitoring the electric field under the high voltage direct current (HVDC) transmission lines. The proposed system architecture is composed of a group of wireless nodes connected with electric field sensors and a base station. The electric field sensor based on Gauss's law is elaborated and developed. For the design of wireless node, the ARM microprocessor and Zigbee radio frequency module are employed. The proposed system has been used in China's state grid HVDC test base and the in situ power transmission projects. Based on the experimental results, the proposed measurement system demonstrates that it can adapt to the complex electromagnetic environment under the transmission lines and can accomplish the accurate, flexible, and stable demands of the electric field measurement.
1. Introduction
High voltage direct current (HVDC) transmission system is more favorable than the conventional high voltage alternating current (HVAC) system because of its economical, technical, and environmental advantages for long distance and bulk power transmission. To date,
Sensor is a key part of the electric field measurement system. Now, electric field sensors have been built that permit the electric field to be measured, but most of these are built for atmospheric investigations, voltage meter, and lighting alarm [4–7]. Only few sensors have been used to measure the electric field under HVDC transmission lines. Most of them are vibrating electrodes field meter and field mill. The field mill has been used extensively at IREQ and JPL, while the vibrating electrodes field meter has been successfully used at BPA and HVTRC [8–10]. Compared with the vibrating type, the field mill would be less affected by foul weather situation. There are few commercial and laboratory sensors to measure the total electric field under HVDC lines. However, if we want to use them in extended and thorough observations of the distribution of the electric field, these sensors need to be suitable for a sensor network and not only for laboratory experiments. Therefore, sensors are needed with dedicated electronic interfaces, in order to adapt to severe condition, consume low power, and be part of a sensor network.
Sensor network is part and base of the ubiquitous sensor network (USN) with the ability to sense physical or environmental conditions and transmit the sensed information. Due to the emergence of the USN, it is more convenient to interact with the real physical world for people. One of the most promising techniques for collecting the electric field data is to deploy wireless sensor networks (WSN), in which every node of the network is capable of locally collecting data by means of its own sensor. Data is then exchanged and transmitted over the network to remote users. In contrast to wired sensors, the wireless sensors enable monitoring of processes noninvasively and where wired sensor is not possible [11–15].
The main goal of this study is to develop a wireless sensor network aiming for the reliable and flexible measurement of the total electric field under transmission lines. This paper is organized as follows. In Section 2, the measurement principle of the total electric field sensor is described. In Section 3, the wireless node connected with the sensor is proposed. In Section 4, based on the design of the sensor and wireless node, the design of wireless measurement system is elaborated. Finally, some test data obtained from in situ electric field measurements are analyzed. A conclusion section ends this paper.
2. Total Electric Field Measurement System Framework
With the increase in the voltage level of transmission lines, electric-field strength on the surface of transmission lines will increase accordingly. When the transmission line surface electric-field strength exceeds a certain critical value, the air near the surface of the wire is ionized and the ions are formed. The ions move along with the electric-field lines to the opposite conductor. For the HVAC, the AC field reverses direction every half a cycle, and ions of a given polarity do not have enough time to travel more than a few centimeters from the transmission lines. On the other hand, the electric field near HVDC transmission lines does not change direction. As a result, with the absence of wind, the ions near the HVDC transmission lines travel along electric-field lines or to the ground plane. The ground level electric field under the HVDC transmission lines is perpendicular to the ground and is composed of two components. One is the nominal electric field which is the electric field due to the energized transmission lines. The nominal electric field rests with the transmission lines geometry, voltage level, and height from the ground. When these parameters are constant, the nominal electric field is time-invariant. Another one is the ion flow field due to the charged air ions produced by corona. The ion flow field superposes on the nominal electric field generated by charges of the line and enhances the electric field strength measured at ground level. The composition of the total electric field is shown in Figure 1.

Composition of total electric field.
The total electric field under HVDC transmission lines is measured at different position through a number of electric field sensors. The result comes from multiple sensors which can imply the distribution of the electric field. The framework of the electric field measurement is shown in Figure 2. The electric field sensor is used to measure the total electric field. The wireless node acquires the analog signal from the electric field sensor and then transmits it to the remote node connected with the computer. The value of the electric field is displayed on the screen and stored in the database. As a result, the distribution of the electric field under the transmission lines can be achieved through the usage of multiple sensors system.
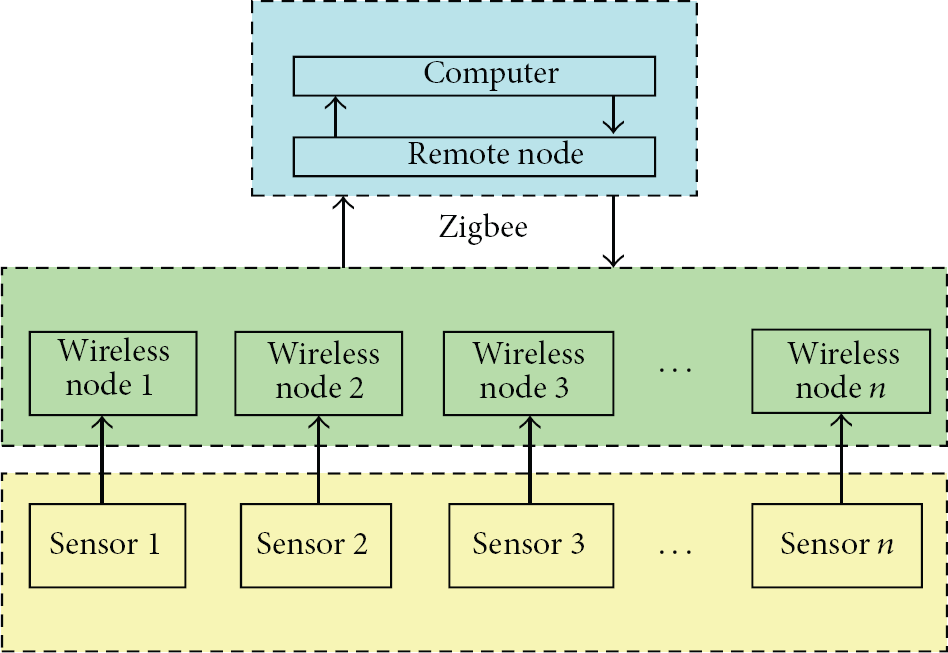
Structure of the distributed measurement system.
3. Design of the Total Electric Field Sensor and Wireless Node
3.1. Electric Field Sensor Operation Principal
The shutter type and cylindrical type field mill are two kinds of sensors used to measure the total electric field under HVDC transmission lines. The shutter type field mill is more common and is normally operated in the ground plane to measure the total electric field at ground level. A simplified arrangement of the shutter type field mill is shown in Figure 3.

Electric field sensor operation principle.
The electric field sensor as shown in Figure 3 consists of a rotor (grounded electrode), a stator (sensing electrode), an optodetector (angular position sensor), a chopper, and a motor with a constant speed. The rotor and the angular position sensor coaxially rotate with the motor. Moreover, the stator is fixed. The motor-drive rotor periodically switches on and shields the electric field. When the sensing electrode is exposed to the incident electric field, inductive charges appear on the sensing electrode with the action of the total electric field and ion flow. However, electric charges on the sensing electrode will be dispersed to the ground when the sensing electrode is shielded by the grounded rotor. Therefore, with the periodic rotation of the rotor, charges generated on the sensing electrode realize the periodic variation which additionally generates current. The proper signal processing circuit might be designed to measure the magnitude and direction of this current so as to measure the magnitude and direction of the total electric field.
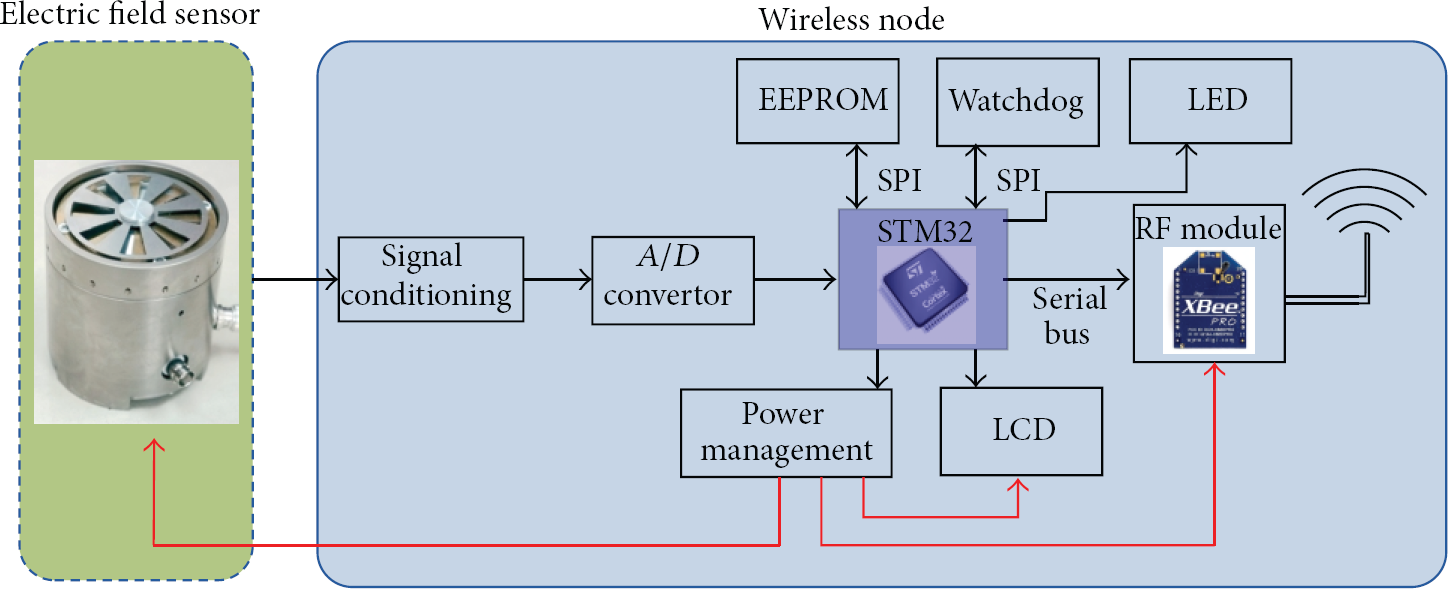
Based on Gauss's law, the electric field flux Φ passing any closed surfaces S is equal to the quantity of electric charges

When the rotor rotates with the motor at angular frequency ω, the sensor sheet is periodically exposed to the incident electric field. The area

The induced current

3.2. Design of the Sensor
The sensor utilizes the sensing electrode to cognize the electric field and then uses the special circuit for signal conditioning in order to achieve the conversion of current to voltage and discrimination of electric field polarity. The architecture of the sensor is shown in Figure 4.

Architecture of the total electric field sensor.
A cylinder made of aluminum with nickel plating is used as the shell of the sensor to avoid the accumulation of ion flow under the HVDC transmission line, and it has the characteristics of high surface hardness, ant bounce, high adhesive force, long-time color remained, and little pollution.
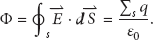
The DC motor is enclosed in the upper part of the field mill and connected together with the earthed rotor through the motor shaft. The sensing electrode is periodically exposed to the DC field on account of the earthed rotor. The speed of DC motor can be measured by means of a photoelectric sensor. The signal that comes from the photoelectric sensor can be usefully employed as the feedback signal to control the speed of the motor as well as the synchronous control signal for the phase sensitive detection. A printed circuit board which is enfolded in the lower part of the field mill to avoid the noise includes DC motor controller, signal conditioning unit, and power management section. A high-performance microcontroller (STC12C56) which can acquire the real-time speed signal and compare with a given value to achieve a constant rotation speed is embedded in the DC motor controller. The signal conditioning circuitry which is composed of the charge amplifier, the band pass filter, the phase-sensitive detection, and the low pass filter tends to achieve the conversion from field-induced charge to voltage for further processing. The total electric field sensor is shown in Figure 5.
Picture of the total electric field sensor.
3.3. Wireless Node Layout and Components
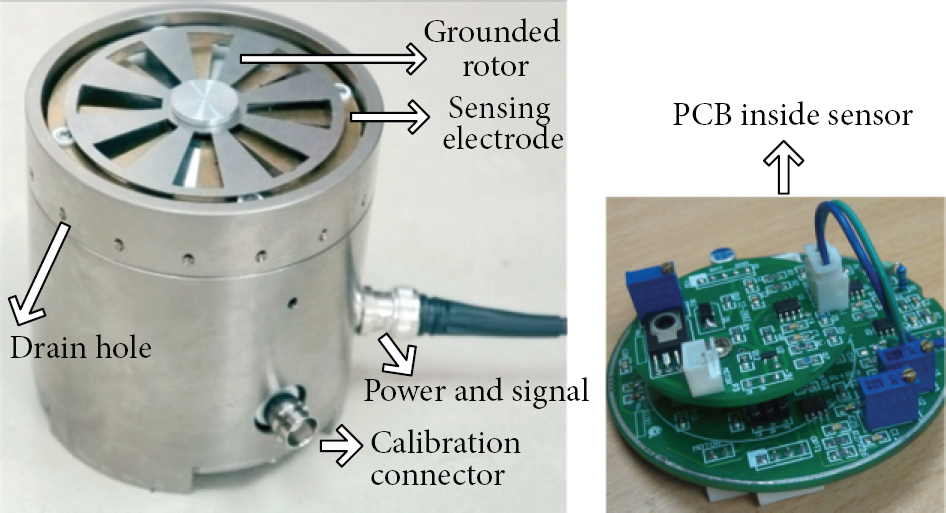
A block diagram of the proposed wireless node is presented in Figure 6. The wireless node's primary function is to acquire and process the output analog signal of the field mill and send the digital signal to the remote node. The wireless node is connected with the field mill through the twisted-pair braid shielded cable to achieve the signal transmission and power supply. The value of the electric field can be directly obtained through the LCD screen in the wireless node. The core of the wireless node is the STM32F embedded microcontroller and 2.4 GHz Xbee Pro radio frequency (RF) module.
Block diagram of the proposed wireless node.
The STM32F103VE is selected as the microcontroller for the wireless sensor node. It is the low voltage (3.3 V) version in the STM32 family and features 512 KB of flash memory and 64 KB of static random access memory (SRAM). In addition, the STM32F103VE contains five universal synchronous/asynchronous receivers transmitters (USARTs) and three serial peripheral interfaces (SPI), which are both essential for communicating with the RF module, watchdog module, and electrically erasable programmable read-only memory (EERPOM) nonvolatile module. The USARTs not only interface with the RF module but also allow communication with the RS-232 port on a PC. Another valuable feature of the STM32F103VE is that it integrates a real-time clock (RTC) which can provide a clock calendar function for the wireless node. Besides, three 12-bit analog-to-digital converters are embedded into the microcontroller to acquire the analog electric field signal from the sensor.
The signal-conditioning stage brings the voltage level from −1.5 v–+1.5 v to 0–3 v, and then the low pass filter and the impedance matching circuit are employed to process the amplified signal so that it can be suitable for the analog-digital conversion. To minimize the error of the signal-conditioning circuit, the high precision operational amplifier with low offset voltage is used. The use of liquid crystal display can facilitate viewing and recording data for operator. The power of the liquid crystal display and frequency module is controlled by the power management unit and can be turned off to the low power mode when the wireless node receives the instruction from the remote computer.
The wireless communication system selected for the sensor node is the 2.4 GHz Xbee Pro radio frequency (RF) module based on IEEE 802.15.4 protocol from Digi. The RF module can operate from a 2.8 to 3.4 V supply and consume between 45 and 50 mA for receiving and transmitting (Rx/Tx) operations. Typical range for the module is 1.5 km line-of-sight with 2.0 dB dipole antenna and 90 m indoor. The convenience of the RF module is the main driver for its integration into the wireless sensor node. The only requirements beside the power and ground lines are the connections between the DIN and DOU pins of the module and the STM32 UART Rx/Tx pins.
The wireless node acquires the analog signal from the field mill using the integrated analog-digital convertor of the microcontroller. The digital low-pass IIR filter is employed to process the acquired data. The outcome information of the electric field is calculated and then transmitted to the RF module through the serial bus. It is important to note that the configuration of the wireless node is very flexible. The microcontroller can be easily programmed to connect any electric field sensor whose calibration data is sent by the PC and saved to the EEPROM. The proposed wireless node is shown in Figure 7.
Picture of wireless node.
4. Implementation of the Distributed Measurement System
4.1. Topology of the Wireless Sensor Network
The DigiMesh networking protocol is applied in the wireless sensor network considering the complexity of the operating conditions and wireless transmitting distance under power lines. The DigiMesh network is a simplified mesh network in which all nodes are collaborative and can be either as router or end-node. The characteristic of the network making the expansion of the network is more flexible and increases the robustness in complicated environments under transmission lines where routers may fail due to interference or damage. The topology of the wireless sensor network is shown in Figure 8.

Comparison with different topology of the wireless sensor network.
4.2. Software Design of the Measurement System
Before designing software for measurement system, demand analysis will be performed on the software use. The software is mainly for the on-site operator and data analyst, both of whom have different demands of the software. The on-site operators are required for setting of description of sensor, configuration of parameters of wireless node, and real-time data collection, as well as real-time surveillance for the node conditions. For data analysts, relevant analyses and processing will be done to the data stored in the database after finishing the measurement. Therefore, according to these demands, a use-case diagram for demand analysis of the software is shown in Figure 9.
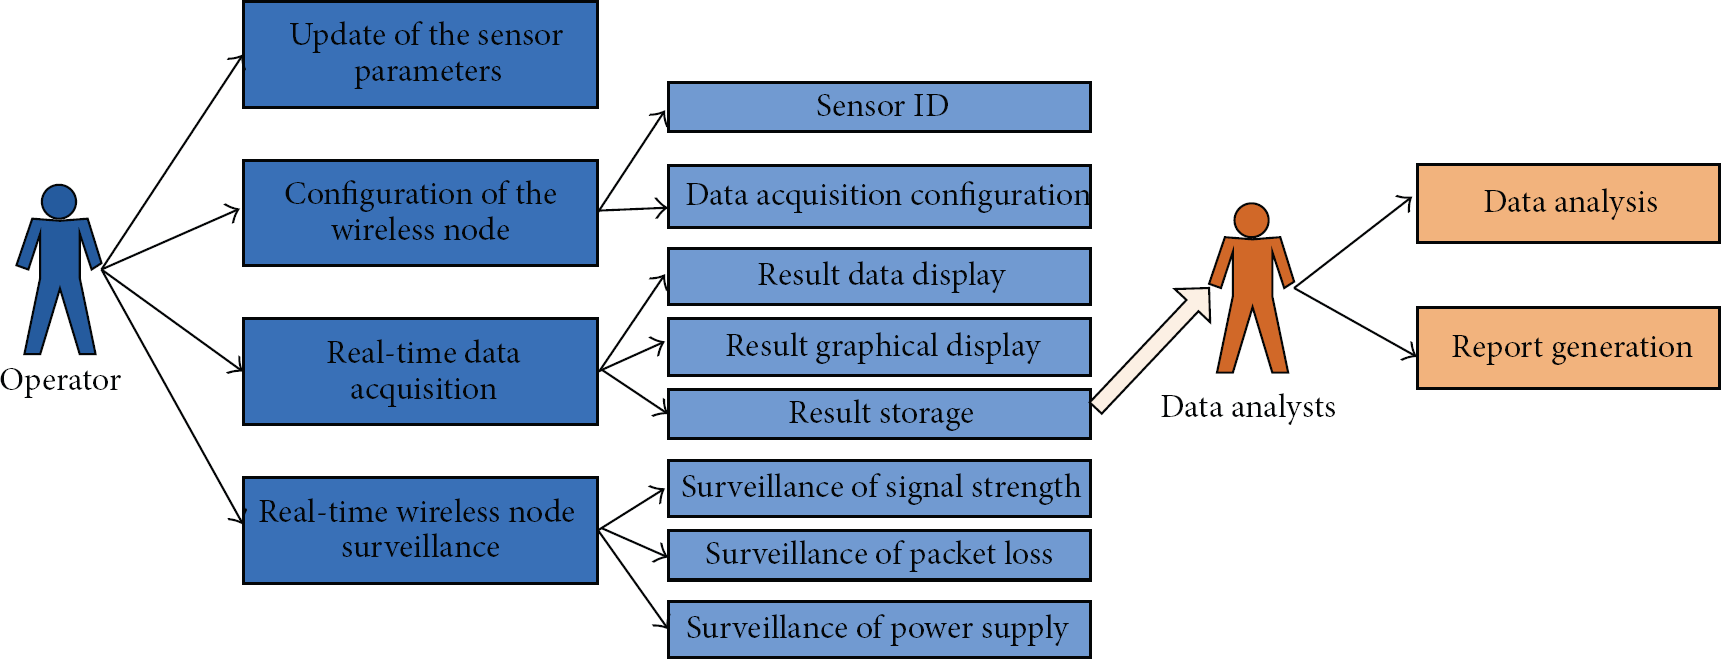
Use-case diagram of measurement system demand analysis.
Software structure is built based on the demand analysis of users, as shown in Figure 10. Measuring software consists of display layer, control layer, and data layer. Display layer, locating at the upper layer, is used for displaying relevant data, curve, and network node conditions; control layer, locating in the middle layer, is the core layer of the three and has much interaction with the remaining two layers, supplying operations to the users so as to realize the real-time control to the electric field; data layer, locating in the lower layer, realizes the real-time storage of data. Display layer and control layer are composites of interaction surface of human and machine, which is oriented for the on-site operator, while data layer is backed by database, which is oriented for data analysis personnel.

Three layers of the measurement system software.
Based on the proposed structure, the measurement software used in this system is developed as shown in Figure 11. Main interface of software composites of 6 parts: 1 is the menu and tool bars, including all operations for the users; 2 is the node information list, listing all active wireless node numbers in the network; 3 is the information box, showing operation feedback and abnormal information; 4 is the node condition list, listing signal strength, power supply state, and collected data of nodes, among others; 5 is the curve display, showing real-time distribution of electric field under transmission lines in histogram; 6 is the system information bar, recording the chosen parameter by the user.

Software interface of the measurement system.
5. Validation and Experiment
5.1. Complex Environment Test
Conditions under HVDC transmission lines are complicated. Elements including electromagnetic interference, topographic inequality, vegetation, and weather changes have an impact on the wireless network communication quality. Therefore, a test will be performed on the system in the complicated environment.
There are many basic parameters [16, 17] used to determine the performance of wireless network system. The receive signal strength indicator (RSSI) value used for receiving data frame is analyzed. RSSI is the value difference between actual receiving signal intensity and optimal received power level. That means the bigger the absolute value of RSSI is, the stronger the signal decrease is. RSSI value can be read when each data frame is received in the transceiver module of Zigbee.
When corona discharge occurs in HVDC transmission line, wireless receiving may be affected. This wireless interference mainly originates from positive transmission line. Therefore, RSSI comparison test is taken in the two conditions of on-power and off-power of HVDC transmission line. RSSI on all signal channels supplied by RF module will be measured. There are 12 optional channels in the model provided to the users as Table 1 shows. Test result is as shown in Figures 12 and 13.
Centre frequency of 12 channels of RF module.


RSSI of 12 channels in the on-power state.

RSSI of 12 channels in the off-power state.
As seen from Figures 12 and 13, RSSI is not a fixed value but fluctuating in a certain range, which therefore cannot be replaced in the test by some instantaneous values. 100 times of RSSI collection are done in each test (including the following tests), after which the averaged value is analyzed. The result is as shown in Figure 14.

Average value of RSSI under different channels.
From Figure 14, the biggest difference of RSSI in the same channel in two conditions is less than 1.49 dBm. The value can be negligible since there are exterior interference factors that existed during the measurement. Thus, corona discharge in HVDC transmission line imposes no effect on the normal work of the system. Wireless interference field in HVDC transmission line has a strong intensity in the low frequency stage. It decreases quickly with the increasing frequency. When the frequency is over 10 MHz, interference strength can be neglected. Generally, wireless interference field intensity that occurred in the corona discharge in HVDC line is considered by 30 MHz at most. Frequency range of this system is around 2.4 GHz, and thus corona discharge in HVDC transmission line does not affect the normal work of this system. By studying any polygonal line in Figure 14, the biggest difference value of RSSI in 12 signal passages is less than 1.55 dBm. The value also can be negligible with consideration of uncertain exterior interferences, which means that there is a rather minor signal quality difference between the signal channels.
5.2. Total Electric Field Measurement at Test HVDC Transmission Line
To validate and test the proposed wireless measurement system, a double circuit experimental line on the same tower was erected by the China Electric Power Research Institute in Beijing. The transmission line is 100 m long and the model of the transmission line is LJG-95/20 with 4 bundles of 40 cm spacing. The minimum distance from the ground plane of pole is 7 m and the separation distance between the positive pole and the negative pole is 6 m.
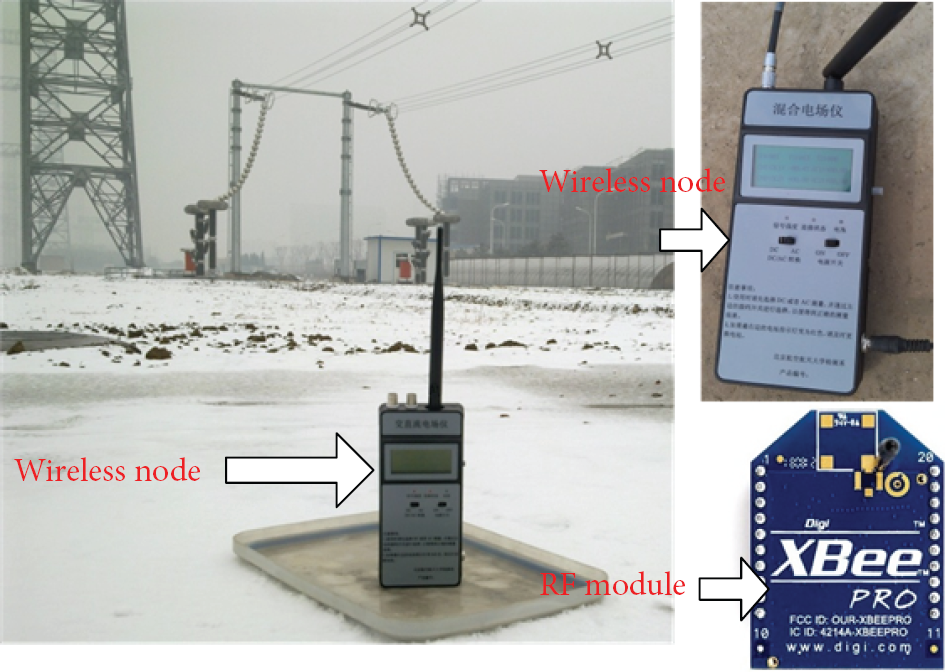
At the test base located at the center of the span line, the total electric field of 16 different points under the experimental lines was measured. The origin of the measurement result coordinate was set at the central position of the positive pole and the negative pole. The sensors and wireless nodes were arrayed along the direction perpendicular to the transmission lines with the separation from the origin at −12 m, −10 m, −8 m, −7 m, −6 m, −5 m, −4 m, −3 m, 0 m, 3 m, 4 m, 5 m, 6 m, 7 m, 8 m, and 10 m. The arrangement diagram of the measurement system is shown in Figure 15 and the photo of test base and measurement system is shown in Figure 16.

Arrangement diagram of measurement system.

Picture of measurement system used in HVDC test base.
The voltage applied to the positive pole was 150 kV, 200 kV, 250 kV, and 300 kV. Correspondingly, the voltage applied to the negative pole was −150 kV, −200 kV, −250 kV, and −300 kV. The meteorological conditions are the important element to influence the measurement results. In the experiment, the temperature was 24°C and the relative humidity was 42%. It was a fine day with the speed of wind lower than 1 m/s. A large number of experimental measurement data of the electric field under the double-circuit experimental lines on the same tower were obtained. One of the measurement results is shown in Figure 17.
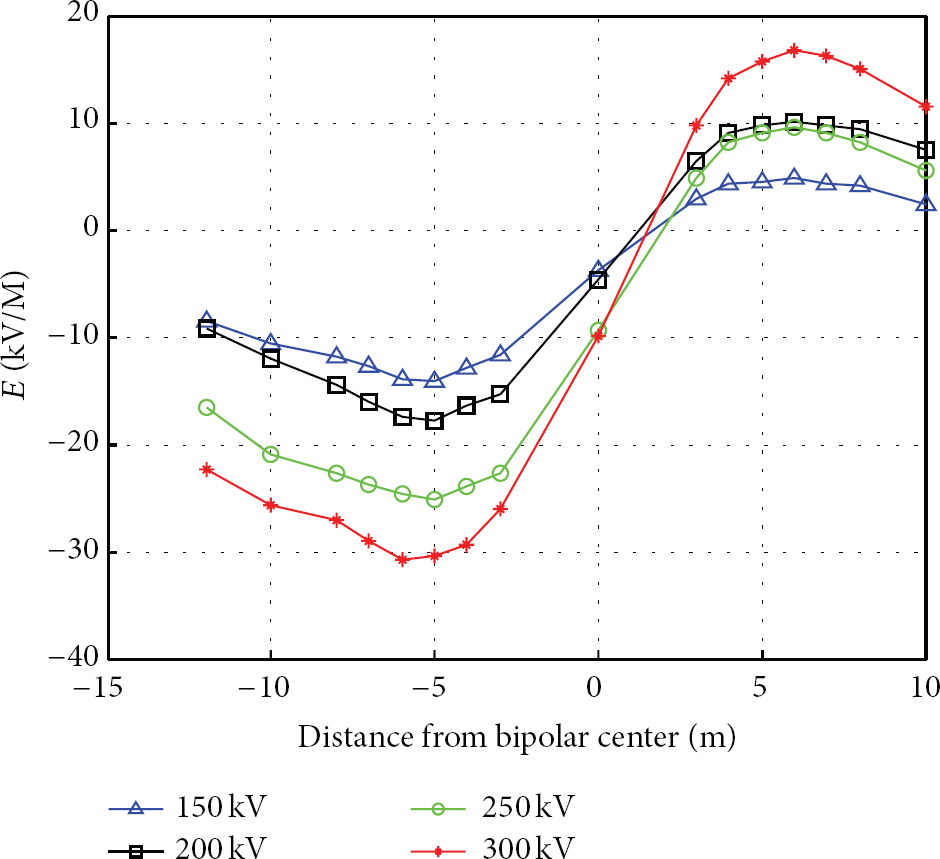
Measurement results of lateral distribution diagram of total electric field at ground level under different voltage level.
From Figure 17, the following conclusions can be drawn.
The total electric field of the point under measurement is enhanced with the increase of the voltage level applied to the transmission lines. The point where the electric field is the maximal of all measurement points for one pole under the experiment lines is at 2 m–5 m from the ground projection of the pole without the interference of the wind. With the increase of distance from the pole, the ground total electric field value decreases, which is in accordance with the theoretical calculation results. Because of the difference between corona onset electric fields of the positive and negative poles, the absolute value of the electric field strength under the negative pole of the experimental lines is larger than that under the corresponding positive pole. The measurement results of the electric field basically agree with the calculation results, which demonstrate that the designed wireless measurement system can accurately measure the total electric field under transmission lines.
6. Conclusion
In this paper, a wireless senor network-based system to measure the distributed total electric field under transmission lines for fulfilling the demands of extensibility, flexibility, and stability has been presented. The proposed system comprises a group of wireless nodes connected with electric field sensors and a remote node. The electric field sensor based on Gauss's law is elaborated and developed. For the design of wireless node, the ARM microprocessor and Zigbee radio frequency module are used. The characteristic of the networking protocol making the expansion of the network is more flexible and increases the robustness in complex environments under transmission lines. The implementation and experimental results under in situ HVDC transmission lines demonstrate that the proposed measurement system can adapt to the complex electromagnetic environment and accurately collect the electric field data.
Footnotes
Conflict of Interests
The authors declare that there is no conflict of interests regarding the publication of this paper.
Acknowledgments
This research was supported by the National Natural Science Foundation of China (61273165, 51207005) and the Basic Research Foundation of Beihang University (YWF-14-ZDHXY-13).