
Abstract
Camera sensor networks have developed as a new technology for the wide-area video surveillance. In view of the limited power and computational capability of the camera nodes, the paper presents an abnormal behavior detection approach which is convenient and available for camera sensor networks. Trajectory analysis and anomaly modeling are carried out by single-node processing, whereas anomaly detection is performed by multinode voting. The main contributions of the proposed method are summarized as follows. First, target trajectories are reconstructed and represented as symbol sequences. Second, the sequences are taken into account using Markov model for building the transition probability matrix which can be used to automatically analyze abnormal behavior. Third, the final decision of anomaly detection is made through the majority voting of local results of individual camera nodes. Experimental results show that the proposed method can effectively estimate typical abnormal behaviors in real scenes.
1. Introduction
Camera sensor networks consist of low-power microcamera nodes, which integrate the image sensor, embedded processor, and wireless transceiver. Multiple camera nodes with different views can provide comprehensive information and enhance the reliability of the captured events. Due to the advantages of enlarging surveillance area and solving target occlusion, camera sensor networks are best suited for real-time visual surveillance applications [1, 2]. One of essential purposes of visual surveillance is to detect moving targets and identify abnormal behaviors. In the past, model-based approaches have been proposed to tackle the anomaly detection problem. The work in [3] adopted dynamic Bayesian networks to model normal activities. An activity will be identified as abnormal if the likelihood of being generated by normal models is less than a threshold. Nevertheless an appropriate threshold is hard to determine in practice. In [4], a hidden Markov model (HMM) was applied to represent normal activities and perform anomaly detection. Note that it is difficult to label all the activities because of the tremendous variety of movement states. Trajectory modeling can determine the movement anomaly in video sequences, and many previous works have discussed the issue. In [5], vision-based trajectory learning and analysis methods were discussed. In [6], a sparse reconstruction analysis of target trajectory was introduced to detect abnormal behaviors. However, most of these works employ supervised learning to recognize normal behaviors, which requires a large number of labeled training data. Furthermore, the existing works mainly focus on maximizing the detection accuracy and detect abnormal behaviors through a single visual camera without involving the information fusion and interaction of camera nodes. These methods are inapplicable to sensor networks because of the node's limited power, memory, and computational capabilities.
Several approaches using sensor networks have been proposed to detect abnormal behavior. In [7], the authors presented an approach with a low false alarm rate to detect abnormal activities by deploying wireless wearable sensors. But the proposed approach adopts some scalar sensors instead of camera sensors and its main challenge is that it is difficult to clearly define abnormal behaviors due to the uncertainty in the different types of signals received from these wearable sensors. The work in [8] proposed a sequential syntactical classification approach to detect abnormal behaviors in a network of clustered cameras, where the temporal sequence of the camera sensor with the best field of view (FOV) was collected and classified in a centralized operations center. Though the approach is able to classify abnormal sequences correctly, anomaly detection is based on centralized processing and does not fully consider the resource restrictions of camera nodes. In [9], a framework of networked low cost embedded video sensors was presented, where visual cues, such as projection histogram and elliptical fitting, were compared with reference patterns to identify posture and deduce behavior. The drawback of this work lies in the fact that information interaction and collaboration between sensors are not explicitly addressed. The work in [10] proposed a HMM-based approach for detecting crowd behavior by using a heterogeneous sensors network comprising visual cameras and a thermal infrared camera. In [11], the authors used HMM and Bayesian network to model crowd behaviors and compared the two methods by detecting abnormal behaviors, fight and robbery, in the scene. Nevertheless the two approaches merely use the features extracted from heterogeneous camera sensors to model normal behavior, which is executed by a centralized supervised learning method. It is infeasible in distributed camera sensor networks.
Considering the resource constraints on camera nodes, abnormal behavior detection in camera sensor networks should be implemented by distributed processing and collaboration among camera sensors. The distributed processing means that the anomaly detection can be run in the local camera node, which can significantly reduce the communication cost of information exchange. Collaboration among camera sensors can effectively improve the detection reliability. However, for abnormal behaviors detection in camera sensor networks, there have been relatively few works concerning the above issues. As is well known, trajectory analysis is an effective method to detect abnormal behaviors. In this paper, we propose a novel approach to abnormal behavior detection based on trajectory analysis. The proposed method retains low computation complexity whilst having desirable detection reliability. Each camera node detects moving targets within its FOV and extracts target blobs. A target trajectory consists of the center positions of a target blob. Then the target trajectory is reconstructed and treated as a series of strings through symbolic representation. This process reduces the number of data to be processed and makes it possible for Markov model to build transition probability matrix without any prior information in complex scenarios. The anomaly detection can be implemented by estimating the anomaly probability of the input sequence. The final decision is made based on the majority voting of camera nodes which can improve the reliability. The experimental results demonstrate that our method is reliable and feasible for abnormal behavior detection in camera sensor networks.
The remainder of the paper is organized as follows. Section 2 introduces the moving target detection and the symbolic representation of target trajectory. Section 3 describes the scheme for abnormal behavior detection, node communication, and voting mechanism. Experimental results and analysis on real video sequences from multiple camera nodes are demonstrated in Section 4. Finally, Section 5 concludes the paper.
2. Trajectory Analysis
2.1. Trajectory Extraction
The results of moving target detection and tracking should be obtained before analyzing trajectories. Our earlier work presented an effective background modeling and update method based on adaptive Gaussian mixture model to extract the target blobs [12]. In the light of the pixel-by-pixel processing of background modeling being computationally expensive, we will further simplify and improve the method so that it is applicable to camera nodes. First, a video frame is divided into image blocks with a predefined size, 3 × 3 pixels. Second, the average color value of every block is calculated and the image block is replaced by a pixel with the average value. Thus a new image frame consisting of these pixels can be constructed and its size is reduced to one-ninth of the original frame. Then, background modeling is implemented on the new image frame. Obviously, this process can greatly decrease the computational complexity and eliminate the influence of noise to a certain degree. Note that the detection results will get worse as the size of image blocks increases. Once a pixel is classified as foreground in the reconstructed frame, its corresponding image block in the original frame is labeled as target blob. Following target detection, a morphological process is run to remove artifacts and fill the holes within target blobs.
The target position is defined as the center of minimum boundary rectangle of target blob. Target trajectory is composed of a sequence of target positions; thus it can be extracted by target blob tracking. If there are multiple moving targets in FOV of a certain camera node, the same target blob in different frames can be identified by the hue histogram matching of target blob [13]. Hue histogram is robust to illumination changes and can be constructed using the hue values of the pixels corresponding to target blob. FOV of each camera node is a sector sensing region. When the tracked target leaves the FOV, the corresponding camera node terminates the detection and extraction of the target. Besides, target occlusions could be resolved by the collaboration of two or more camera nodes, which is not addressed in this work. Figure 1 depicts the results of target detection and trajectory extraction using the video sequences from two camera nodes with different views. The test results indicate that the method seems to be effective and practical in camera nodes. In Figure 1(a), there are two people walking along the road. Figure 1(b) shows that both of them can be properly detected by the proposed background subtraction. As can be seen in Figure 1(c), the trajectories are correctly extracted by combining the target blob tracking and hue histogram matching.

Target detection and trajectory extraction from two different views. (a) The original frame. (b) The results of the target detection. (c) The results of trajectory extraction.
2.2. Trajectory Representation
Symbolic aggregate approximation (SAX), an efficient symbolic representation, converts time series data to a string consisting of a finite alphabet Σ according to a set of well-defined rules [14]. Given the target blob trajectory
An example of trajectory representation with the above method is illustrated in Figure 2. According to the trajectory of a person, we can compute the subset of Euclidean distance between adjacent position coordinates,

Example of trajectory representation. (a) The sequence of Euclidean distance between two adjacent positions. (b) The corresponding symbolic representation.
3. Abnormal Behavior Detection
3.1. Anomaly Transition Model
The trajectory of moving target provides important information which can be analyzed to detect anomaly behavior. Generally, normal behavior is defined as calm movements, that is, a person moving relatively slowly across the scene. In this case, target trajectory can be presented as a regular sequence of position coordinates;
As described in Section 2.2, target trajectory extracted from blobs tracking must be converted to a symbol sequence. Let

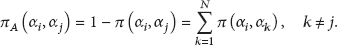
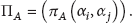
Table 1 illustrates the anomaly transition matrix of the trajectory of a walking person; it can be seen that the abnormal transition between symbols has different probability. For example, the anomaly transition probability of two symbol patterns “da” and “dc” is 0.9322 and 0.4195, respectively. This means that the abnormal degree of the former is greater than the latter's.
An example of an anomaly transition matrix with

3.2. Anomaly Detection
From the above description, anomaly probability of a SAX symbol sequence can be measured by the anomaly transition probability of the sequence. Given a SAX symbol sequence 
According to (4), an anomaly detection threshold should be predefined to judge whether an abnormal behavior occurs. The threshold is defined as, under normal conditions, the maximum anomaly probability of SAX symbol sequence with the same length. For each camera node, its detection threshold is determined by learning the training set which corresponds to symbol sequences gained from target trajectories without abnormal behavior. Assume that 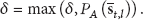
Thereafter, any symbol sequence whose anomaly probability exceeds the threshold is treated as a possible abnormal behavior. For a trajectory to be analyzed, if the symbol sequence is expressed as 
3.3. Node Communication and Voting
As a rule, a local decision from single camera node is likely to be unreliable under some specific circumstances. Because of the influences of occlusions, illumination change, and cluttered background distraction, a certain camera node may provide the trajectory information that deviates from actual values, which leads to wrong decision making. Therefore, it is necessary for abnormal behavior detection in camera sensor networks to have fault-tolerant ability to exclude the risk of false alarms. Referring to [16], the majority voting is adopted to make the final decision. In order to implement the voting, the camera node needs to collect all local decisions about the behavior of the same target.
If the FOVs of camera nodes are mutually overlapped, we define that these nodes are correlated. In this paper, it is assumed that the relative positions among the camera nodes are determined initially and each camera node knows its correlated nodes. If a camera node firstly detects a moving target, it will extract the target blob and produce the hue histogram of the blob. Then the camera node broadcasts the hue histogram to all the correlated nodes. At the same time, target blobs within the FOVs of the correlated nodes are extracted and the hue histograms of the segmented blobs are produced. When the correlated nodes receive the broadcast message, they will search for the corresponding target from the detected blobs. Due to the fact that each target's hue histogram retains its form between multiple camera nodes regardless of perspective effects, the correspondence between targets in different FOVs can be established by histogram matching. For a certain camera node, its correlated nodes that can detect the same target are seen as effective neighbors of the camera node. After the effective neighbors return one-byte acknowledgment message, the camera node can know its effective neighbors list and count the number of effective neighbors. Once the camera node reaches a decision about target trajectory, it will listen to the judge results from its effective neighbors. Note that a single bit, either 1 or 0, is used to represent a local decision. The camera node will report the abnormal behavior and raise an alert only if positive voting rate exceeds half of the total number of its effective neighbors. Additionally, the hue histograms used in this paper are of 18 bins and the number of pixels in each bin requires two bytes for representation. The information exchange between camera nodes is implemented by a wireless transceiver mounted on camera sensor board. For anomaly detection of a specific target, the foregoing indicates that the communication overhead of the entire camera networks is
4. Experimental Results
The proposed method is tested with actual sequences captured from six cameras in an outdoor environment. The resolution of the cameras is set at 320 × 240 pixels and the frame rate is 25 fps. The anomaly detection using trajectory analysis is divided into three phases. First, the sequence of Euclidean distance of target trajectory extracted from the raw image is trained and modeled in order to obtain the anomaly detection threshold. Second, abnormal behavior detection is performed by comparing anomaly probability of testing trajectories and the detection threshold. Third, the local decisions of the individual camera nodes are used to make a majority decision.
4.1. Effectiveness Evaluation
To demonstrate the effectiveness of the proposed method, we define two experiments with different types of abnormal behaviors. In the experiments, the number of trajectories for the training is 18 and each trajectory length is 220. Besides, the sliding window size
The first experiment considers a sequence of 500 frames where a person is walking along a road except two time intervals. The person suddenly starts running twice from frames 101 and 476. We regard walk as normal behavior while run as abnormal behavior. Due to space constraints, only three out of six camera nodes are explained. The sequences of Euclidean distance of the extracted trajectories from three different views are illustrated in Figures 3(a)–5(a), respectively. As can be seen, the Euclidean distance has larger values and remains relatively stable when the target is running. For three camera nodes, the results of anomaly detection are shown separately in Figures 3(b)–5(b). From Figure 3(b), the detection threshold of camera 1 is 0.0227, which is determined by training the sequences corresponding to normal behavior and denoted by the solid line. It can be seen that the anomaly detection probability is above the detection threshold during frames 116 to 150 and frames 491 to the end. This means that the camera 1 is able to identify correctly the anomaly twice. By contrast, the anomaly detection of camera 2 is unreliable, as shown in Figure 4(b). The detection threshold of camera 2 is 0.0235, under the condition that camera 2 only detects the first abnormal behavior from frames 126 to 150 whereas it fails to find the second. Similarly, it can be noticed that the result of camera 3 deviates from the truth in a few cases, as shown in Figure 5(b). Camera 3 detects the second abnormal behavior at frame 491. Conversely, the first is wrongly treated as two time intervals, frames 111 to 135 and frames 141 to 150. In other words, the abnormal behavior corresponding to frames 136 to 140 is labeled as normal behavior.

Anomaly detection from camera 1 with

Anomaly detection from camera 2 with

Anomaly detection from Camera 3 with
From above descriptions, the anomaly detection from the different views may vary and the result of individual camera node is even absolutely wrong. To demonstrate the feasibility and effectiveness of the voting mechanism, the detection result of each camera node is further analyzed. According to (6), the local decisions of three camera nodes are depicted in Figures 6(a)–6(c). Besides, the final decision can be made through the majority voting. That is, if two or more local decisions are true, the final decision will be true, and vice versa. The final decision is shown in Figure 6(d), where the two time intervals of abnormal behavior correspond to frames 116 to 150 and frames 491 to 500, respectively. Obviously, the voting result is much more reliable and closer to the reality.

The decision on abnormal behavior “run”. (a)–(c) show the local decision from three camera nodes, respectively. (d) shows the voting result.
The second experiment is tested on another scenario of 236 frames, which concerns a woman walking ahead and a man behind her. The man suddenly accelerates and overtakes her at frame 191. In this test, overtake is regarded as abnormal behavior. As before, we analyze the trajectory of the man and Figure 7 illustrates the anomaly detection of three camera nodes. As can be seen, the detection thresholds of three camera nodes are 0.0105, 0.0144, and 0.0196, respectively. All of three camera nodes capture the abnormal condition at different moments, whereas camera 2 makes a wrong decision on the subsequent test sequence. Comparing with the local decisions, the final decision seems to be convincing, as shown in Figure 8. It should be noted that different camera nodes indicate anomaly at different times and during different time periods. The main reason is that the cameras observe the target from different views. As a result, the target detection and trajectory analysis are affected in varying degrees.
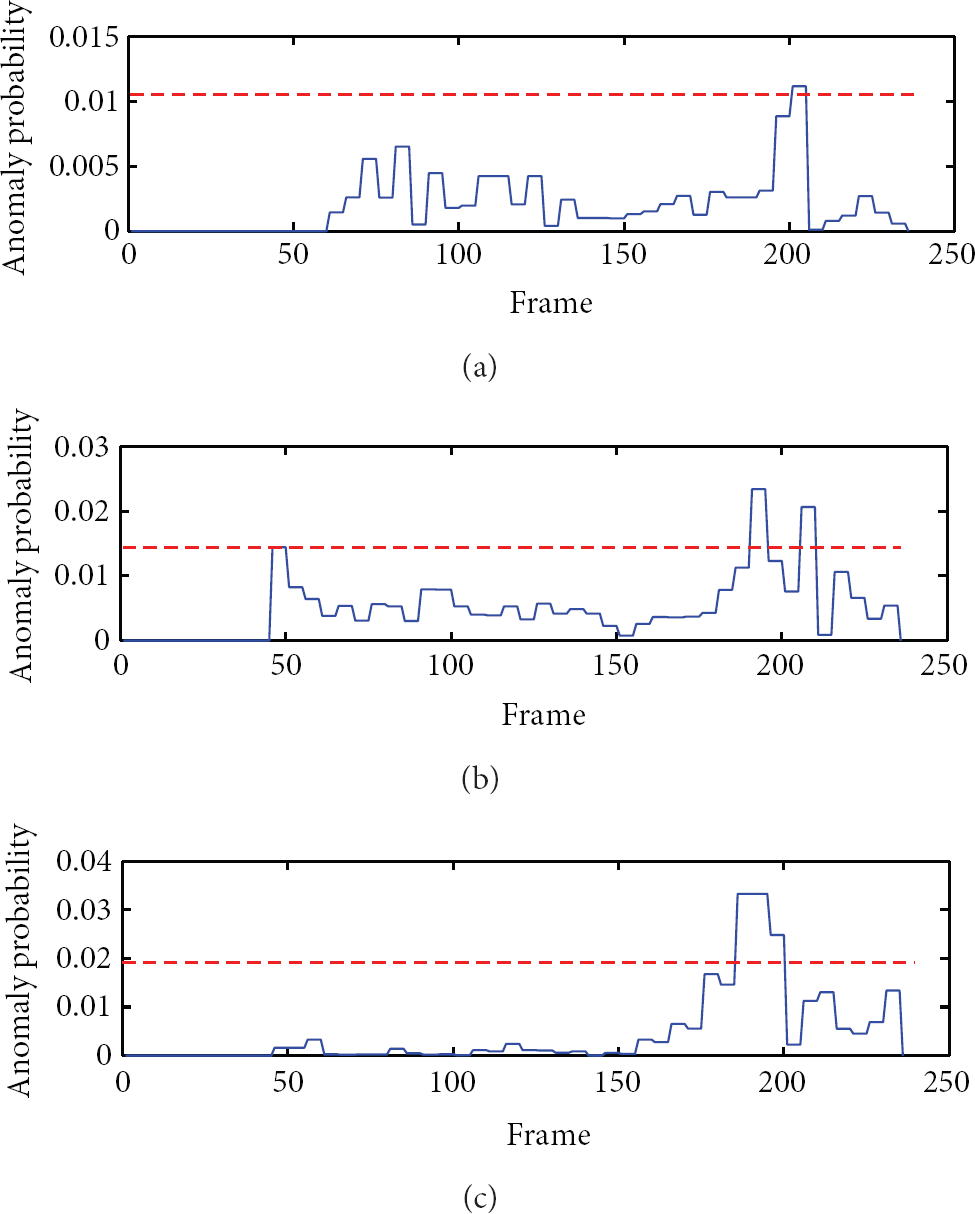
Anomaly detection from three camera nodes. (a) Camera 1 with

The decision on abnormal behavior “overtake.” (a)–(c) show the local decision from three camera nodes, respectively. (d) shows the voting result.
4.2. Performance Analysis
To demonstrate quantitatively the performance of abnormal behavior detection, we compared our method with two classical approaches described as follows. (1) Similarity-based approach (SA): this approach describes target trajectory in terms of a sequence of feature vectors where a feature vector represents both the position and velocity of the target. Anomaly detection is by examining the distance between the input and predefined patterns which is the nearest to the input vector by the Euclidean metric. If the distance exceeds a threshold, the input vector is considered abnormal; otherwise, the input vector is considered normal. (2) Model-based approach (MA): the basic idea is that the useful features of observations, such as the optical flow and the target size, are extracted and fed into HMM in order to model normal behavior. Anomaly detection can be done by estimating an observation sequence with the trained HMM. If the HMM yields a low likelihood value for the observation sequence, it is likely that the sequence represents abnormal behavior. We evaluate the reliability of abnormal behavior detection using the ROC curve, which plots the detection rate against the false alarm rate. The former is defined as the ratio of the number of abnormal behaviors which are correctly detected to the total number of abnormal behaviors, and the latter is the ratio of the number of normal behaviors that are incorrectly detected as abnormal behaviors to the total number of normal behaviors. The number of testing trajectories is 54, each sequence is composed of normal and abnormal behaviors. Anomaly detection is implemented in single camera node and the comparison is based on the averaged results. Figure 9 represents ROC curves illustrating the detection rate and the false alarm rate of three methods. It can be observed that the detection reliability of the proposed method is very similar to that of the MA while obviously it is higher than that of the SA. Additionally, we analyze the runtime of three methods, which can intuitively reflect the computation complexity. The experiment results show that the average runtime of SA, MA, and the proposed method is 65.8, 147.1, and 99.9 ms, respectively. By contrast, although the MA is a little over the proposed method in the detection rate, it is time consuming and requires more computational resources. Meanwhile, the computation efficiency of our method is lower than that of the SA, but our method has a distinct advantage over the SA in detecting abnormal behavior. Therefore, it can be concluded that the proposed method outperforms two other methods because of having the best tradeoff between the detection reliability and computation complexity.

Performance comparison of three methods.
The following experiments are conducted to investigate the effect of varying the number of camera nodes on the performance of the proposed method. Figure 10 shows the ROC curves of our method under different number of camera nodes. We can see from this figure that the proposed method has a high detection rate and a low false alarm rate, which validates the effectiveness of symbolic representation of target trajectory and anomaly probability detection based on Markov model. For example, when the number of camera nodes is 3, the proposed method can achieve a high detection rate of 93.7% and a low false alarm rate of 7.2%. From the results shown in Figure 10, when the number of camera nodes increases, the performance of the proposed method increases accordingly. The main reason is that the fault-tolerant ability of anomaly detection is strengthened by utilizing the voting among multiple camera nodes. Furthermore, it can be seen that the algorithm performance has no tendency to improve when the number of camera nodes increases to five. In addition, we notice that computational costs for node collaboration increase moderately as camera nodes increase. This is because the time required for target matching in different FOVs using hue histogram is dependent on the number of neighboring nodes. Note that the average runtime of the proposed method for six camera nodes is 184.2 ms. The comparison and analysis show that the proposed method is feasible for camera sensor networks.
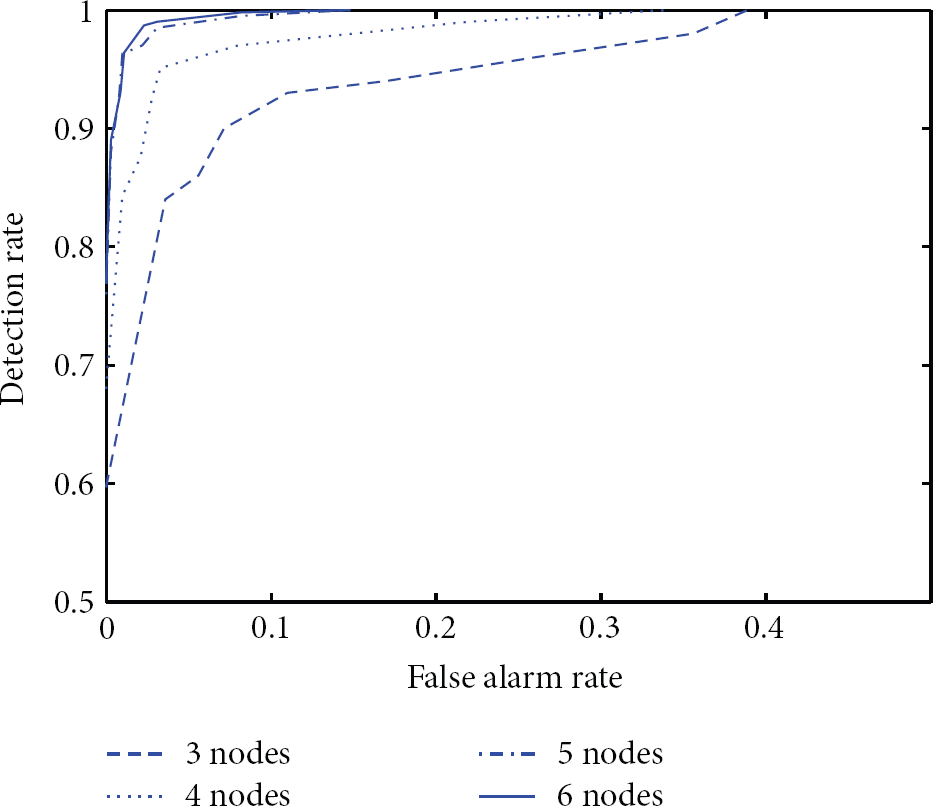
Performance analysis of the proposed method under different numbers of camera nodes.
5. Conclusions
This paper addresses an approach to abnormal behavior detection based on trajectory analysis. The Euclidean distance between two adjacent coordinates is represented as a symbol sequence. A first-order Markov model is used to build the anomaly transition matrix and the detection threshold can be determined by training the obtained symbol sequences. The voting mechanism reaches a final decision in accordance with local decisions of camera nodes. The experimental results show that the SAX representation of target trajectory is effective and the proposed method possesses relatively high reliability of abnormal behavior detection. Moreover, our approach is proper for camera sensor networks due to the lightweight communication overhead and less computation complexity.
However, the anomaly detection proposed by this paper is directly related to target detection and trajectory extraction. If target trajectory largely deviates from the actual condition, the anomaly detection will be wrong. It is undesirable for complex abnormal behavior detection to only consider the trajectory information. Therefore, it is vital to find a representative and sufficient description of the training data corresponding to normal behavior. Although the proposed method is able to detect abnormal behavior in different scenarios, we find that the SAX parameters in training and detection phase have influences on the performance and they are hard to estimate. Our future work will focus on this issue.
Footnotes
Conflict of Interests
The authors declare that there is no conflict of interests regarding the publication of this paper.
Acknowledgments
This work was supported by the Natural Science Foundation of China under Grants 41202232 and 61271274 and the Research Program of Hubei province, China, under Grants 2012FFA108 and 2013BHE009.