
Abstract
According to the Chinese Design Specification for Highway Alignment (JTG D20-2006), eight-lane expressways should be paved with an inside shoulder of 2.5 m; however, this regulation is rarely obeyed in engineering practice. On the basis of driving simulator experiment, this research examined the impacts of inside shoulder on vehicle operation with and without the speed limitation. A virtual scenario, consisting of five expressways with different inside shoulder widths, was created and displayed in driving simulator, and vehicle operational data—speed and lane position—were recorded. Authors used analysis of variance (ANOVA) and contrast analysis to examine whether inside shoulder width had statistically significant effects on travel speed and lane position. Analytical results indicated that there is a kind of quadratic relationship between inside shoulder width and driver's speed choice, while driver's speed choice is not significantly affected by inside shoulder width. What is more, inside shoulder width has statistically significant effects on vehicle's lane positions, and vehicle's lane position is negatively correlated to inside shoulder width. Specifically, the vehicle can be maintained at the center of lane when the inside shoulder width is 2.5 m.
1. Introduction
According to official data, single-vehicle crashes occupied half of all traffic crashes on Chinese urban expressways, and previous research has implied that the major contributing factors for single-vehicle crashes are related to inside shoulder [1]. The inside shoulder (or left shoulder for divided right-hand traffic) is regarded as an effective countermeasure providing space or lateral clearance for drivers. According to the Chinese Design Specification for Highway Alignment (JTG D20-2006), eight-lane expressways should be paved with an inside shoulder of 2.5 m [2]. Nevertheless, this regulation is rarely obeyed in engineering practice.
The standards or guidelines for inside shoulder paving are clearly regulated in many countries. For example, in the United States, both inside and outside shoulders must be paved on expressways, and the minimum width of outside shoulder is 3.05 m [3].
Apart from guidelines or standards, a lot of researches have studied the impacts of outside shoulder on traffic safety and vehicle operation. However, the effects of the inside shoulder on vehicle operation remained unclear.
Urbanik II and Bonilla (1987) researched the safety impacts of decreasing the outside shoulder width on urban expressways [4]. Hadi et al. (1995) studied the impacts of outside shoulder on traffic crashes on rural multilane highways [5]. Bamzai et al. (2011) built the relationship model between outside shoulder-related crashes and outside shoulder widths [6].
It is easy to observe that the aforementioned studies reached their results and conclusions by historical data of traffic crashes; thus, there will be some confounding impacts of other factors on research findings. In recent years, with the development of simulation technology, more researches have been conducted using driving simulation method. For instance, van der Horst and de Ridder (2007) examined the influence of roadside infrastructure (such as emergency vehicle lanes and guardrails) on driver's speed choice and the lateral position of their vehicles by driving simulator [7]. Ben-Bassat and Shinar (2011) also used driving simulator to analyze the effects of shoulder width, guardrails, and roadway geometry on driver perception and behavior [8].
In China, Zhong et al. (2011) demonstrated the necessity of paving inside shoulders on eight-lane expressways [1]. Wu et al. (1996) stated that the recommended width of the paved outside shoulder should be 3.5 m or 3.0 m and the recommended value for unpaved outside shoulder width should be 1.0 m [9].
In summary, most previous researches focused on safety impacts of outside shoulders. From the perspective of research method, some researchers analyzed the safety impacts of outside shoulder based on historical traffic crashes data. Therefore, to specifically study the impacts of different inside shoulder widths on vehicle operation, the vehicle's speed and lane position were chosen as dependent variables. What is more, to best control the negative effects of confounding factors on empirical data and to guarantee driver's safety, a driving simulation experiment was conducted in this research. Based on the analytical results, the impacts of different inside shoulder on vehicle operation would be evaluated.
2. Methods
2.1. Participants
Thirty relatively young male subjects (20–26 years), with an average age of 24 years and an average driving experience of 3 years, were recruited by advertisements, and they were not informed of the true purpose of this experiment.
2.2. Driving Simulator
A fixed-base driving simulator was used in this study (Figure 1). The virtual scenario is displayed on three large screens, which can provide a 130° field of views; in addition, the data acquisition frequency is 30 Hz. The driving simulator can collect different kinds of vehicle operational data, such as speed, acceleration, and lane positions. In this experiment, the real-time data of speed and lane position were collected. The lane position refers to the distance from the center of the vehicle to the center of the lane (in meters).
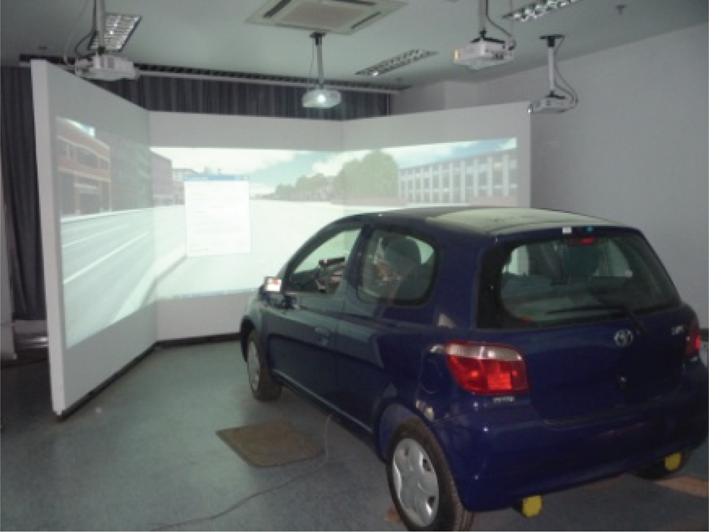
Driving simulator.
2.3. Virtual Scenario
This research built a virtual scenario (Figure 2), which consisted of five eight-lane, two-way divided expressways and five horizontal curves served as transition segments. Except for the inside shoulder width, all other geometric design features of the five expressways were identical. According to the Chinese Design Specification for Highway Alignment (JTG D20-2006) and practical applications, the inside shoulder widths for expressways 1–5 are designed as 0 m, 0.5 m, 0.75 m, 1.5 m, and 2.5 m, respectively (Figure 3). Expwy 0, Expwy 0.5, Expwy 0.75, Expwy 1.5, and Expwy 2.5 are used to denote expressways 1–5. Detailed geometric design features are listed in Table 1.
Geometric design features.


Layout of virtual scenario.

Expressways 1–5.
2.4. Procedures
At the very beginning, experimenters would read instructions to subjects. From the instruction, subjects were informed that the formal test consisted of two sessions. In the first session, subjects must drive at 120 km/h, because the maximum speed limit of the eight-lane bidirectional expressway in China is 120 km/h. In the second session, subjects could drive without speed limit in the same scenario, yet they are still required to obey their own habits and driving patterns. In addition, subjects must drive in the inner-most lane through the formal test. After the instruction, each subject was required to fill out a questionnaire recording their basic information (including age, gender, and driving experiences) as well as the subject's physiological and psychological status. Then subjects were required to perform a test drive for 5–10 minutes on a specific scenario to become familiar with the driving simulator.
To avoid driving fatigue, the experiment was conducted in three periods: the morning period (8:30–11:30 am), the afternoon period (3:00–5:00 pm), and the evening period (6:30–9:00 pm); each subject was randomly assigned to one of these three periods. The virtual scenario consisted of five expressways with different inside shoulder widths; one of the five expressways was randomly selected as the start for each subject, in order to minimize the order effect. Each subject drove the scenario once in each session. Each session lasted about 30 minutes per subject.
Data was saved for each time a subject completed the driving task. When each formal test was finished, the subject should fill out a questionnaire to report his subjective evaluation of the driving simulator, and the physiological and psychological status was measured again.
3. Analysis and Results
3.1. Subjective Questionnaire
In this experiment, the questionnaire asked subjects to subjectively evaluate the performance of the driving simulator. The items included brake, accelerator, and virtual scenario. The ratings ranged from 0 (representing “not at all similar to the real world”) to 10 (representing “extremely similar to the real world”). The results are shown in Table 2.
Ratings of subjective evaluation.

3.2. Relative Speed Contrast
To better describe the impacts of different inside shoulder widths on speed, raw speed data in the second session of the formal test (without speed limit) were processed in three steps. At first, researchers plotted each subject's speed profiles, which corresponded to operation status in expressways with five different inside shoulder widths. Then, the steady state speed in each expressway was calibrated. Finally, the indicator relative speed contrast is defined as follows:
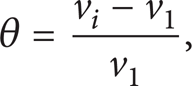
where θ is relative speed contrast; v i is the steady state speed in expressway i, i = 1, 2, 3, 4, 5; v1 is the steady state speed in expressway 1, whose inside shoulder width is 0 m.
As previously mentioned, expressways 1–5 are represented as Expwy 0, Expwy 0.5, Expwy 0.75, Expwy 1.5, and Expwy 2.5, respectively. Thus, relative speed contrast could be used to figure out the relationships between the steady state speeds and different inside shoulder widths, which was shown in Figure 4. The relative speed contrast profile appeared as a kind of quadratic trend. When the inside shoulder width was no more than 1.5 m, there was a positive correlation between inside shoulder width and relative speed contrast, and the steady state speed reached the highest degree when the inside shoulder widths were 0.75 m or 1.5 m. If the inside shoulder width continued to increase, the steady state speed would descend accordingly. The curve regression analysis validated that there was a quadratic relationship between inside shoulder width and relative speed contrast (R2 = 0.969, P < 0.05).

The average of relative speed contrast.
Analysis of variance with repeated measures (rANOVA) was performed to evaluate the impact of inside shoulder width on relative speed contrast. The results from rANOVA showed no significant difference among the five expressways in terms of the relative speed contrast (F(4, 116) = 0.551; P = 0.699). The test results suggested that inside shoulder width had little effect on vehicles' relative speed contrast in this virtual road environment.
3.3. Lane Position
The magnitude of a vehicle's deviation from the center of lane was evaluated by calculating the average lane position of the vehicle. The results are shown in Figure 5. Specifically, the lane position profile in Figure 5(a) was obtained while vehicle was driving at 120 km/h; on the contrary, the lane position profile in Figure 5(b) corresponded to the vehicle operation status without speed limit. Compared between Figures 5(a) and 5(b), the variation trends of lane position at two driving conditions were similar. The average lane positions were all positive for all expressway segments at two driving conditions, which meant that the vehicle was at the right of the center of the lane for all expressway segments at two driving conditions.
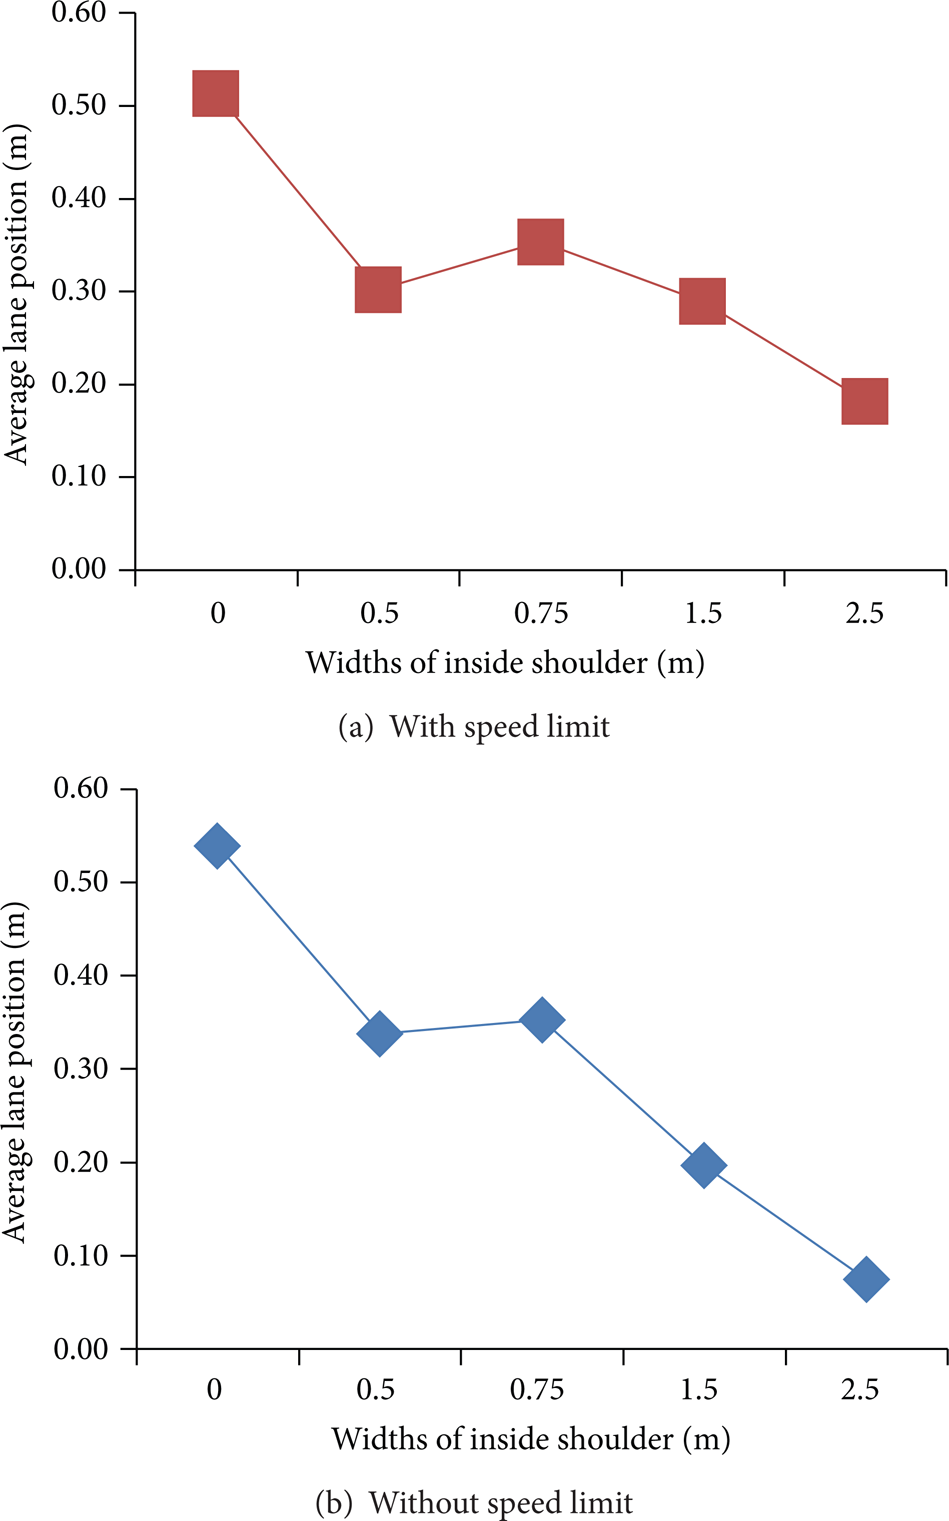
The average of lateral positions.
Furthermore, two lane position profiles indicated nearly linear trends, especially negative correlation between different inside shoulder widths and average lane positions, which was proved by statistical results of the correlation analysis (for Figure 5(a), r = − 0.884, P < 0.05; for Figure 5(b), r = − 0.968, P < 0.05). With the increase of inside shoulder width, the average lane position declined, meaning that vehicle moved toward the inside shoulder. The average lane position in Expwy 0 was the highest (more than 0.5 m), while the average lane position in Expwy 2.5 was the lowest (less than 0.2 m). That is to say, vehicles in Expwy 0 were the farthest from the center of the lane, while vehicles in Expwy 2.5 were the nearest to the center of the lane. It implied that the vehicles in Expwy 0 might be more unsafe than the vehicles in other expressways, because the vehicles tended to enter into the adjacent lane in Expwy 0. On the contrary, vehicles in Expwy 2.5 might be the safest.
After all, there is still a difference between two profiles. As shown in Figure 5(a), the average lane positions in Expwy 0.5, Expwy 0.75, and Expwy 1.5 were almost the same, while in Figure 5(b), the average lane positions in Expwy 0.75, Expwy 1.5 and Expwy 2.5 declined linearly, which illustrated that the average lane positions in Expwy 1.5 and Expwy 2.5 were smaller than the ones in Figure 5(a). Such phenomenon could be explained as larger inside shoulder width would provide enough clearance for subjects to maintain vehicle positions with more confidence while they were driving without speed limit, particularly higher than 120 km/h.
Further, a rANOVA was conducted to evaluate the impacts of different inside shoulder widths on the vehicle lane positions with different driving conditions. On one hand, results of the rANOVA showed that driving conditions had no significant main effect on lane position (F(1, 29) = 0.262; P = 0.613). It verified that there were no substantial differences between vehicle's lane positions or subject's awareness of vehicle maintaining, no matter if subject's speed was restricted. On the other hand, a significant difference among the five scenarios in terms of the vehicle lateral position was found (F(4, 26) = 22.590; P < 0.001). A contrast analysis (S-N-K method) further revealed that the average lane position in Expwy 2.5 was significantly lower than that in the other four expressways (P < 0.05 in all contrasts), and the average lane position in Expwy 0 was significantly higher than in the other four expressways (P < 0.05 in all contrasts) under the driving condition with speed limit. Similarly, the contrast analysis (S-N-K method) divided inside shoulder widths into four groups (P < 0.05 in all contrasts) under the driving condition without speed limit. The average lane position in Expwy 0 is statistically the highest, then the lane positions in Expwy 0.5 and Expwy 0.75, followed with the lane position in Expwy 1.5, and the lane position in Expwy 2.5 is the lowest. The test results suggested that the inside shoulder width had a statistically significant effect on vehicle lane position, no matter if vehicle's speed is restricted.
4. Conclusions and Recommendations
This paper revealed the impacts of the inside shoulder on vehicle operation. The empirical data, including speed and lane position of vehicles, were collected in a driving simulator. Analyses of the data revealed the following findings.
Inside shoulder width had some effects on vehicles' steady status speed profile, and the vehicle's speed would reach the maximum level when the inside shoulder widths were 0.75 m and 1.5 m. Yet the effect on vehicle's speed was not statistically significant in this driving simulation environment.
The lane position profiles had the same negative linearity trends no matter if subject's speed was restricted. The inside shoulder width had significant effects on vehicle's lateral position. More specifically, there was significantly negative linear correlation between inside shoulder width and lane position; that is, the average lateral position in Expwy 0 was the highest, while the average lateral position in Expwy 2.5 was the lowest.
5. Discussion and Future Research
The objective of this paper is to discuss the impacts of inside shoulder on vehicle operation (speed and lane position) on expressways in China. The experiment was performed in a driving simulator. Researchers can better control various factors in order to minimize confounding effects by driving simulator. Additionally, a driving simulation experiment is obviously safer than field study research, and data collection is usually easier. However, there are still some limitations with driving simulation experiment in the current study.
Some previous studies have stated that driving performance could be affected by age and gender. However, in this study, for the purpose of evaluating the impacts of inside shoulder on vehicle operation, a homogeneous group of subjects was recruited to avoid the bias resulting from other factors, such as gender or age. Besides, female drivers in China account for a small percentage of all licensed drivers [10]. Therefore, subjects were all relatively young male in this study. In the future, testing other categories of drivers (female and elderly subjects) will explore the impact of gender and age on effects of inside shoulder.
Data in this study were collected in a virtual scenario based on driving simulator. Furthermore, the impacts of inside shoulder in the real world must be tested and the effectiveness of driving simulator should be validated. Though some researches have validated the effectiveness of driving simulator used in this study [11, 12] and the subjective ratings indicate that the majority of subjects thought that the simulator was effective according to Table 2, the validation of the driving simulator should also be conducted through field tests in future research.
As mentioned previously, the analytical results of contrast analysis on lane positions between two driving conditions were not completely the same. When the vehicle was travelling at 120 km/h, the lane positions with different inside shoulder width were divided into three groups, while there were four groups under the driving condition without speed limit. The difference existed in the lane position of Expwy 1.5, whose inside shoulder width was 1.5 m. Such difference might be induced by speed limit. Under the driving condition with speed limit, vehicle's speed and lane position could be maintained at a stable level. However, if drivers were permitted to drive without speed limit, it was likely for drivers to drive at a speed more than 120 km/h. As is known to all, it is harder for drivers to maintain their vehicles at a stable status when the speed grows faster. Thus, the wider inside shoulder width can make drivers more confident and provide more lateral clearances for drivers to maintain their vehicles from running off the lane.
It is worth noting that this research took an eight-lane, two-way divided expressway as an example, revealing the impacts of different inside shoulders on vehicle operation. Apart from this, researchers can also evaluate the safety impacts of inside shoulder on drivers' physiological and psychological status as well as perception and driving performance. Thus, researchers can fully evaluate the safety impacts of inside shoulder from the perspective of drivers and vehicle operations. In future research, researchers will also focus on building the relationship model between inside shoulder width and the speed/speed variation, lane position, and drivers' physiological and psychological indicators, consequently providing recommendations for the desired and optimal inside shoulder width in terms of the model.
Conflict of Interests
The authors declare that there is no conflict of interests regarding the publication of this paper.
Footnotes
Acknowledgments
This research was supported by two NNSFC Grants no. 50908106 and no. 51108031. This research was also supported by the Open Project of Traffic Industry Key Laboratory of Road Traffic Safety Technology: Driving Simulator Experimental Research and Modelling of Impact of Inside Shoulder.