
Abstract
Battery system is the key part of the electric vehicle. To realize outlier detection in the running process of battery system effectively, a new high-dimensional data stream outlier detection algorithm (DSOD) based on angle distribution is proposed. First, in order to improve the algorithm stability in high-dimensional space, the method of angle distribution-based outlier detection algorithm is employed. Second, to reduce the computational complexity, a small-scale calculation set of data stream is established, which is composed of normal set and border set. For the purpose of solving the problem of concept drift, an update mechanism for the normal set and border set is developed in this paper. By this way, these hidden abnormal points will be rapidly detected. The experimental results on real data sets and battery system simulation data sets demonstrate that DSOD is more efficient than Simple variance of angles (Simple VOA) and angle-based outlier detection (ABOD) and is very suitable for the evaluation of battery system safety.
1. Introduction
In a world where environment protection and energy conservation are receiving extensive concerns, the development of electric vehicles has taken on an accelerated pace [1, 2]. Battery system technology is one of the critical technologies in electric vehicles, which is widely adopted in modern battery management system [3, 4]. With the popularization of electric vehicles, the safety performance of battery system has been attracting more and more attention.
Outlier detection is an important branch of data mining area. As the technology advances, a lot of applications will produce time sequenced, massive, and vertiginous data streams, such as E-commerce, network flow monitor, and wireless communication. The running condition of battery system will also produce such data. However, there are some additional characteristics in the battery system data, like high dimension, concept drift, and so on [5]. This makes it more difficult to evaluate the safety performance of the battery system and disturbs the normal running of electric vehicles. Therefore, finding effective methods of mining unsafe factors from massive data is a very important need.
Since the rise of outlier detection research, an increasing number of studies have been carried out in many famous research organizations and academic units, and they have achieved fruitful research results. In terms of statistic-based method, an outlier detection approach based on statistic for wireless sensor networks is proposed [6]. An improved online outlier detection method is proposed by Liu et al. [7]. However, the obvious disadvantage of this method is the poor generalization and that it is only suitable for one-dimensional data. Usually, outlier detection of data stream is needed in high-dimensional space. Generally speaking, the data model, distribution parameters, and the expected number of outliers should be given in advance in these approaches which are based on the statistic [8]. Nevertheless, the above parameters are hard to obtain.
As for distance-based method, Knorr and Ng [9] firstly proposed a simple and intuitive concept of outlier. The object is considered as an outlier if the distance between the current object and other neighbor objects is greater than a certain threshold. Ramaswamy and Rastogi [10] proposed a modified k nearest neighbor algorithm based on the distance. This approach takes the distance between an object and its k nearest neighbor as its outlier score and retrieves the top m objects having the highest outlier scores as the outliers. In order to obtain the k nearest neighbor distance of each object, the whole data set will be scanned once, which is the main defect of this method. In order to eliminate the drawback of k nearest neighbor, a lot of methods are proposed. For example, an approach based on the index and loop nesting is proposed to improve the efficiency of the algorithm and reduce the time of input and output, in which, as a consequence, the time complexity could be reduced heavily. Generally, the method based on distance is suitable for high-dimensional data sets. However, in order to obtain an outlier score, not only do many relevant parameters need to be set before but also the entire data set needs to be scanned frequently. Thus, a good performance of real time cannot be achieved from the method based on distance. For the data stream, it is meaningless.
In the part of density-based algorithm, Breunig et al. [11] proposed a local outlier detection method based on density. The concept of local is fully reflected, because each point has a corresponding abnormality value among which top point having the highest abnormality value will be marked an outlier. Based on Breunig's, a new abnormality judging standard to each object called MDEF is proposed by Papadimitriou et al. [12]. Actually, most of these methods implicitly rely on finding nearest neighbors for every object and typically use indexing data structures to improve the performance. In addition, it is generally known that the data point will become sparser with the dimension and the data size increasing, in which situation, almost all points are outliers. Therefore, the density-based methods are unsuitable for the outlier detection in high-dimensional space.
With regard to data stream algorithm, a mining approximate frequency item sets data stream based on hash and interest degree is proposed by Ju and Yin [13], the method has extensive application prospects. Muthukrishnan and Shah proposed an anomaly detection algorithm for large-scale data flow in the literature [14]. However, the approach can only handle low-dimensional numerical data and failed to take concept drift problem into consideration. A data stream detection method based on wavelet density estimation is proposed [15]. For data stream, on the one hand, the above algorithms may rely on the traditional algorithm excessively. On the other hand, they did not consider the use of high-dimensional situation or failed to solve the problem of concept drift.
According to the above description, we could find that all outlier algorithms proposed so far are inherently unsuitable for the requirements in mining high-dimensional data because they depend implicitly or explicitly on distances or density. Therefore, it is expected that the above questions can be resolved with a more robust approach. In order to reduce the security risk of the battery system and efficiently detect the hidden local outliers in massive data stream, a new outlier detection approach based on the angle distribution for high-dimensional data stream is proposed in this paper. In high-dimensional space, angles are more stable than distances as the dimensionality increases [16]. Besides, the angle-based method will not be substantially deteriorated in high-dimensional data set [17]. The experimental results show that DSOD algorithm efficiently alleviates the effects of “curse of dimensionality” and the problem of concept drift is well resolved. In addition, the computational complexity of the algorithm is obviously reduced.
2. Definition and Description
In this section, some relevant definitions of outlier, data stream, and battery system for safety evaluation will be introduced in detail. In addition, we will present how to utilize the angle-based concept to calculate the value of abnormality for each point.
The definition of battery system for safety evaluation is described as follows.
Definition 1. Identify, analyze, and eliminate potential safety hazards during running process in battery system, reduce safety risk of battery system to an acceptable level, and finally ensure the normal operation of electric vehicles.
Battery system is likely to produce some abnormal data for the disturbance of some unfavorable factors which may be for a long time. If these abnormal points can be detected by a more robust approach and an appropriate strategy is timely adopted subsequently, the operation risk of battery system will be greatly reduced. In this way, the safety of electric vehicles can be highly guaranteed.
Generally speaking, let A = (A1,A2,…,A k ) denote the attribute set in Euclidean space; S = (A1 × A2 × ⋯ × A k ) indicates the corresponding k-dimensional space.
Definition 2. Data stream
Hawkins [19] has given a classical outlier definition.
Definition 3. An outlier is an observation that deviates so much from other observations so as to arouse suspicion that it was generated by a different mechanism.
The angle-based concept was given by Kriegel et al. [20], by which the degree of abnormality for each point in data set can be accurately evaluated.
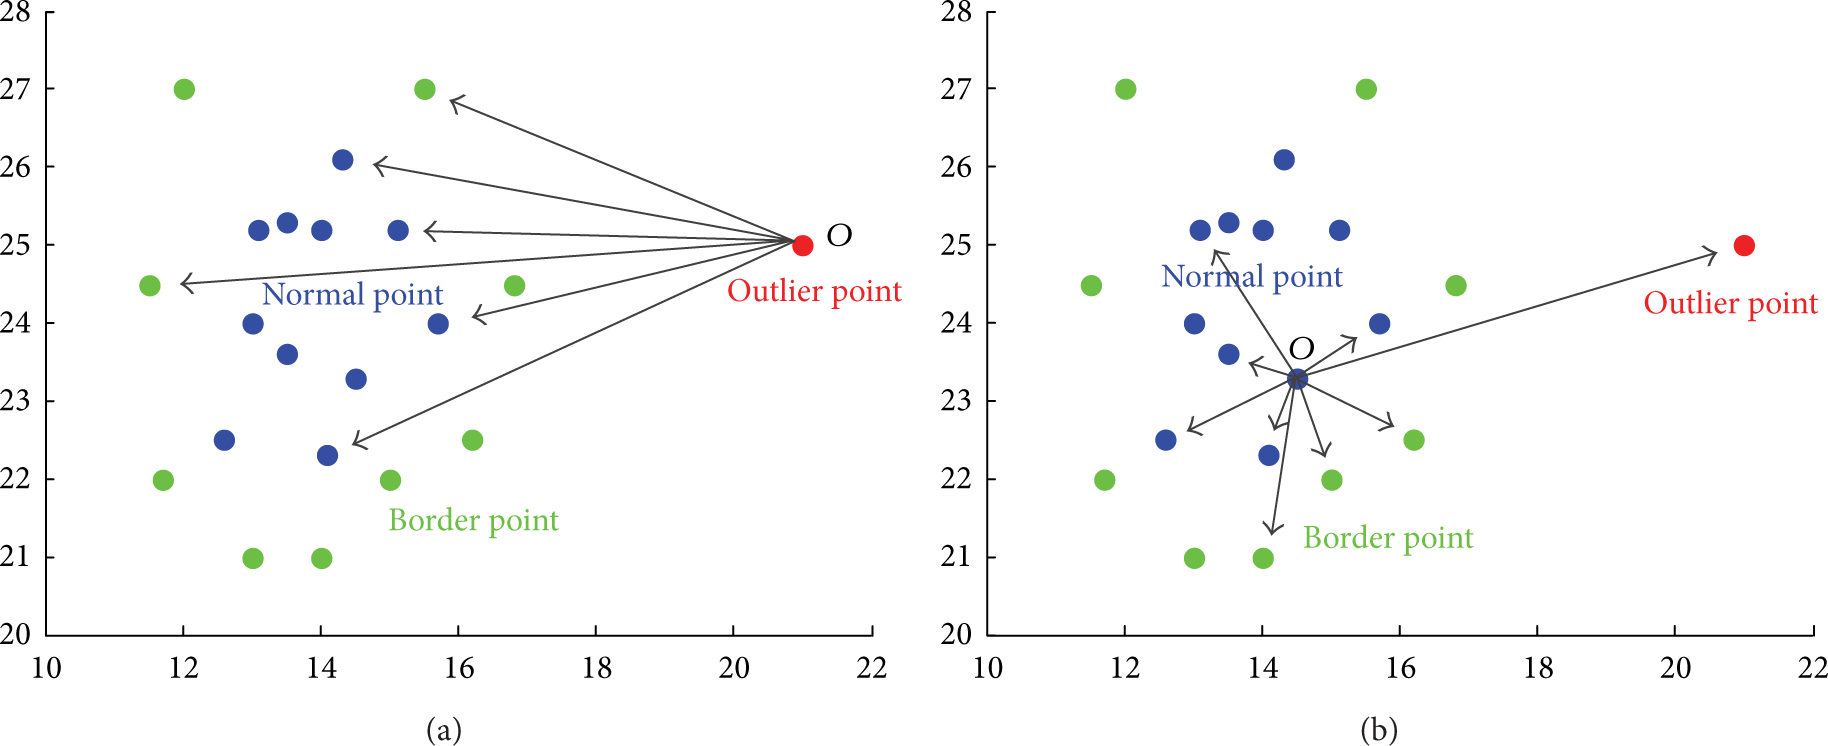
Consider a two-dimensional data set whose distribution is illustrated in Figure 1. From Figure 1(a), we can find that point O deviated from the data set. Supposing there are angles composed of point O and other two different points from data set, these angles do not have obvious difference because other points are located in similar directions with point O. Thus, the fluctuation of these angles is relatively small, as well as the variance of point O. Therefore, a conclusion can be drawn that the smaller the angle variance of a point to the residual points is, the more likely it is to be an outlier.
Distribution of data set.
As shown in Figure 1(b), point O is inside the data set. Similarly, suppose there are some angles whose vertex is point O. Different from Figure 1(a), these angles have significant differences for the location of other points in varying directions. Thus, the considerable fluctuation ultimately leads to a large variance of point O. Therefore, an opposite conclusion can be summarized that the larger the angle variance of a point to the residual points is, the more likely it is to be a normal point.
As mentioned above, it is reasonable to infer that the variance of border point falls in between. Therefore, the method based on angle variance can be employed to estimate the degree of abnormality for each point. In this way, we believe that the three classes points, outlier point, normal point, and border point, can be better distinguished from each other.
Based on the above idea, the definition of angle-based outlier factor is proposed by Pham and Pagh [17]. In this way, the angle variance of each point could be accurately evaluated. The main content is presented as follows.
Definition 4. Given a point set S⊆R d , |S| = n, and a point p ∈ S. For a random pair of different points a,b ∈ S∖{p}, let Θ apb denote the angle between the difference vectors a − p and b − p. The angle-based outlier factor VOA(p) is the variance of Θ apb :

where MOA2 and MOA1 are defined as follows:


It is obvious that the VOA measure is entirely free of parameters and therefore is suitable for unsupervised outlier detection method.
3. Proposed Algorithm in Detail
Data stream outlier detection algorithm requires real-time and accurate feedback information, which will help to obtain the real-time working condition of battery system. In order to make our algorithm have good performance, such as good stability, high speed, and accuracy, a new high-dimensional data stream outlier detection algorithm (DSOD) based on angle distribution is proposed in this paper. In this section, firstly, we will introduce the main idea of proposed algorithm. Then, the algorithm processes and program chart are given for a better understanding. At the end, the pseudo code of core process is presented.
3.1. Algorithm Idea
(1) Using angle distribution-based method obtains the high-dimensional time-varying distribution of normal points, border points, and outlier points, in order to improve the stability of algorithm in high-dimensional Euclidean space.
(2) Build a small-scale calculation set for normal set and border set, so that we can raise computation speed of algorithm. Generally speaking, traditional detection algorithm for static data set has a common drawback that with the dimension and data size increasing, the amount of computation is increasing exponentially. In order to solve this problem, a smaller-scale computation set is established, and only when data point has reached the calculation set the analysis is performed. By this way, the computational complexity of the algorithm is obviously reduced.
(3) Use the formulas (1), (2), and (3) to analyze each data point, so that we can obtain their corresponding outlier factors. In addition, an update mechanism for the normal set and border set is built, which will help us to deal with concept drift problem. In this way, the accuracy of the algorithm is guaranteed.
Through the above measures, we confirm these typical problems can be efficiently resolved, such as data distribution, computational complexity, and concept drift.
3.2. Algorithm Processes
The specific processes are described as follows.
Input. The latest data element X(i).
Output. Outlier set O.
Step 1. The preprocessing of data stream: construct a high-dimension sample set X which consists of a number of data elements.
Step 2. Using formulas (1), (2), and (3) to analyze each data element in the set: in this way, their corresponding VOA can be obtained.
Step 3. Using the preset threshold to divide all the data elements into the normal set, border set, or outlier set: at this point the initial set of normal and border have formed.
Step 4. Get the latest data element X(i). Construct a smaller-scale calculation set which consists of X(i), normal set, and border set.
Step 5. Using formulas (1), (2), and (3) to analyze X(i) and obtain the outlier factor VOA of this element.
Step 6. Using the pre-set threshold to determine the destination of X(i): in other words, there is the possibility that X(i) belongs to the normal set or the border set. If X(i) is an outlier, this data element will be added into the outlier set and output at the same time.
Step 7. Detect whether there is an overflow phenomenon in the normal set or border set in real time. If an overflow has occurred, the normal set and border set will be updated by FIFO.
Step 8. Get the latest data element X(i). Repeat Step 4 to Step 8.
In order to express our screening method more intuitively for each data element, the corresponding flow from Step 4 to Step 8 is given in Figure 2. As shown, the VOA1 and VOA2 are the pre-set thresholds of the normal set and border set, and VOA is the angle-based outlier factor of the data element X(i).

Algorithm process.
3.3. Pseudo Code
As described in Section 3.2, Step 5 is the key part of our method. By Step 5, the abnormality factor VOA(P) of the latest data element can be quickly and accurately obtained.
The corresponding pseudo code is presented in Algorithm 1.

Angle (S,n).
First of all, considering the latest data p as a given point, in addition, find out a random pair of different points a, b from calculation set. Thus, an angle which consists of the difference vectors
So far, we confirm that the algorithm we proposed is successfully implemented on the outlier detection of data stream.
4. Experiments
To analyze the performance of the proposed approach (DSOD), several tests were conducted in this section. In order to compare the efficiency and effectiveness of the algorithm, ABOD [20] algorithm and the Simple VOA [17] algorithm were selected as the comparison algorithms, because both of them apply the ideas based on angle distribution. A distinct advantage of comparison algorithms is that they are not requested to set any parameters. However, they are the traditional detection algorithms for the whole static data set. Our experiments were conducted on an Intel 2.0 GHZ Windows platform with 2 GB RAM, and all algorithms were implemented in Matlab.
Two types of data sets are adopted. One is the real data sets, Isolet and the Multiple Features, which are from UCI machine learning repository. The other is the simulation data sets of battery system coming from the real-time acquisition in our battery simulation system.
To measure the capability of each algorithm, the operation speed and precision are applied. The precision of algorithm is defined as follows:

where Number of real outliers is the number of retrieved points that are indeed outliers. |Outlier| is the number of retrieved points that are likely outliers. Precision is the proportion of Number of real outlier and |Outlier|. Besides, we retrieve the most likely outlier until all the real outliers are retrieved.
4.1. Isolet Data Sets
Isolet contains the pronunciation data of 26 letters of the alphabet. Because of their similarity, the classes C, D, and E belong to E-set. In order to test the processing power of concept drift, a total of 390 data points are picked from classes C, D, and E as normal sample set, and merged in a certain order. Moreover, a total of 10 data points are picked from class Y as outlier sample sets and are inserted into normal sets. Each data point of the above is 100-dimension.
In Figure 3, it is shown clearly that DSOD has great advantages in running time, which is more advanced than ABOD algorithm and Simple VOA algorithm. In these detection algorithms, which are designed for static and large data set, there are thousands of possibilities about their angles which consist of a given point and any random pair of points in data set. Moreover, the entire data set needs to be traversed once when outlier factor of each data point is obtained. Therefore, a high computational complexity leads to a poor efficiency. On the contrary, in order to reach the requirement of quick processing data points in large data sets, DSOD adopted a small-scale calculation set and only the latest data point is analyzed. By this way, the efficiency of DSOD is greatly improved.

Running time of algorithms.
To obtain the optimal threshold of normal set and border set, the feature of real data sets is analyzed and a lot of experiments are performed in this paper. It should be noted that different algorithm accuracy is determined by the different threshold of normal set and border set. In general, each data set corresponds to a property, which corresponds to a set of optimal normal threshold and border threshold. A good accuracy will be offered by the DSOD algorithm if the best threshold has been designed.
Algorithm precision is shown in Figure 4. Because angle is relatively stable in high-dimensional space, so Simple VOA has a good precision. In addition, we can see that the precision of DSOD is between Simple VOA and ABOD. There are two reasons. First, the size of calculation set is limited, so the accuracy of algorithm is affected more or less. Second, local outliers are detected because the data concepts are changing all the time. Nevertheless, ABOD does not take the variance of angles directly but takes the variance of cosine of angles weighted by the corresponding distances. We argue that weight factors are meaningless in high-dimensional data due to the dimensionality disaster. Therefore, the precision of ABOD is relatively poor.

Precision of algorithms.
4.2. Multiple Features Data Sets
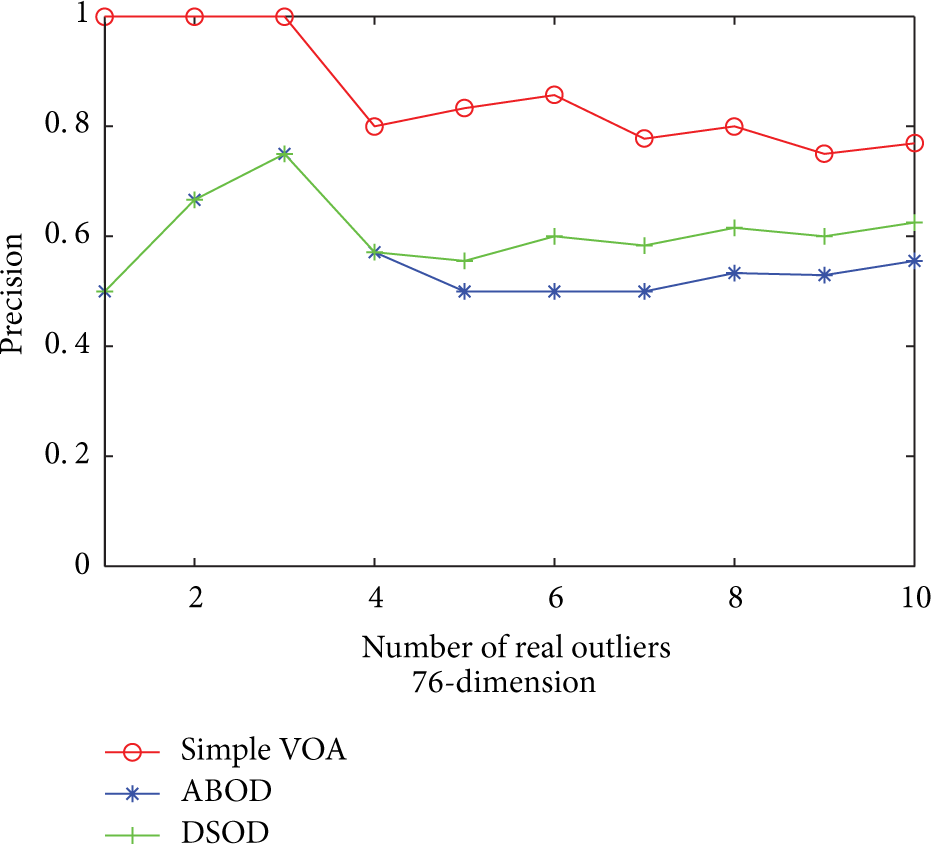
Multiple Features consists of the data of handwritten numerals (“0”–“9”). The classes 6 and 9 have some similarities. Therefore, a total of 390 data points are picked from classes 6 and 9 as normal sample sets. In addition, a total of 10 data points are picked from class 0 as outlier sample sets and are inserted into normal sample sets, where each data point is 76-dimension.
Figure 5 shows DSOD is far ahead than other algorithms in running time. The result shows the technology which adopted a small-scale calculation set is very useful to reduce the computational complexity. Obviously, compared with DSOD, traditional detection algorithms based on static data set suffer from the great overhead in both time and memory. As indicated in Figure 6, it is obvious that DSOD still proves to do pretty well in accuracy. In the situation where the above test samples are the mixed data, a good precision can still be obtained, which proved DSOD has a good performance to deal with the problem of concept drift. From Figures 5 and 6, it is clear that Simple VOA has the highest accuracy, but its efficiency is the lowest. For ABOD, it is not only inefficient but also accompanied with the lowest precision.

Running time of algorithms.
Precision of algorithms.
4.3. Battery System Simulation Data Sets
To obtain the battery system simulation data sets, we constructed a software simulation platform for hybrid electric vehicles (HEV). First, we analyzed the working principle of the HEV. Second, according to the system theory of power battery, a power battery system model based on the nonlinear time-varying is established, which consists of nonlinear time-varying power battery model, battery management model, sensor model, and other major models. Finally, we integrated the vehicle model with other controller models and established a simulation platform of HEV.
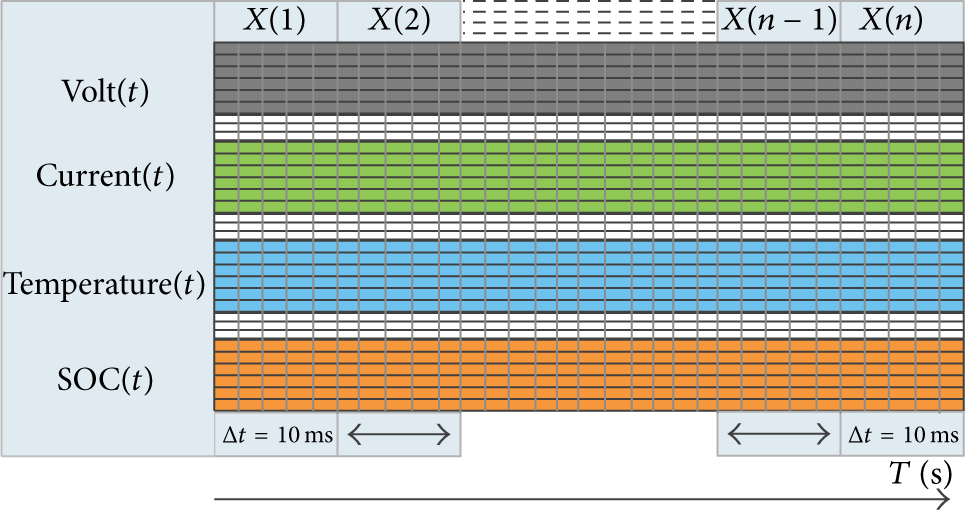
Based on the obtained virtual platform, the normal data sets will be acquired when the working conditions (ECE and EUDC) are added to the virtual platform. The normal sets consist of the voltage, current, temperature, state of charge, and other physical quantities [21–23]. In general, 10 ms is regarded as a sampling period for battery system. In addition, considering the computational complexity of static detection algorithms, the output data of battery system is collected one thousand times. In this way, we obtained the normal sets X(t) which are continuously changing. The detailed process is shown in Figure 7.
Sample time series.
It is well known that some hidden dangers which possibly appear in the running process of battery system, such as the volt and current, cannot be accurately collected, which will bring negative effects to the normal operation of battery system. In order to simulate the above hidden dangers, we changed the sampling values of a data point, such as the voltage, current, or all the physical quantities, so as to deviate this data point away from other groups. Based upon the presented method, a total of 10 outliers are designed, and these outliers are inserted into the normal set. By this means, the simulation data sets can be obtained. It should be noted that the quality of simulation data sets is better than the Isolet and Multiple Features data sets.
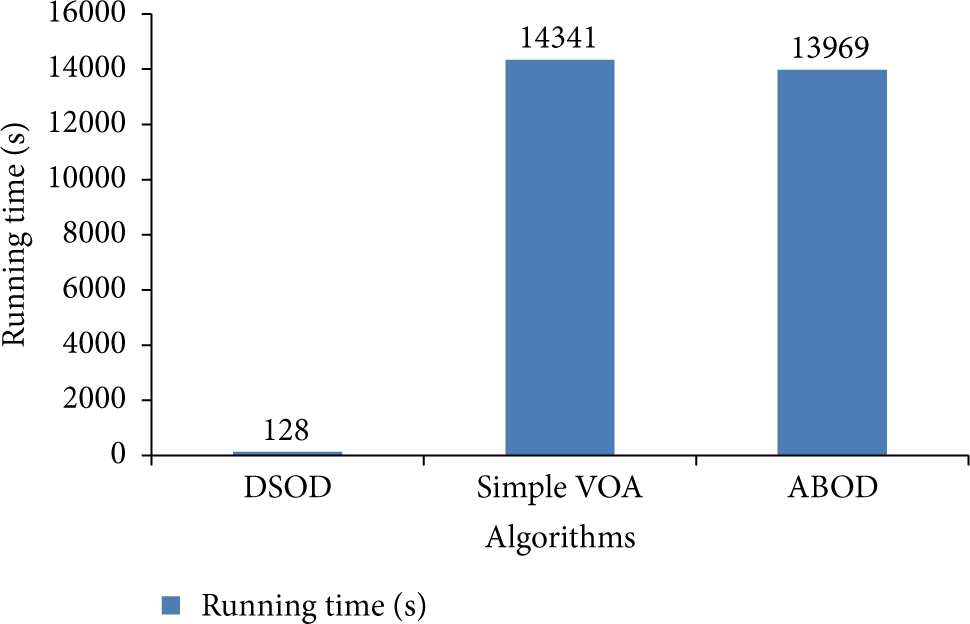
Figure 8 shows the running time of different algorithms. It is clear that DSOD has the lowest computational complexity, and the time overhead takes up about only 1% of the Simple VOA and ABOD. Moreover, we can find that the time overhead of Simple VOA and ABOD is larger and larger with the sample size increasing. It is unacceptable to these applications which have some requirements, such as real-time and high efficiency.
Running time of algorithms.
In Figure 9, it is clear that the accuracy of all the algorithms has been improved; this result is closely related to the simulation data sets. For the Isolet and Multiple Features data sets, not only is the dimension of the data very high, but also the distribution of data is not uniform in the high-dimensional space. On the contrary, for the simulation data sets, the dimension is relatively low, and its quality is better than the previous data sets. We argue that the accuracy level of algorithm is closely related to the quality of data.

Precision of algorithms.
Combining Figures 4, 6, and 9, we can obtain a conclusion that no matter whether the size of sample dimension is high or not, Simple VOA always has a good precision. However, it is static data set oriented and is only suitable for the global outlier detection. Different from the Figures 4 and 6, ABOD has a good precision in the low-dimensional data set because compared with the influence of distance, the function of angle is more significant in low dimension. In other words, the weight of the angles is strengthened. In addition, compared with Simple VOA, ABOD is more effective in local anomaly detection.
From Figure 9, we could find that DSOD obtained a relatively high accuracy. This result is benefited from the method of angle variance. However, it is inevitable that the accuracy will decrease due to the size of small-scale calculation set of data stream is limited. In addition, compared with the two methods mentioned above, DSOD is more easily mining some unsafe factors due to the continuous changing of test data.
In summary, the test results indicate that DSOD has higher efficiency and accuracy than traditional detection algorithms, which created a condition for normal operation of battery system. Therefore, the method is valuable for the evaluation of battery system safety.
5. Conclusion
In this paper, we introduced a high-dimensional data stream outlier detection algorithm based on angle distribution. By using the idea of angle distribution, the degree of abnormality of each data point in the data steam could be timely and accurately obtained. In addition, a small-scale calculation set which has reasonable size is established. The computational complexity of algorithm can be greatly reduced by this method. Moreover, an update mechanism for the normal set and border set is built. By this means, the problem of concept drift can be effectively solved. The experimental results on real world data sets and battery system simulation data sets demonstrate that our method is effective for the evaluation of battery system safety. For future work, in order to better improve the algorithm performance, we plan to make more effort on the adaptive threshold.
Conflict of Interests
The authors declare that there is no conflict of interests.
Footnotes
Acknowledgments
This work is supported by the Natural Science Foundation of China (NSFC no. 11247325) and Natural Science Foundation Project of CQ CSTC (CSTC2013yykfC60005, CSTC2011BB4145, CSTC2013jcsf-jcssX0022).