
Abstract
In order to study the influence that dynamic performance of shift control valve has on shifting process of construction machinery, the paper introduces working principle of the shift control valve and sets up the dynamically mathematical model and corresponding simulation model with simulation software LMS Imagine. Lab AMESim. Based on simulation, the paper analyzes the influence of pressure variation characteristics and buffering characteristics acting on vehicle performance during the process of shifting, meanwhile conducting experiments to verify the simulation. The results indicate that the simulation model is accurate and credible; the performance of the valve is satisfactory, which indeed reduces impact during shifting. Furthermore, the valve can meet the demand of other construction machineries in better degree by suitable matching between control spring stiffness and damping holes diameter.
1. Introduction
In recent years, the transmission case (transmission) with power shift valve, because of its low cost and simple operation, is increasingly being used in the construction machinery industry [1, 2]. However, the practice experience shows that shift shock and power disruptions potentially occur during shift process, due to harsh working environments, heavy amount of work, and frequent shift, which seriously affected the construction machinery reliability. Thus, ride comfort of (smooth) shift gets more and more attention to the construction machinery industry [3–6]. The dynamic characteristics of shift control valve, which is a crucial component for the transmission system, greatly influence vehicle handling, smooth-shift, and vehicle security. But until now the study about the dynamic characteristics of shift control valve relatively lacks, which needs further study. This paper puts a certain type of loader as the research object and establishes the shift control valve HCD (hydraulic component design) simulation model based on the simulation software AMESim. Further, the paper comprehensively analyzes the dynamic characteristics of shift control valve in the way of the combination of simulation and experimental validation, which provides a reference for the loaders shift control system design and study [6–9].
2. The Theoretical Analysis of Shift Control Valve
2.1. Operating Principle of Shift Control Valve
Shift control valve as the operating component of power shift system is composed of reversing valve and cushion valve, which can achieve the operation to five working conditions of the transmission case, including neutral, first forward, second forward, first reverse, and second reverse gears. The hydraulic schematics, as shown in Figure 1, indicate that the output pressure of gear pump remains 1.2 MPa under the operation of sequence valve. The schematics also show that there is no cushion valve in the oil passage of forward and reverse gears, while the oil passage of first and second gears have one, which is located behind the reverse valve. When the transmission case stays in the state of neutral gear, the system provides oil for the hydraulic torque converter through sequence valve. When the transmission case stays in the state of first or second gears, the oil of system has to primarily pass reverse valve and sequence valve, which prolongs the settling time of the system pressure to a certain extent, therefore achieving shift buffer.

The hydraulic scheme.
The actual structure of shift control valve is shown in Figure 2; scheme of shift clutch layout is given in Figure 3, whose cushion process is composed of four stages. Pressure variation of the process is shown in Figure 4. The relationship of shift process and solenoid is shown in Table 1.
The initial oil-filled stage (a-b): during the stage, the clutch is in the empty run; meanwhile the control oil gets in the clutch cylinder and overcomes the restoring force of the spring of clutch cylinder, which causes the gap between clutch master and slave chips to be eliminated.
The initial oil pressure setup stage (b-c): when the pressure continues to increase, the large spool continues to move to the left and gradually decrease the opening area of the valve port leading to clutch cylinder, which causes the oil of pressure clutch cylinder to start increasing. During this stage clutch master and slave chips come into contact.
Oil pressure boost stage (c-d): when the oil pressure continues to increase, the cushion valve starts to work and the orifice of small spool starts throttling. Meanwhile, the big spool and the storage chamber simultaneously operate, which causes that the clutch cylinder pressure and output torque smoothly increase until the clutch is fully jointed the cushion process ends.
Oil pressure step-increase stage (d-e): during the stage, the joint process between clutch master and slave chips has finished, and pressure of clutch cylinder rapidly rises to the oil pressure of system.
The relationship of shift process and solenoid.


Scheme of control valve.

Scheme of shift clutch.

The pressure process of cushion valve.
2.2. Mathematical Model
The paper conducts the theoretical derivation for pressure change characteristics in the oil pressure boost stage based on shift control valve structure [10, 11].
The force balance equation of large spool is

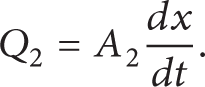
The flow rate via valve port of large spool is

The flow balance equation of orifice is
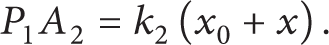
The force balance equation of storage piston
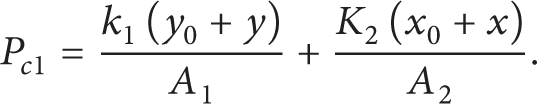
Statics equation from simultaneous equations (1)–(4) is
The equation for cushion time from simultaneous equations (1)–(4) is
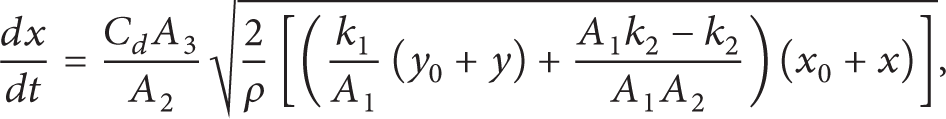
where, Pc1—cushion pressure, MPa; y—displacement of control spring, mm; y0—original length of control spring, mm; A1—big spool end area, mm2; A2—storage spool end area, mm2; A3—the area of the orifice, mm2; x—displacement of storage spring, mm; x0—original length of storage spring, mm; P1—bearing area of storage spool, MPa; Q—through-flow of orifice, mL; k1—the stiffness of control spring, N/mm; k2—the stiffness, N/mm.
Based on the formulas (5) and (6), the paper identifies impact factors that determine the output pressure characteristics of shift control valve, which means a more reasonable matchup can be obtained by adjusting impact factors on the basis of requirement.
3. AMESim Simulation Model
Currently when it comes to the study of dynamic characteristics of shift control valve, the simulation method mainly focuses on the use of MATLAB/Simulink. But the existing method is too dependent on theoretical derivation in modeling process, which leads to the overlooking of some detailed factors in order to improve simulation speed [12, 13]. However, the simulation of fluid has a strict requirement of details so that the MATLAB/Simulink simulation method is not adaptive for hydraulic simulation to a certain extent. Therefore, the paper puts forward the study of dynamic characteristic of shift control valve based on AMESim simulation platform [14, 15].
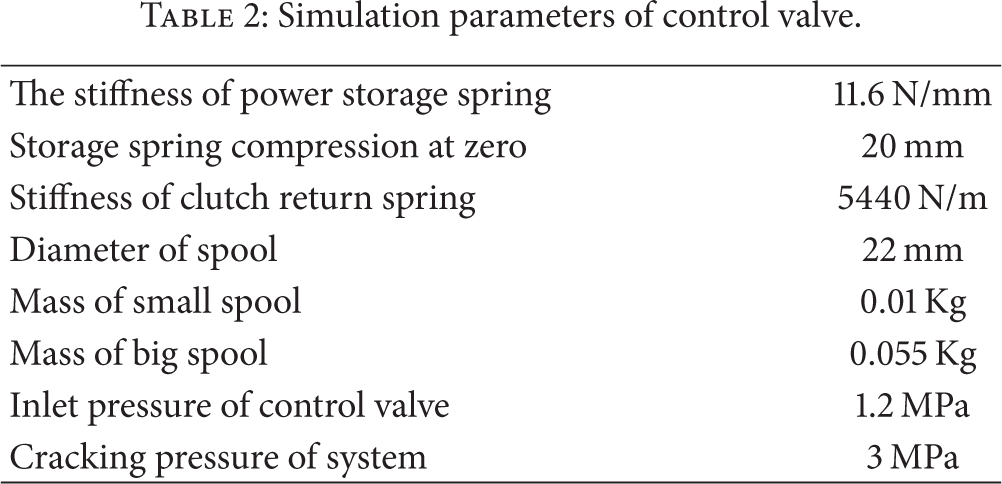
The paper puts forward the HCD (hydraulic component design) simulation model shown in Figure 5. The involved parameters of simulation model are identified on basis of the actual structure dimensions of the valve, and other parameters setting is based on operating conditions of working system, which are shown in Table 2.
Simulation parameters of control valve.

The simulation model of control valve.
4. Analysis of Simulation Results
The evaluation of shift control valve performance mainly lies on the dynamic characteristics of the clutch control pressure during shift process. The clutch control pressure characteristics are closely associated with the structural parameters of the cushion valve. More reasonably dynamic characteristics can generate a more well-pleasing control performance, which means the reduced impact of the shift process. According to the complexity of changing the actual structure of the valve, the paper mainly analyzes the influence of these parameters on the dynamic characteristics of the clutch control pressure, including orifice diameter, stiffness of control spring, and stiffness of power storage spring.
4.1. The Orifice Diameter
The paper obtains a series of dynamic characteristics of the clutch control pressure using AMESim batch function on the condition that orifice diameter varies from 0.9 mm to 1.3 mm; meanwhile other simulation parameters remain unchanged. Make sure that first gear is in the state of work only, and the simulation results are shown in Figure 6.

Clutch pressure curve of different orifices.
From the simulation results shown in Figure 6, the shift buffer time increases and curve gradient decreases along with the decrease of orifice diameter. However, the increase of shift time leads to more severe clutch friction, which may shorten clutch's lifespan. Therefore, the orifice diameter should be determined according to the specific circumstances.
4.2. The Stiffness of Power Storage Spring
The power storage spring stiffness is 11.6 N/mm via measurement. The theoretical analysis indicates that the variation of stiffness of power storage spring can influence the dynamic characteristics of the clutch control pressure, so that the paper conducts the batched analysis for the stiffness. The batched stiffness parameters are as follows: 9 N/mm, 10 N/mm, 11.6 N/mm, 13 N/mm, and 14 N/mm; meanwhile other parameters remain unchanged. Make sure that first gear is in the state of work only, and the obtained pressure curves are shown in Figure 7.

Clutch pressure curve of different spring stiffness.
The results indicate that the variation of stiffness of power storage spring has a slight influence on the buffer time, while a measurable impact on pressure curve gradient, which shows pressure curve gradient, gradually increases with the increase of the stiffness.
4.3. The Stiffness of Control Spring
The paper conducts the batched analysis for the stiffness of control spring. The batched stiffness parameters are as follows: 3500 N/m, 4500 N/m, 5440 N/m, 6500 N/m, and 7500 N/m; meanwhile other parameters remain unchanged. Make sure that first gear is in the state of work only, and the obtained pressure curves are shown in Figure 8.
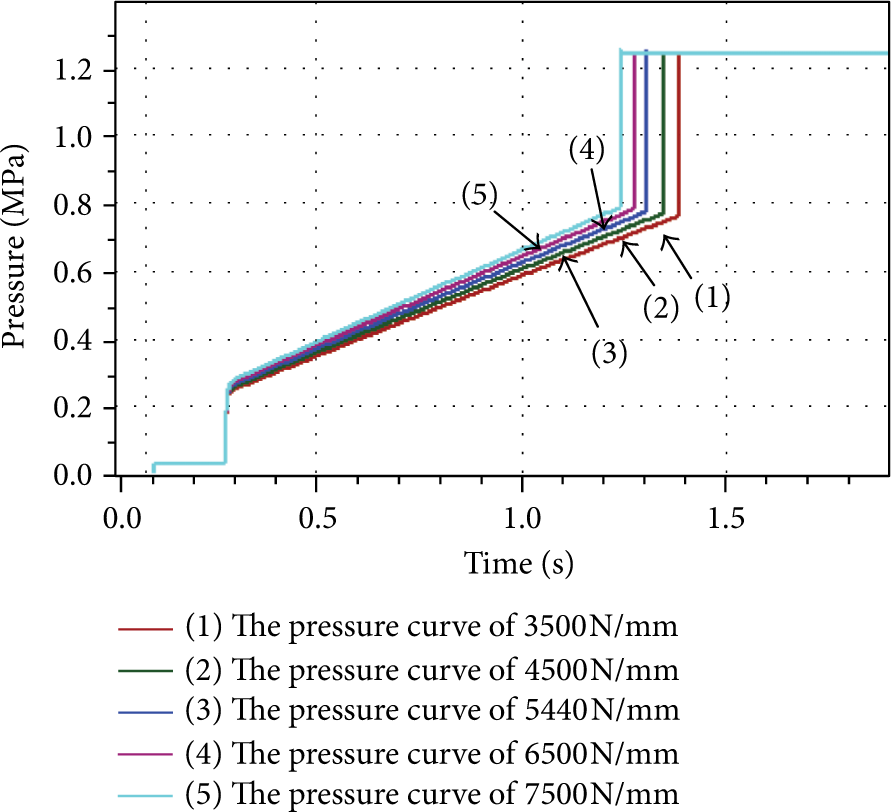
Clutch pressure curve of different control spring stiffness.
The results in Figure 8 show that the shift buffer time is shortened along with the increase of stiffness of control spring. Meanwhile, pressure curve gradient gradually increases along with the increase of the stiffness.
5. Experiments and Results Analysis
To verify the correctness of the theory and simulation analysis, the paper designs the correlated experiments in shift process, which takes a certain type of small-sized loaders as experimental subjects. The experimental tests direct at the buffer pressure characteristics and shift quality of shift control valve. The measure points are, respectively, set at the inlet of shift control valve, the inlet of clutch with first gear, the inlet of clutch with second gear, the inlet of clutch with forward gear, and the inlet of clutch with reverse gear. The used sensors are pressure sensors, whose measuring range is 0~7 MPa.
5.1. No-Load Working Condition with Idling
Test conditions set: experimental prototype load, the engine idling. The prototype manipulating process: engage the first gear, launch the prototype with the first gear, run about 10 seconds then switch to the second gear, run about 10 seconds, apply the brake, and shut down engine. The tested control pressure curve of clutch is shown in Figure 9.

Clutch pressure curve of no-load working condition with idling.
The tested curve indicates that the first gear needs 0.65 s to finish the whole process from launching at 18.4755 s to complete jointing at 19.1335 s, which means that the buffer time of first gear is 0.65 s. Meanwhile, the second gear needs 0.7 s to finish the whole process from launching at 26.95 s to complete jointing at 27.65 s, which means that the buffer time of first gear is 0.7 s.
5.2. No-Load Working Condition with High-Speed
Test conditions set: experimental prototype load, the engine rev at 2400 rpm. The prototype manipulating process: engage the first gear, launch the prototype with the first gear, run about 10 seconds then switch to the second gear, run about 10 seconds, apply the brake, and shut down engine. The tested control pressure curve of clutch is shown in Figure 10.

Clutch pressure curve of no-load working condition with high-speed.
The tested curve indicates that the first gear needs 0.6 s to finish the whole process from launching at 4.915 s to complete jointing at 5.4935 s, which means that the buffer time of first gear is 0.6 s. Meanwhile, the second gear needs 0.65 s to finish the whole process from launching at 12.472 s to complete jointing at 11.8 s, which means that the buffer time of first gear is 0.65 s.
The comparison of the clutch control pressure curves indicates that the dynamic characteristics of pressure in different conditions have same trend. However, the high-speed working condition needs shorter time than the idling working condition with a larger span range of speed change, which means that the high-speed working condition faces a more severe shift impact than the idling working condition.
6. Optimization and Improvement
The above analysis indicates that the reasons causing shift impact include the following. First, the shift buffer time is too short. Second, pressure curve gradient is too large. Change the orifice diameter of the valve from 1 mm to 0.7 mm in order to optimize the dynamic characteristics of the clutch control pressure. The optimized curve in the no-load condition with high-speed is shown in Figure 11.

Clutch pressure curve of the changed orifice diameter.
The optimized curve indicates that the buffer time has been extended to a certain extent. However, the pressure of starting point of buffer stage is still too low, and pressure curve gradient is also too low. Increase the stiffness of the control spring in order to further optimize. The optimized curve is shown in Figure 12.

Clutch pressure curve of the changed control spring stiffness.
The comparison between the further optimized curve in Figure 12 and the one in Figure 11 indicates that further optimization enhances the pressure of starting point of buffer stage, which means that the efficiency of the joining has been improved. Meanwhile, the curve gradient of buffer stage is lower which means that the smoothness of the joining has been improved.
According to the practical feelings coming from drivers, the prototype truly improves the shift smoothness, and the shift delay time is also shortened, which also indicates that the shift quality gets effectively improved.
7. Conclusion
The paper studies the composition and principle of the shift control valve and establishes the corresponding AMESim HCD model. Meanwhile, the paper amply analyzes the influence of the main structural parameters on the shift control pressure, which provides a theoretical basis for further study of static and dynamic characteristics of the valve.
In order to improve the shift impact performance of the experimental prototype, the paper optimizes the relative structural parameters including orifice diameter and control spring stiffness of shift control valve. The corresponding experiments testify that the optimization effectively improves the shift quality of experimental prototype, which provides a reference for that shift cushion valve design and optimization, meanwhile testifying the practical function of AMESim simulation in dynamic analysis of hydraulic components.
Conflict of Interests
The authors declare that there is no conflict of interests regarding the publication of this paper.