
Abstract
This integrated numerical and experimental study intends to enhance the performance of an in-line fan with the implement of the guiding vane and the tail body. At first the flow flied associated with the original in-line fan is simulated and analyzed within the framework of CFD code Fluent, in which the finite volume method is applied. Next, the guiding vane is constructed based on the calculated flow characteristics, and attached in the downstream of rotor to smoothen the flow pattern. An appropriate guiding vane with high-performance and low-noise features can be achieved after several design iterations. In addition, the tail body connected to the motor is introduced for further enhancing the fan performance by reducing the sizes of wake and reversed flow behind the hub. Thereafter, to manufacture the mockup for experimental verification, the modified fan with guiding vane is plotted in the CAD/CAM format for mockup fabrication via the rapid-prototype technique. Moreover, a set of relations correlating the performance and noise of this fan prototype are executed inside AMCA test chamber and semianechoic chamber, respectively. Consequently, the feasibility of design scheme and numerical system can be verified according to these experimental results. In summary, this work provides a systematic scheme for designing and analyzing the in-line fan.
1. Introduction
In-line fans, also called axial-centrifugal fans or tubular centrifugal fans, are used extensively in the duct work for their advantage of easy installation in the pipe system as the axial-flow fan. At the same time, they generate bigger static pressure than the axial-flow fans of the same rotor diameter and rotational speed, even though they are not as much as centrifugal fans. In general, their efficiencies are inferior to those of axial-flow and centrifugal fans. Thus, the demand on the performance enhancement of in-line fan exists and motivates this research.
In-line fan is, also called axial-centrifugal fans or tubular centrifugal fans, composed of a centrifugal impeller installed inside a cylindrical, barrel-shaped, or even square housing. Thus, the generated static pressure is higher than that of axil fan, while inlet and outlet flows are in the same axial direction. The above features fit with the need for transporting flow in a pipe line perfectly. However, the outflow at the centrifugal wheel is in the radial diction after a 90° turn at the wheel inlet; so another 90° turn is needed to bring it back to the axial-flow direction. This extra 90° turn results in the unfavorable flow patterns and downgrades the fan efficiency significantly. To compensate these drawbacks, a guide vane is attached after the centrifugal wheel for smoothing this direction transition and improving the efficiency. Moreover, a backward-inclined centrifugal rotor is usually used for enhancing the static-pressure gain for covering the system resistance in the pipe line. Nevertheless, user's request on the compact housing makes the designs of barrel-shape housing and the guide vane very difficult. Thus, the challenging design task induced by this complicate flow pattern becomes the topic and motivation of this research paper.
The famous textbook on fan by Eck [1] introduced the characteristics of different fan types and estimated their efficiencies using the related fan design parameters. He also set a solid foundation for turbomachines by deriving the relation of energy transfer between fluid and impeller. Regarding the fan design scheme, Lin and Tsai [2–4] utilized an inverse cascade method to design centrifugal and axial-flow fans. The velocity triangles are calculated with the inputs of operating condition, specified axial velocity, and head distribution. Thereafter, the appropriate airfoil shapes and chord lengths were selected to fit the input operating conditions. To validate this inverse design method, the mockup of designed fan was manufactured by the CNC machine to carry out the performance test. With the above experimental and numerical efforts, they established a systematic, reliable, and user-friendly design scheme for small fans.
Klujszo et al. [5] design several guide vanes for the air cleaner. The results show that the static pressure of air drops with increasing swirling motion while increasing turning angle; furthermore, a reduction on pressure drop is observed by setting a 60° turning angle to turn the flow gradually. Thakker and Dhanasekaran [6] carried out and examined the numerical simulation for the effect of guide vane shape. In this case, when vortex theory is applied to improve the efficiency, three-dimensional inlet and downstream guide vanes have been designed. As a result, CFD model can predict the experimental results accurately, and the efficiency of the turbine is improved about 4.5% by employed 3D guide vanes.
Wang et al. [7] analyses the effect of guide vanes, and the results show that vortex phenomenon appears at wall of guide vanes. While the vortex phenomenon appears, it not only decreases flow rate but also losses some kinetic energy. Furthermore, the proper setting angle of guide vane would improve these nonuniform conditions. Li and Quan [8] use different curvature of guide vanes by applied trimmed airfoil to increase efficiency of hydraulic turbine. The result shows that negative curvature guide vane improves the pressure distribution on both pressure side and suction sides. And a severe decrease on flow rate is observed for increasing its inlet angle.
Regarding the number of guiding vanes, Liou et al. [9] used the laser-Doppler velocimetry (LDV) to observe flow field in a side-dump combustor. In this study, they found that guide van can diminish the friction loss associated with flow separation of the no-vane case. Nevertheless, the guide-vane itself also introduces a friction loss by introducing more guide-vanes. Consequently, the one-vane case is identified to generate the minimum friction loss among all cases considered.
After carefully reviewing the previous literature, it is found that there is no comprehensive investigation on the guide vane and flow patterns on the in-line fan by means of both numerical and testing means together. Thus, this work integrates CFD, mockup fabrication, and experimental technique together to fulfill the need of this challenging task.
2. Experimental Setups of Performance Tests
To validate the numerical results, the performance curve and noise levels of an in-line fan are tested by the standard test procedures following AMCA 210–99 [10] and CNS-8753 codes [11], respectively. In this experiment, the fan speed is measured by a noncontact photo tachometer, which is accurate to 0.05% with a resolution of 1 rpm. The discharge static pressure is measured using a pressure transducer, and the flow rate can be calculated with the aids of differential pressure measured across multiple nozzles. Therefore, the measurement uncertainty of discharge flow rate and static pressure are mainly affected by the accuracy and calibration of the pressure transducer. Since the static pressure is very small for a typical fan, this study chooses a pressure transducer designed for exceedingly low differential pressure measurement applications. With full ranges below ±0.56 cm, the accuracy of this instrument was estimated to be within 0.25% full scale. Moreover, a precision pressure calibration system is used to calibrate this ultra-low-range pressure transducer with a resolution of 0.05 cm H2O and an accuracy of ±0.5% of reading. In summary, the uncertainty of the performance measurement was estimated to be around ±2.0%.
This experiment measures sound pressure levels using a RION NL-14 portable sound level meter (SLM) and an AND AD-3524 FFT frequency analyzer. The sound pressure creates analog electric signals in SLM microphone; these signals were then fed into the FFT analyzer to generate the noise characteristics. The noise at fan outlet is measured by employing the CNS-8753 standard. Additionally, the consistency and calibration of the above devices are checked by a piston phone (94 dB at 1000 Hz) both before and after a set of measurements. The lowest cut-off frequency is 125 Hz. The semianechoic chamber offers an appropriate test environment with 18±2 dBA background noise and a 2.8 m × 2.3 m × 2.05 m valid measuring size. The absorption rate of sound pressure for wedge is greater than 99%. The reflection of sound pressure for wedge is less than 10%. The inverse square law is valid between 125~20 kHz, and the deviation is ±1.5 dB. The transmission decay is larger than 35 dBA.
3. Numerical Scheme
To simulate the complex flow patterns inside the small in-line fan, the commercial software Fluent [12] is utilized to solve the fully three-dimensional incompressible Navier-Stokes equations with the standard turbulence model. Also, the modified SIMPLE method and Pressure-Implicit with Splitting of Operators (PISO) coupling method are implemented to speed up the efficiency of the pressure calculation. The PISO algorithm adopts additional corrections to satisfy the momentum balance more closely, especially for transient problems. The numerical calculation is executed with the moving reference frame (MRF) model to deal with the rotating fluid for an in-line fan. Then, the fan is evaluated for each operating point on the entire performance curve.
In this work, several appropriate assumptions and boundary conditions were made to simulate the actual flow patterns inside the fan. They are described as follows.
(1) Pressure Outlet Boundary Condition. The atmosphere is set as the boundary conditions at both inlet and outlet of fan to calculate the maximum airflow rate for the case of free-delivery condition.
(2) Mass Flow Inlet Boundary Condition. The mass flow rate of each operating point at outlet boundary surface is set for calculating the corresponding static pressure.
(3) Wall Boundary Condition. This numerical model sets the no-slip boundary condition on the solid surfaces of the fan.
(4) Moving Reference Frame (MRF). The numerical investigation deals with the rotating flow via the MRF in the CFD codes. The rotating wall surfaces are treated as stationary boundaries relative to rotating frame in this model.
In order to create a similar condition as test chamber, the ample inlet and outlet domains are adopted to provide a numerical measuring station and simulate the conditions of which the fan is expected to encounter. Besides, to correctly simulate the flow patterns of the in-line fan, the fine meshes are employed in the regions of rotor blades surface where acute flow variations occur. To minimize the error related to CFD model and grid number, it is necessary to establish appropriate numerical models for in-line fan and carry out the grid independence test. A fine grid is generated near the rotor region to accurately predict the physical phenomena, and to have a lower deformed geometry, tetrahedron grid is applied here.
4. Flow Analysis and Improving Alternatives
This analysis focuses on the aerodynamic performance of an in-line fan via an integrated effort of CFD and experimental technique. At first, the commercial CFD code (Fluent) is used to simulate and analyze the detailed flow pattern inside the original fan design (see Figure 1 and Table 1). Based on the reversed flows observed from numerical outcome, two design alternatives are proposed and evaluated by the corresponding simulations. In addition, the actual performance enhancement is validated by the experimental test on the CNC-fabricated mockup of the new design.
Dimensions and parameters of the original fan.


Geometry of the original in-line fan.
4.1. Flow Characteristics of the Original Fan Design
The purpose of effectively distributing the computing resources on the resolution of flow-field phenomenon, a fine grid distribution is used in the rotor region, and coarse grids are utilized in the inlet and outlet zones. Moreover, the grid independence test is applied for identifying the appropriate grid system. Figure 2 shows the calculated maximum static pressure and flow rate for several grid systems with different grid numbers, and each case has been run on an i5–2500K personal computer with 16 GB Ram for about 6,000 iterations; also, the convergence criterion is set as 10−3 and the residual number drops 4 to 8 orders.
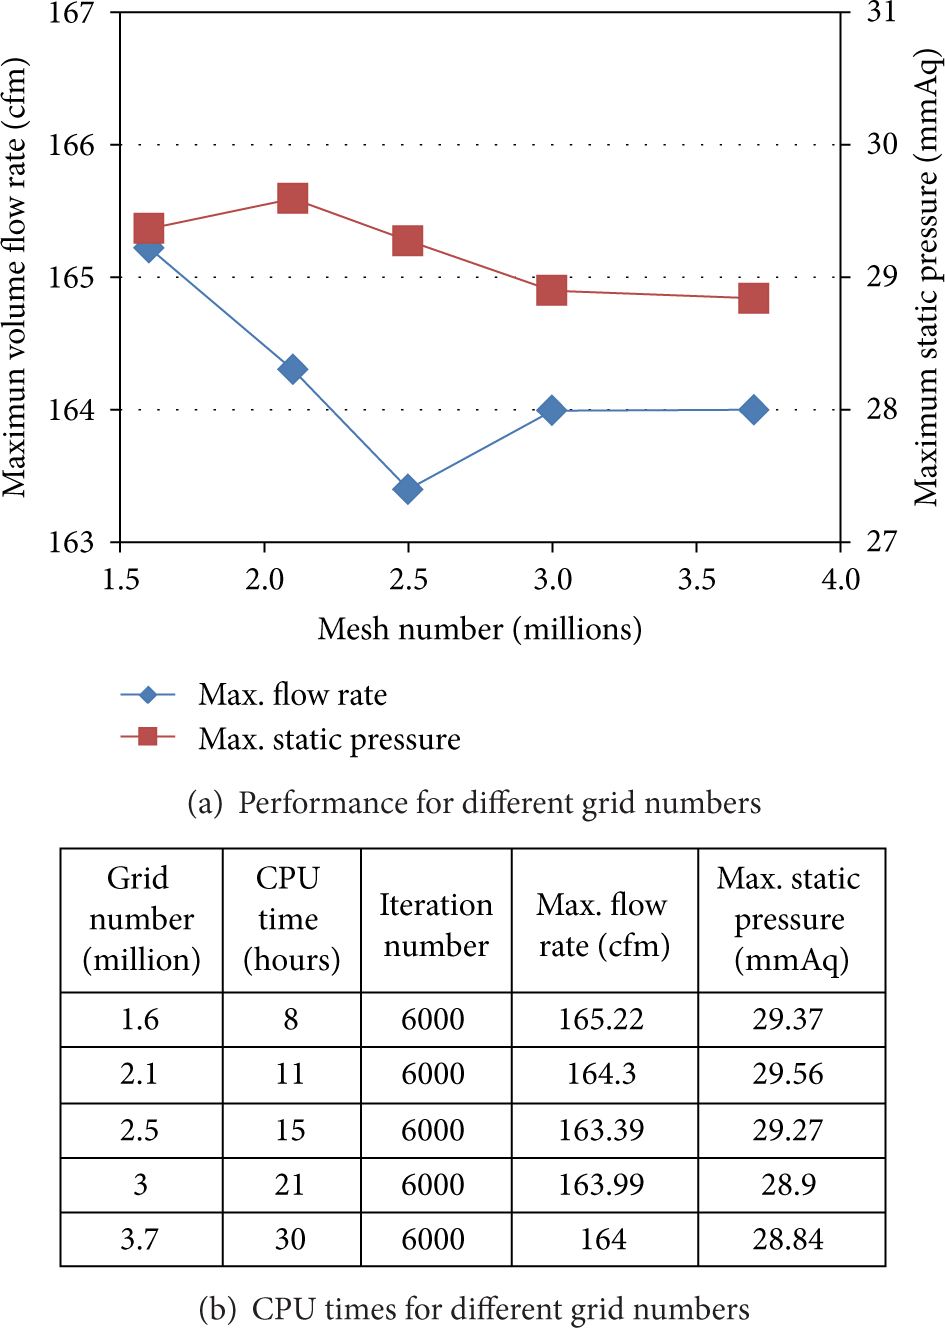
Calculated results for the grid independence test.
Clearly, the results of the 3 M-grid and 3.7 M-grid systems are almost identical and sufficient to yield the detailed flow patterns inside the original in-line fan. As a result, the 3.7 M-grid system is selected to perform the related CFD simulations of in-line fan in this work. Figure 3 shows the performance curve and the overall flow filed attained from the numerical simulation of original case. It is found that the maximum static pressure and maximum flow are 28.84 mmAq and 4.64 CMM, respectively.

Calculated performance curve and flow pattern of the original in-line fan.
Numerical results from the numerical simulation of pressure counter and velocity field show that there is a high reversed flow at the fan exit as point A in Figure 3. The farthest the reversed flow from position A to the exit of the fan is, the better the efficiency of the fan will be; hence modifying the tail body geometry is necessary. And the detailed flow pattern around the upper rib is illustrated around point B in Figure 4. It is obvious that holding ribs form a blockage when flowing through the impeller, and its short length and straight shape have negative impact on the static pressure. It shows that there exists a low-pressure region due to circulation as a result of sudden stepping down of the flow field. This effect is shown in Figure 4 in which the high pressure only occurs at the blade outlet. Elongating the rib and guiding the flow spirally to the fan exit will prevent this sudden change of the fluid flow; thus the spiral guiding vanes are designed for this purpose. Thus, the fan pressure is enhanced and also that flow is moving more smoothly.
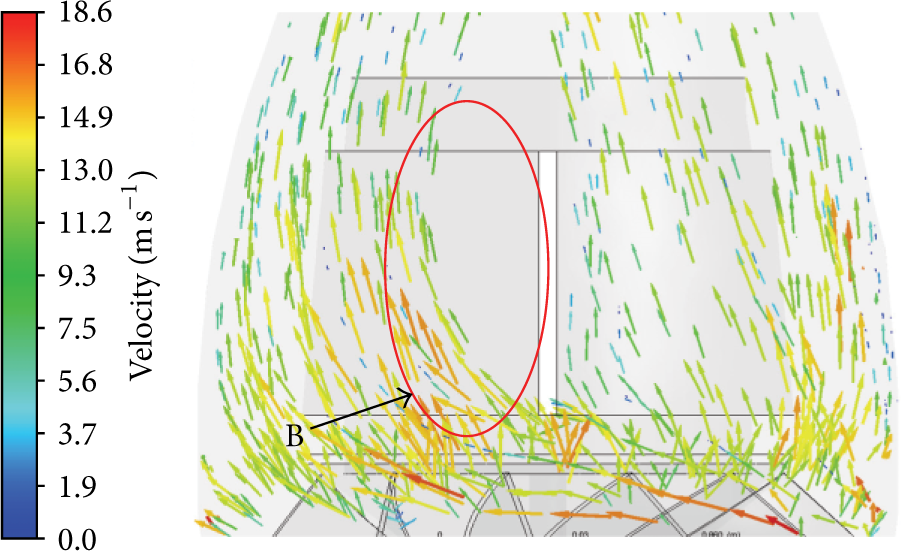
Detailed flow pattern around the rib of the original fan.
4.2. Designs of Guiding Vane and Tail Body
To increase the static pressure of the fan, the guiding vanes are designed, while the same rib height of the original fan is maintained. It is easy to find from Figures 4 and 5 that the exit flow from impeller is inclined with an angle of about 45 degrees to the horizontal axis, hence different twisted angles of the guide vanes are proposed and the prime number of guide vanes is employed in order to have a better noise performance. Figure 6 shows several geometries of guiding vanes with various twisted angles. Note that the vane lengths for the 30-degree and 45-degree twisted angles are only 0.5 and 0.64 times of the original rib height, respectively, while the length of twisted 60-degree vane is 1.28 times to provide a longer distance for increasing its static pressure. So this twisted angle of guiding van is used for attaining the smooth flow pattern and increasing the vane length.
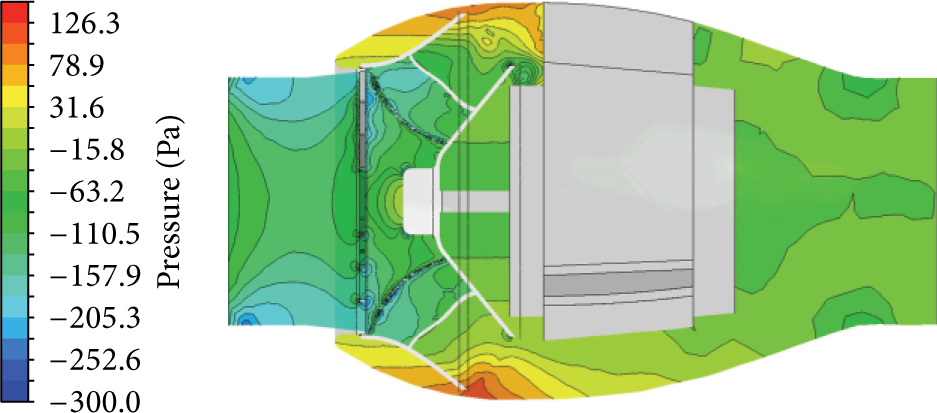
Pressure distribution of the original in-line fan.

Geometries of the guiding vane.
The tail body is modified by producing the appropriate curve shape. The arc curve, elliptic curve, and spline curve (Figure 7) for the tail body are considered here under the constraints of a maximum 45 mm in length and installing along the center line of motor axis. Note that the spline line with an optimum initial angle is firstly determined through iteration. Then other subsequent points are defined at 22, 45, and 90 degrees as illustrated in Figure 8. Three polynomial curves of tail body are created for three lengths (15, 30, and 45 mm) of major axis.

Different shapes for the tail body (unit: mm).

Sketches of the polynomial shape of the tail body (unit: mm).
5. Discussions on Modified Fan
5.1. Experimental and Simulation Analysis
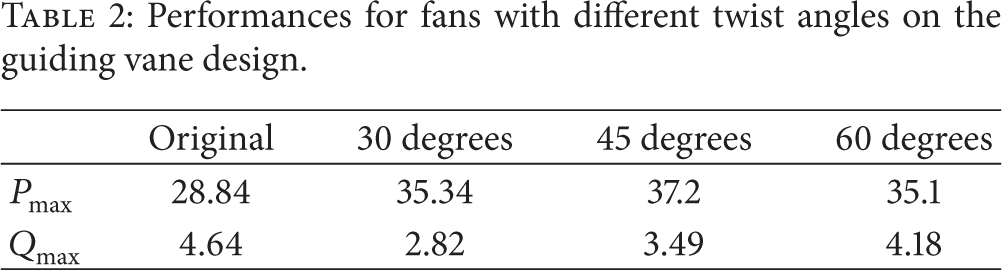
In order to achieve a better performance of the fan, the parameters studied in the previous sections are modified and checked with CFD simulation firstly prior to manufacturing the prototype. And the product with modified design is developed and investigated based on the flow visualization of numerical output. Figure 9 shows the comparison of performances between the original fan and the modified fan with guiding vanes. From Table 2, the fan performance is enhanced by 21% on maximum pressure with a 10% reduction on flow rate by using guiding vane.
Performances for fans with different twist angles on the guiding vane design.

Performances for the original fan and the fan with guiding vanes.
These performance changes are due to the blockage influence of guide vanes and a pronounced enhancement for the maximum static pressure. Experimental and numerical results of the new design are found in good agreement with a minor variation. Also, AMCA test chamber established in accordance with code 210–99 is used for the performance experiment in this work.
5.2. Introducing the Guiding Vanes
In order to minimize the calculated error, the designed fan with guiding vanes is simulated using the 4 M-grid numerical model. Table 2 shows the simulation results of maximum static pressure and flow rate for fans with different twist angles. The case of twisted 60 degrees increases the maximum static pressure to 35.01 mmAq while reducing the flow rate to 4.18 CMM. Also, the designs with 30-degree and 45-degree twist angles improve maximum static pressure to 35.34 mmAq and 37.2 mmAq, respectively. But the generated flow rate decreases significantly to 2.82 CMM and 3.49 CMM, which represent almost 39% and 25% loss of flow rate.
It is clear that the twisted 60° vane are the proper choice since it not only enlarges static pressure by 21.7% but also has a better overall performance curve as shown in Figure 10. Afterwards the fan performance with twisted 60-degree guiding vane is tested via the PR-fabricated mockup. The maximum static pressure and the maximum flow of the experimental results are found to be 30.57 mmAq and 4.11 CMM, as shown in Figure 11. Thus, a rough 5% deviation is observed between CFD and test results and this difference is presumably due to the surface roughness caused by the PR (rapid-prototyping) technique.

Performance curves for fans with different twist angles on the guiding vane design.

Performance comparison for test and CFD results for fans with different twisted angles on the guiding vane design.
Since the deviation is within an acceptable range, it is concluded that the numerical result can accurately predict its performance. As illustrated in Figure 12, it is clear to find that the in-line fan with guiding vanes not only increases the pressure effectively but also eliminates the low-pressure region at inlet significantly. Also, the modified spiral vanes have smoothened the flow pattern and take away the flow separation further as shown in Figure 13. And the reversed flow quoted as point B in Figure 4 has been reduced considerably. However, there still exists a large reversed flow area at the motor base and the fan discharge. Therefore, it motivates the addition of tail body to eliminate this problem. Several important parameters of tail body are evaluated in the following subsection.
Pressure distribution of the fan with guide vanes.
Flow patterns of the in-line fan with the guide vanes.
5.3. Adding the Tail Body
Different parameters on the tail body through numerical simulation are investigated and discussed here. The comparison of maximum static pressure and maximum flow rate for simulation results of the modified tail body fan and the original in-line fan is listed in Table 3. It can be found that arc and polynomial curves both increase the flow rate to 4.88 CMM with a slight increase of static pressure at 29.6 mmAq and 29.09 mmAq, respectively.
Performances of fan with different curvature on the tail body design.

And the fan with elliptic-curve tail body provides a higher flow rate to 4.91 CMM and the similar 29.09 mmAq static pressure as illustrated in Figure 14. Even though there is no huge difference among the fan with different shape of tail body. Figure 15 shows the flow pattern for different curve of tail body; it can be found that there are still some reversed flows existed for the cases of arc and polynomial curves. Clearly, imposing both the modified tail body and the guide vanes together on the in-line fan is instructive and necessary to explore. And the following section shows the simulation results of these in-line fans.

Fan performance curves for the tail body with different curvatures.
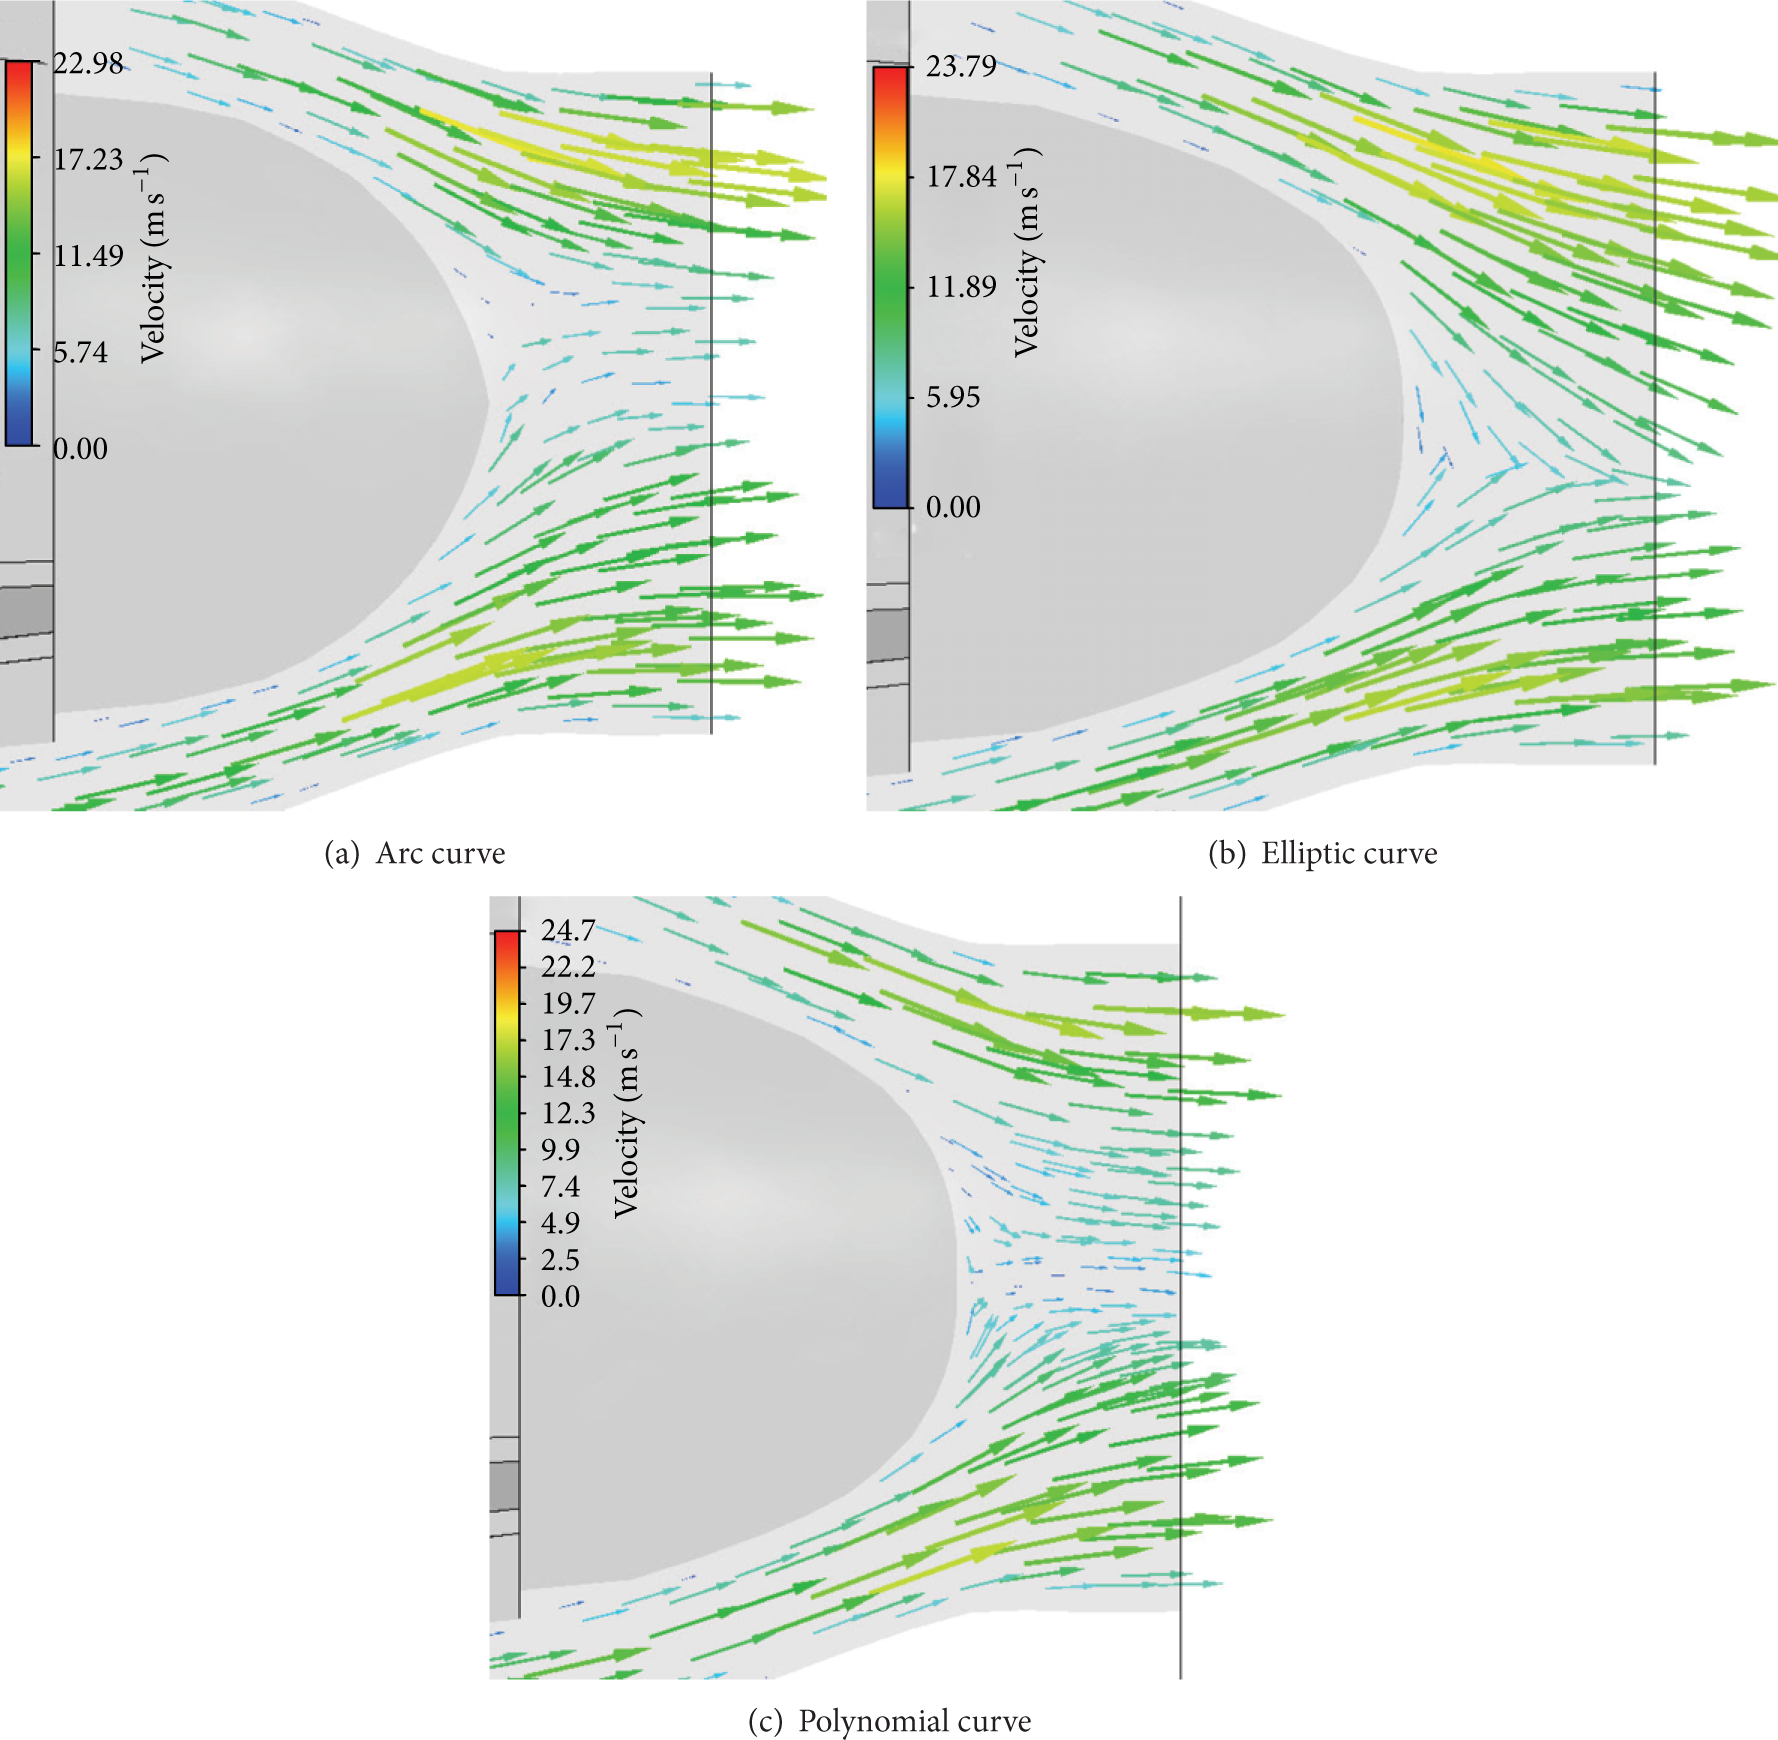
Flow patterns of the in-line fan with various tail bodies.
5.4. Adding Guide Vane and Tail Body
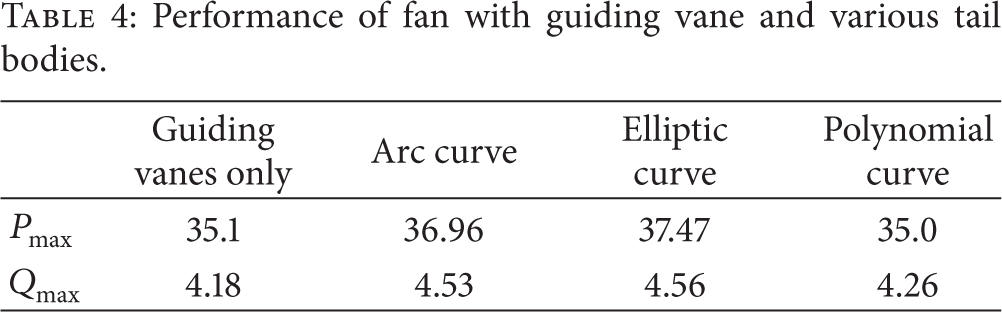
In order to increase flow rate and eliminate reversed flow at exit region simultaneously, the guide vane and the tail body are employed in the in-line fan design to have a better outcome. Table 4 shows the performance comparison for the guide vane fan with different tail bodies. As a result, the guide vane designs with arc, elliptic, and polynomial-curve tail bodies yield the maximum static pressure and flow rate as (36.96 mmAq, 4.53 CMM), (37.47 mmAq, 4.56 CMM), (35 mmAq, 4.26 CMM), respectively. Also, it is clearly indicated in Figure 16 that the performance of guide vanes with an arc curve tail body is superior to the other two curves.
Performance of fan with guiding vane and various tail bodies.

Performance curve for fans with guiding vane and various tail bodies.
Figure 17 shows the performance comparison between fan with guiding vane and fan with both vane and tail body. Apparently, the maximum static pressure and flow rate are enlarged by 6.8% and 9.1%, respectively. Moreover, its maximum static pressure and flow rate are 28.8% higher and 7.7% lower than these from the fan with guide vane only.

Performance comparison between fan with guiding vane and fan with both guiding vane and tail body.
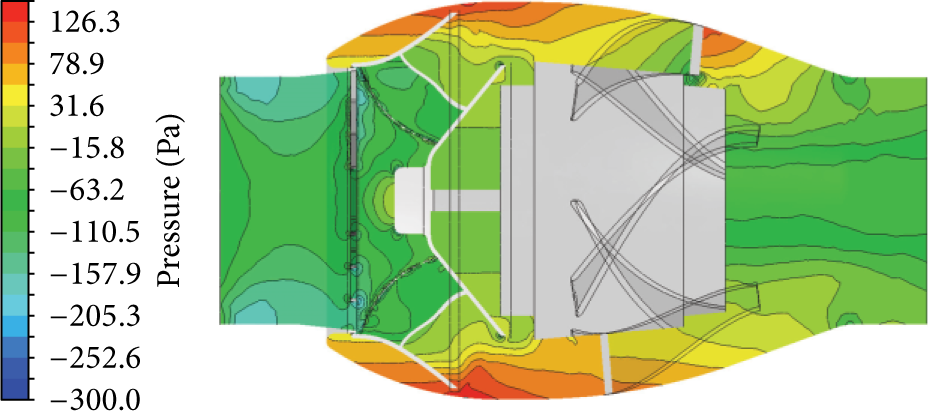
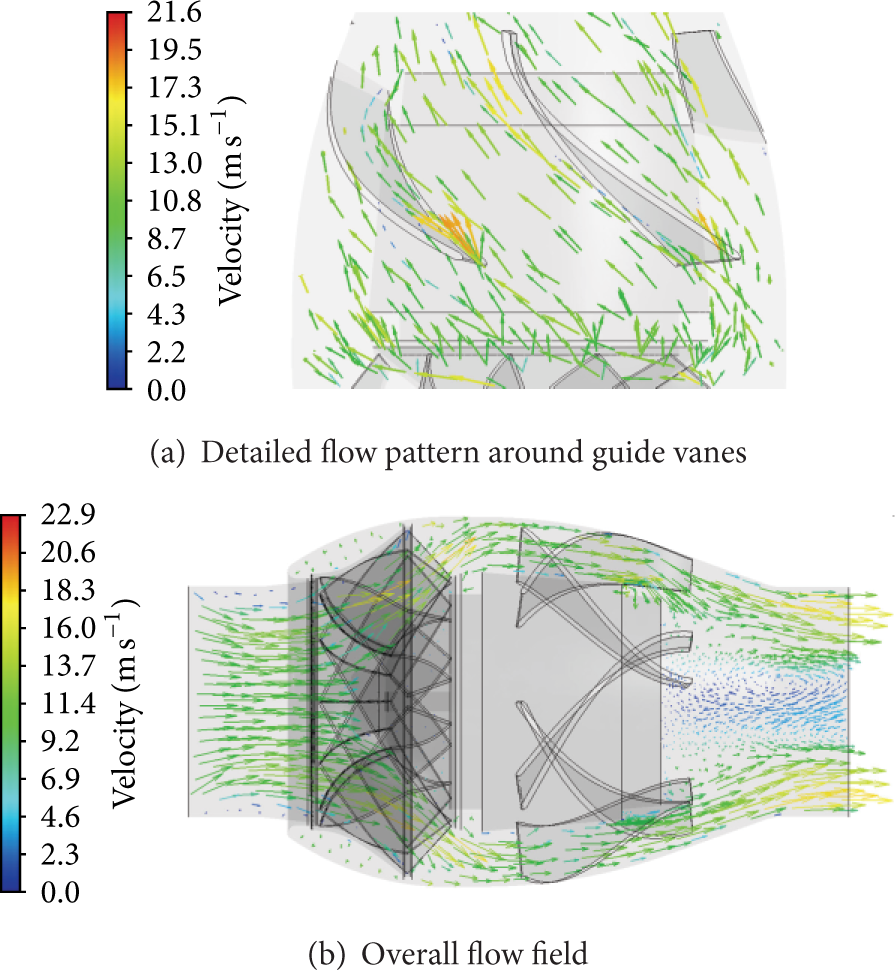
When implementing both the spiral guide vanes and the modified tail body, the separation point is successfully delayed, while a reversed flow is still identified at exit area as indicated in Figure 18. Additionally, Figure 19 illustrates the detailed flow pattern around the guide vane, which yields the smoother flow field pattern and a larger velocity by the effect of tail body. However, when both the modified tail body and the spiral guide vanes are adopted in the design alternative, the maximum static pressure is found to have an impressive 30% enhancement with a minor 1.7% reduction on its flow rate. On the other end, the comparison on the overall performance curves between the original fan and design with both vane and tail body is shown in Figure 20. Apparently, the new fan design with guide van and tail body results in a satisfactory outcome, especially on the aspect of static pressure gain.
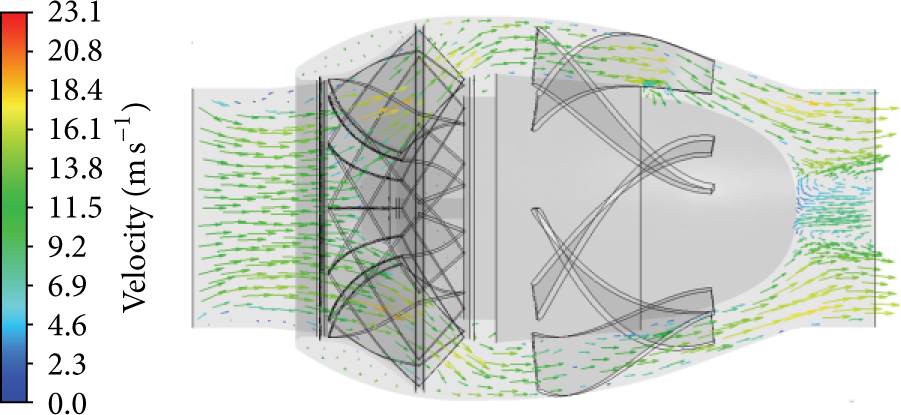
Flow fields of the in-line fan with guiding vanes and tail body.

Flow pattern of the fan with guiding vane and tail body.

Performance comparison between the original fan and fan with guiding vanes and tail body.
6. Concluding Remarks
In this study, an integrated performance analysis on an in-line fan is carried out through a combined experimental and numerical approach. The numerical visualization on the flow characteristics provides significant information to improve the inner flow patterns for fan designers. For validating CFD prediction, a fan mockup is fabricated via RP technique to serve as the investigation subject. The result indicates that experimental P-Q curve agrees to that of the numerical simulations. The deviations between CFD and test results are approximately 5% on both the maximum volumetric flow rate and the maximum static pressure.
In summary, this integrated fan performance evaluation scheme consists of CFD analysis, mockup fabrication, and performance test. Through this systematic evaluation procedure, the fan designer can visualize the flow patterns and modify its design for meeting the request under various operating points. Consequently, this study establishes an integrated aerodynamic, rapid prototype, and experiment approach that can be used as an important tool for fan designers.
Conflict of Interests
The authors declare that there is no conflict of interests regarding the publication of this paper.
Footnotes
Acknowledgments
The authors would like to thank the financial supports under Department of Energy Equipment System Engineering, Industrial Technology Research Institute (ITRI-102AL604), and Ministry of Education (MoE) Top University Projects (102H223401 and 102M21005).