
Abstract
A numerical simulation has been conducted to investigate flow erosion and pipe deformation of elbow in gas-solid two-phase flow. The motion of the continuous fluid phase is captured based on calculating three-dimensional Reynolds-averaged-Navier-Stokes (RANS) equations, while the kinematics and trajectory of the discrete particles are evaluated by discrete phase model (DPM), and a fluid-structure interaction (FSI) computational model is adopted to calculate the pipe deformation. The effects of inlet velocity, pipe diameter, and the ratio of curvature and diameter on flow feature, erosion rate, and deformation of elbow are analyzed based on a series of numerical simulations. The numerical results show that flow field, erosion rate, and deformation of elbow are all sensitive to the structural changes and inlet condition changes. Higher inlet rate, smaller curvature diameter ratio, or smaller pipe diameter leads to greater deformation, while slower inlet rate, larger curvature diameter ratio, and larger pipe diameter can weaken flow erosion.
1. Introduction
Erosion wear, resulting in mass loss from the inner wall of pipe, wall thinning, and even pipe break, is an essential degradation mechanism for industrial piping [1]. Especially, high-speed gas-particle flow usually causes very serious erosion failure of bend pipes in many industrial practices, such as pneumatic conveying of powders and sand discharge pipe in gas drilling, sand blasting, and so forth. Bends are also known to be responsible for dramatic change in flow field, high pressure loss, and secondary flow, which inevitably induce vibration and deformation [2]. In addition, particles continuously impinging on pipe wall can also cause pipe vibration and deformation. Therefore, flow erosion and pipe deformation both are present in elbows in gas-solid flow. Under the combined action of flow erosion and pipe deformation, elbows are undoubtedly vulnerable and fail easily, which threaten the piping system reliability and personal safety.
Figure 1 shows two actual damaged elbows in gas-solid flow. The left one, 114.30 mm in outer diameter, is a failure of bend in chemical plant after repairing, which had presented perforation failure just 3 months after putting into production. The right one is a failure of bend in gas pipeline with outer diameter of 88.90 mm. It is clearly seen that gas is ejecting from the crack in elbow.
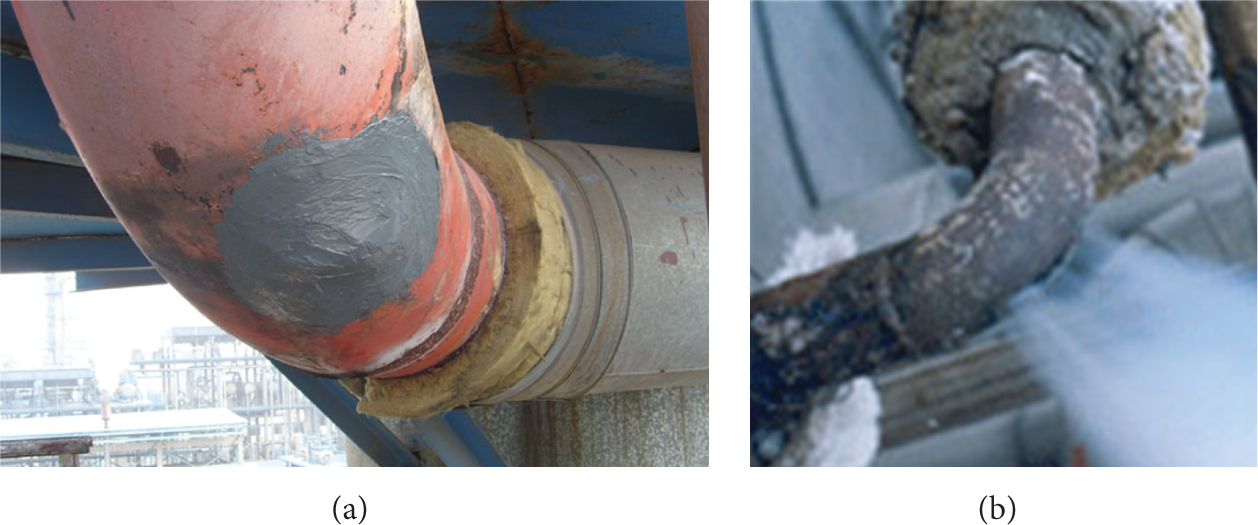
Actual damaged elbows: (a) a failure of bend in chemical plant after repairing; (b) a failure of bend in gas pipeline.
Erosion in elbows has been experimentally or numerically analyzed by different investigators [3–6]. The velocity of erosive particles, angle of impact, and type of material are regarded as the three most important factors governing erosion [7]. Several empirical or semiempirical correlations have been built to predict the erosion rate of elbows in gas-solid flow. But they are limited to special working conditions and cannot be used for all erosion calculations, because that erosion strongly depends on piping structure, piping layout, flow localized distribution, and so forth. Pipe deformation has also been investigated by several researchers [8, 9]. But they mainly focused on structural strength analysis. Flow induced bend deformation is rarely studied. Therefore, not only flow erosion but also flow induced deformation needs further studies.
Furthermore, few literatures have taken flow erosion and pipe deformation into account together. There is a mutual influence between the two. On the one hand, high-speed gas-particle flow can induce erosion wear and result in wall thinning, which brings about local change in the flow channel and results in change of the flow field. On the other hand, gas-particle flow can also cause bend deformation, leading to change of the flow field. Then, the modified flow field will have a new different effect on erosion and pipe deformation. Thus, it is urgently needed to conduct coupling analysis of fluid-structure interaction and flow erosion of gas-solid flow in elbow pipe and identify the location and magnitude of the maximum erosion and deformation.
Since gas-solid flow feature in elbow as well as erosion rate and deformation displacement is difficult to quantify experimentally, in this work, they are obtained by use of a three-dimensional fluid-structure interaction computational model coupling with a combined continuum and discrete model. The flow field distribution of gas-solid flow and the erosion rate and deformation of elbow are captured under different inlet conditions or different structural conditions. And the effects of inlet velocity, pipe diameter, and the ratio of curvature and diameter are discussed finally.
2. Simulation Method
2.1. Mathematical Model
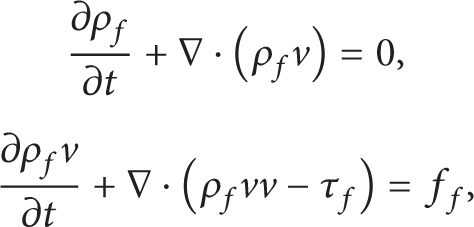
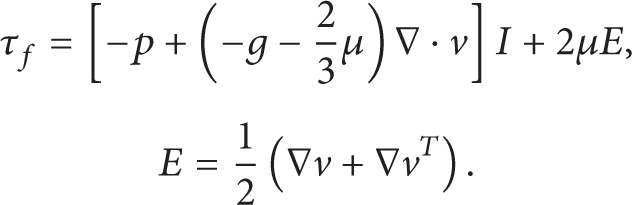
In this study, gas seemed as continuous fluid phase evaluated by a Navier-Stokes solver, and solid particles are treated as spherical particles added into continuous phase flow field as discrete phase, which are captured by discrete phase model (DPM). The motion of the continuous fluid phase is governed by the three-dimensional Reynolds-averaged-Navier-Stokes (RANS) equations, including continuity and momentum equations, presented as follows [10]:
where
Simultaneously, realizable k-ε turbulence model [11] is employed to close the flow governing equations and describe the turbulent properties:

where

After continuous phase flow field such as velocity and pressure distribution obtained by solving the above equations, turbulent properties of discrete phase can be described by a particle motion equation, including the trajectory of particles, the attack angle, and velocity perturbation [12, 13]. This particle motion equation is called as DPM model and is written as

where

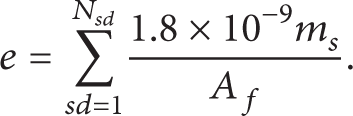
Then, the erosion rate can be determined by the mass transfer rate of magnetite on the metal surface, which takes the form:
The flow induced deformation of bend pipe is governed by the following equation [14]:

And the fluid-structure interaction meets the dynamic condition on the interface as follows:

Finite volume method (FVM) and finite element method (FEM) are used to discretize the fluid and pipe motion equations, respectively. All the simulations are carried out using a commercial software package ANSYS Workbench 14.0, a fluid-structure interaction computing platform, in which FLUENT is used to calculate gas-solid flow field including DPM being adopted to capture discrete phase based on Lagrangian approach, and ANSYS mechanical analysis module is used to calculate the pipe deformation.
In calculations, SIMPLE algorithm is employed to solve the pressure-velocity coupling, and second-order upwind scheme and second-order central-differencing scheme are used for convective terms and diffusion terms, respectively. The convergent criteria for all calculations are set such that the residual in the control volume for each equation is smaller than 10−5.
2.2. Simulation Conditions
In this work, gas-solid flow in a 90° horizontal bend is studied. As shown in Figure 2, the pipe is divided into three sections: front straight pipe section, bend section, and rear straight pipe section. The lengths of front straight pipe and rear straight pipe are both 5 m. In order to analyze the effect of pipe diameter, the inner diameter of pipe is defined as 74.22 mm, 84.84 mm, or 95.00 mm, with outer diameter (D) of 88.90 mm, 101.60 mm, and 114.30 mm, respectively. The curvature and diameter ratio of elbow (R/D) is set to 3, 4, and 5, respectively, in order to observe the effect of curvature change.

Schematic and numerical grid representation of computational domain: (a) overall view of the computational domain and boundary conditions; (b) grid distribution of fluid and solid computational domain.
ICEM CFD mesh-generator and ANSYS mesh-generator are employed to perform the fluid and pipe geometry generation and meshing, respectively. Figure 2(b) shows the grid distribution of fluid and solid (pipe) computational domain. It is clearly seen that fluid computational domain is divided into five blocks and progressive mesh is used to capture the near-wall flow properties (seen from the cross section). Each block is discretized with hexahedral cells in order to control the grid distribution and computational stability. Solid computational domain is discretized with uniform hexahedral cells, but the grid density in radial direction is less than that of fluid computational domain.
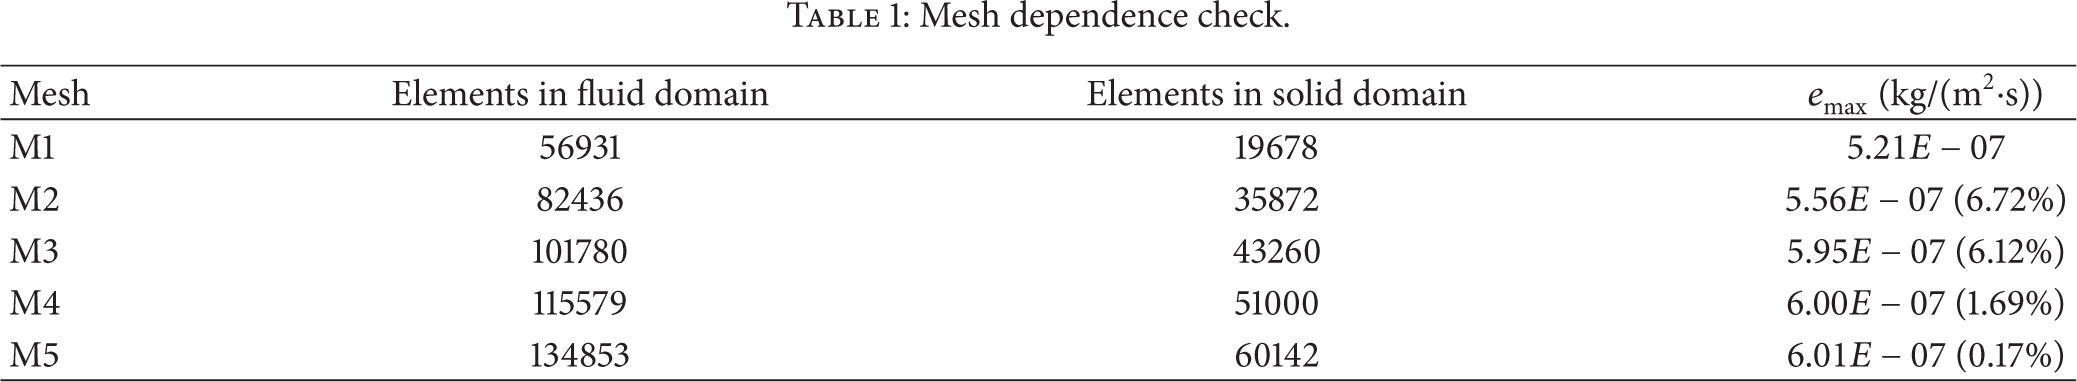
In order to ensure that the numerical results are independent of grid size, five different mesh densities are selected to conduct grid resolution tests for elbow with outer diameter of 101.60 mm and R/D of 4 with inlet velocity vin = 20 m/s. The mesh generation parameters and the maximum calculated erosion rate (emax) are given in Table 1, in which the percentage changes are indicated inside the brackets. The percentage difference in emax between the two grids of M2 and M3 is 6.12% and this amount of difference reduces with the increase in the number of grids as of percentage of difference between two grids M3 and M4 is just 1.69%. The values undergo a variation of 0.17% when we pass from M4 to M5 grid systems. The simulations are executed in the Intel(R) Core(TM) 2 with specifications of CPU 4 GHz and 2 GB RAM with windows XP platform. Simulations consumed typically 26 and 45 CPU hours for M4 and M5 grids, respectively. The CPU time undergoes an increase of 173.08% while numerical results undergo a maximum variation of only 0.17%, when we pass from M4 to M5 grid systems. Therefore, we conclude that the grid M4 with the minimum size of the grid 0.005 m, shown in Figure 2, can give a good compromise between precision and calculation time and is sufficient for carrying out numerical simulations in this study.
Mesh dependence check.
Uniform gas and solid velocity is taken as the inlet condition in this work. After passing through the front straight pipe, they will form a fully developed flow. The same rate of gas and solid in inlet is set to 20 m/s, 30 m/s, or 40 m/s, in order to observe the effect of inlet condition. Pressure outlet boundary condition is used for the outlet of fluid computational domain. And the value is defined as 0 Pa in order to facilitate comparative analysis. No slip boundary condition is imposed on the pipe inner wall. Density and viscosity of gas seemed constant as 1.225 kg/m3 and 1.8 × 10⁻⁵ Pa·s, respectively. And the density of solid particle is 1123 kg/m3.
As shown in Figure 2, the elbow is fixed at both ends. The corresponding outer wall is set to be fixed boundary. Steel is the pipe material with density, Young's modulus, and damping ratio of 7850 kg/m3, 196 GPa, and 0.05, respectively.
3. Numerical Results and Discussion
3.1. Effect of Inlet Velocity
Gas-solid flow in elbow is affected by a range of variables related to operational conditions, pipe structure, and particle properties. Inlet condition, being as the most important one of operational conditions, is selected to be analyzed in the present work firstly. This is done by performing a number of simulations by varying flow inlet rate while other variables are fixed at their base values (D = 101.60 mm and R/D = 4).
Figure 3 shows the distribution of pressure and gas velocity in axial section, and the spatial distribution of deformation (de), von-Mises stress (VMS), and erosion rate (e). It can be seen that the radial pressure gradient increases with the increase of inlet rate. For inlet rate of 40 m/s, the value of radial pressure gradient is 4714.76 Pa/m, which is four times as great as that with 20 m/s inlet rate. Gas velocity distributions in axial section are similar to different inlet rates, which show a tongue-like shape. High-speed region is near to the extrados while low speed region is close to the intrados of elbow.

Effects of inlet velocity (vin) on flow field (pressure and velocity distribution), deformation, von-Mises stress, and erosion in elbow.
The maximum pipe deformation locations are observed at 30–50° of the elbow (the inlet of bend is set to 0° and the outlet of bend corresponds to 90°). The higher the inlet rate, the larger the maximum deformation. The maximum value is 1.448 × 10⁻² μm presenting at the elbow with 40 m/s inlet rate, which is about 3.87 times than that with 20 m/s inlet rate. The von-Mises stress of elbow presents the same tendency as pipe deformation; the maximum value, 11455 Pa, occurs when the inlet rate is 40 m/s. While the von-Mises stress is just 3148.8 Pa with the inlet rate 20 m/s, which is about 27.49% of the former one.
The erosion rates along the elbow wall for different inlet speeds are also predicted and presented in Figure 3. It is clearly seen that erosion rate of outer wall is much larger than that of inner wall, and the maximum erosion rate is located at 30–45° of the outer wall. The larger the inlet rate, the greater the kinetic energy of particles, resulting in the greater impinging on elbow wall. The maximum value of erosion rate increases from 3.4 × 10⁻⁷ kg/(m2·s) to 8.0 × 10⁻⁷ kg/(m2·s) as the inlet flow rate increases from 20 m/s to 40 m/s. Therefore, the severity of erosion is enhanced as inlet rate is increased, which is also drawn from the distribution of wall shear stress.
The wall shear stress distributions along the outer wall under different inlet velocities are exhibited in Figure 4. As the fluid flows into the elbow, the wall shear stress has a slight decline but soon increases rapidly. The larger the inlet rate, the greater the wall shear stress and the faster the increase rate of wall shear stress. For inlet rate of 40 m/s, the wall shear stress increases about 1.3 times from the elbow inlet to the outlet.

Wall shear stress distribution along the outer wall of elbows with different inlet velocities.
3.2. Effect of the Ratio of Curvature and Diameter
Pipe structure is another important parameter affecting the flow feature in elbow. The details of the erosion and deformation effects are obtained for different curvature diameter ratios and different pipe diameters.
Flow field, deformation, von-Mises stress, and erosion rate distributions for different curvature diameter ratios are shown in Figure 5. It is seen that flow field is greatly affected by curvature diameter ratio. Pressure drop is greater in elbow with smaller ratio, which is 280 Pa for R/D of 3, being 1.4 times than that for R/D of 5. And the tongue-like-shape velocity contours for smaller ratio present a greater degree of curvature and a larger length. The main reason is that flow channel curves sharply in small ratio elbow, bringing about more power centrifugal force acting on fluid flow.
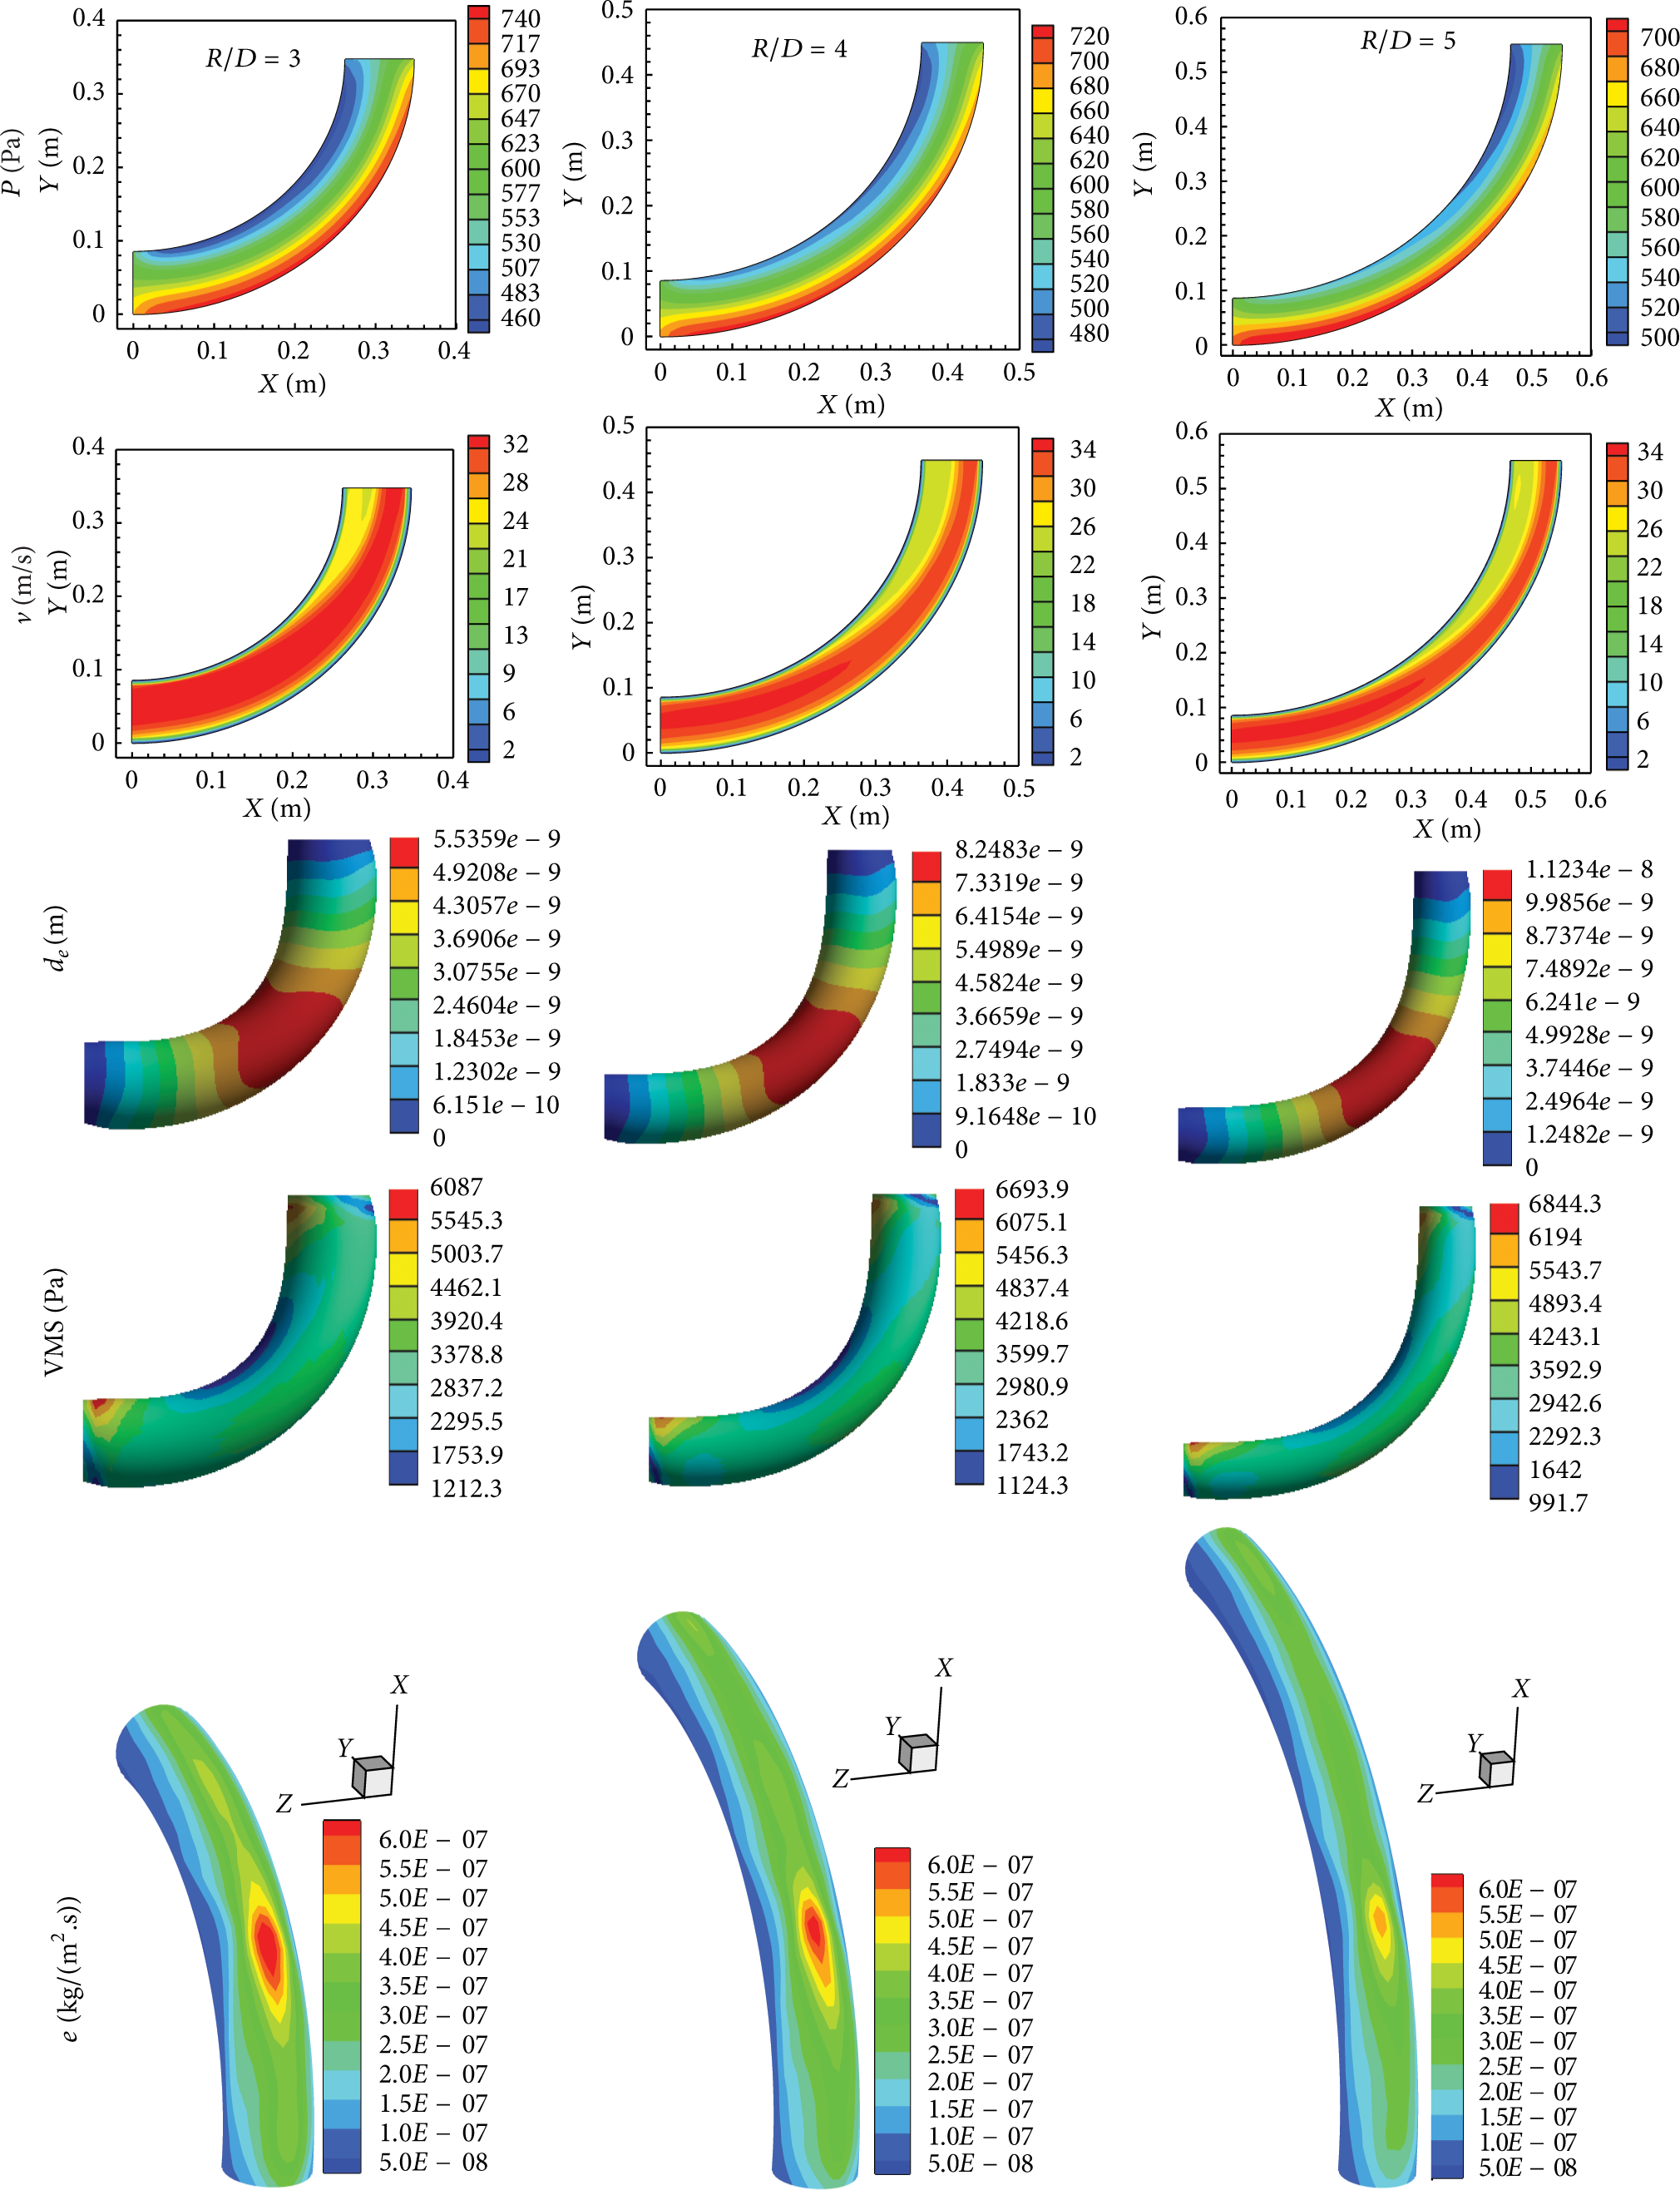
Effects of ratio of curvature and diameter (R/D) on flow field (pressure and velocity distribution), deformation, von-Mises stress, and erosion in elbow.
The erosion rate is affected by this flow field. The smaller the ratio, the more serious the flow erosion. We can clearly see that a bigger maximum erosion rate region presents in outer wall of elbow with R/D of 3, although the maximum value is the same for different ratios. And as the ratio increases, the location of the maximum erosion rate region moves to the upstream. For R/D of 3, the location sites are at around 45°, while it moves to about 35° for R/D of 5.
However, the deformation of elbow shows an opposite trend. The larger the ratio, the greater the pipe deformation. Due to the fact that both ends are fixed, the arc length plays an important role in bend deformation. As shown by von-Mises stress in Figure 5, the maximum value increases from 6087 Pa to 6844.3 Pa with the increase of curvature diameter ratio from 3 to 5.
Figure 6 shows the wall shear stress distribution along the outer wall of elbow with different ratios. There is a decline of wall shear stress after fluid flow entering the bend. And the minimum value appears to be about 0.09 m downstream from the elbow inlet. However, the wall shear stress has a rapid growth after the trough. The fastest increase rate is 2.85 Pa/m, appearing in elbow with R/D of 3.

Wall shear stress distribution along the outer wall of elbows with different ratios of curvature and diameter.
3.3. Effect of Pipe Diameter
Figure 7 shows the effects of pipe diameter on flow field, deformation, von-Mises stress, and erosion in elbow. The differences of pressure drop and velocity contours are not obvious for different pipe diameters. However, the deformation and erosion rate of elbow change significantly as diameter changes. The maximum deformation decreases from 8.7607 × 10⁻⁹ m to 7.4619 × 10⁻⁹ m as diameter increases from 88.9 mm to 114.3 mm. And the maximum von-Mises stress for the three different diameter elbows is 7074.8 Pa, 6693.9 Pa, and 5929.3 Pa, respectively.

Effects of pipe diameter (D) on flow field (pressure and velocity distribution), deformation, von-Mises stress, and erosion in elbow.
The severity of flow erosion is enhanced as the pipe diameter is decreased. The erosion rate has a sharp decrease as D increases from 88.9 mm to 114.3 mm. However, the declining magnitude of erosion rate from 101.6 mm to 114.3 mm is larger than that from 88.9 mm to 101.6 mm.
The wall shear stress distribution also indicates that small diameter pipe has more power flow force acting on it, as shown in Figure 8. The increase rate of wall shear stress along outer wall is 2.33 Pa/m for diameter of 88.9 mm, while it is 1.63 Pa/m for diameter of 114.3 mm.

Wall shear stress distribution along the outer wall of elbows with different diameters.
The dimensionless deformation and erosion rate of bends at different cases are shown in Figures 9 and 10. We can see that the dimensionless deformation increases obviously with the increase in Re or R/d o , while it reduces with the increase of ratio of wall thickness and diameter. For R/d o , there are no obvious changes in dimensionless erosion rate. With the increase in Re, the dimensionless erosion rate increases firstly and then has no significant change. The dimensionless erosion rate decreases rapidly with the increase in ratio of wall thickness and diameter.

Dimensionless deformation of bends at different cases.
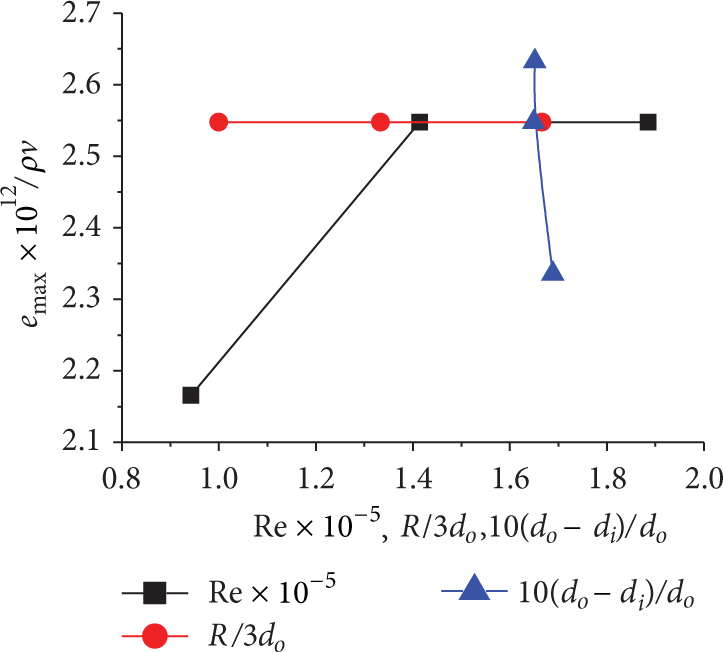
Dimensionless erosion rate of bends at different cases.
4. Conclusions
Numerical simulations based on FSI-CFD and DPM have been conducted to study the flow induced deformation and erosion in elbow pipe. Effects of the inlet rate, curvature diameter ratio, and bend diameter on deformation and erosion rate are discussed. According to the numerical results and the analysis above, the following conclusions can be drawn.
Flow field, erosion rate, and deformation of elbow are all sensitive to the structural changes and inlet condition changes. But the influence of inlet rate is greater than that of structural changes including R/D and D on elbow deformation and flow erosion.
Higher inlet rate, smaller curvature diameter ratio, or smaller pipe diameter leads to greater deformation, while slower inlet rate, larger curvature diameter ratio, and larger pipe diameter can weaken flow erosion.
The maximum pipe deformation locates at 30–50° of the elbow, while the maximum erosion rate locates at 30–45° of the outer wall. And the location of the maximum value region moves to upstream when curvature diameter ratio increases.
Footnotes
Nomenclature
Conflict of Interests
The authors declare that there is no conflict of interests regarding the publication of this paper.
Acknowledgments
Research work was supported by Open Fund (no. PLN1210) of State Key Laboratory of Oil and Gas Reservoir Geology and Exploitation (Southwest Petroleum University) and Key Project of Sichuan Provincial Education Department (no. 12ZA189). Without the support, this work would not have been possible.