
Abstract
FAST focus cabin is suspended and driven by 6 parallel large span cables. Low stiffness of cables makes the cabin sensitive to disturbance and difficult to control. Structural damping then becomes a key factor that can improve control ability. Therefore, a reasonable damping estimation is important for system design. In this paper, a practical damping identification method is developed based on Ibrahim-time-domain algorithm. The method shows satisfied performance on accuracy and reliability in simulation test and is utilized in vibration experiments to identify damping ratios of both single cable model and FAST 3 m scale cable suspension model. Finally, a preliminary analysis of the damping properties is given out based on the results of identification.
1. Introduction
FAST (five-hundred-meter aperture spherical radio telescope) will be the largest single dish radio telescope in the world [1]. Due to its large dimension, an innovative flexible feed support system with large working space and high control accuracy was proposed [2]. As shown in Figure 1, a 30 t focus cabin is suspended and driven by 6 parallel large span cables. The cables run over 6 towers and then connect to motor-driven capstans. Coarse position control of the cabin is realized by adjusting the length of cables. In focus cabin, a fine adjusting system including a Stewart manipulator is mounted to carry the feeds. The Stewart manipulator is used to isolate feeds from cabin vibration by adjusting the length of 6 linear actuators in real time.
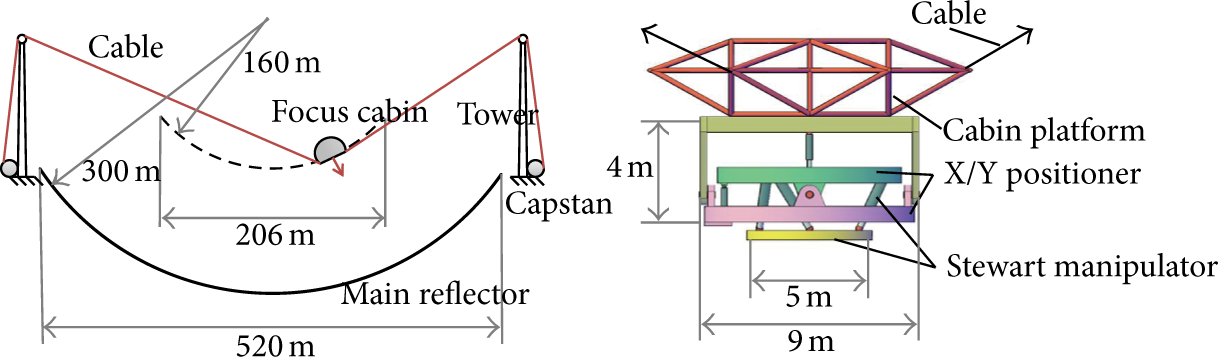
Recommended design concept of FAST feed support system.
A number of model experiments and simulations of FAST feed support system were carried out to study the structural dynamics and control ability. The problem called dynamic coupling between Stewart manipulator and cable suspension was observed [3]. Stewart manipulator is fixed on a flexible base and acts at the same frequencies of base vibration. Any delayed actuation from control system will add excitation on base and induce resonance to the whole system. Therefore, certain damping of cable suspension is required to dissipate disturbances and keep the system stable.
There is no reliable theory that can calculate damping of a complex structure. Experimental modal analysis technology can be used to identify the structure parameters such as modal frequency and modal damping ratio. In the past 4 decades, numerous modal identification algorithms both in frequency domain and time domain have been developed and widely used in structural engineering [4]. In general, classical frequency domain methods are mature, but which are difficult to deal with structures having close spaced modes. Moreover, frequency domain methods need sinusoidal input force to calculate frequency response functions. The usage of large excitation devices is quite impractical to handle on heavy structures. In contrast, time domain methods only need free decay response or random decrement data [5], which are more easy to obtain. In the 1970s, the well-known Ibrahim-time-domain (ITD) method was proposed [6, 7], which is featured in solving eigenvalues and eigenvectors of the system matrix. The system matrix is formed by a series of nodes’ free decay response data. Modal frequencies and modal damping ratios are directly related to eigenvalues and eigenvectors correspond to the mode shapes.
There are several published works on the development of ITD method, most of which discuss the approaches for improving the accuracy of identification (e.g., double least squares method [8] and correlation technique for ambient excitation with nonstationary white noise [9]). Nevertheless, the accuracy of identified damping ratio is often questionable, especially with noisy measurement [10]. In this paper, a modified damping identification method based on ITD is firstly presented. The accuracy and reliability of the method are verified by numerical simulations. Comparing with standard ITD method, the modified method needs only measuring one node and has satisfied accuracy of damping identification, which is more practical and reliable in vibration experiments. Finally, the proposed method is utilized in vibration experiments of both single cable model and downscaled FAST cable suspension model. A preliminary analysis of the damping properties of FAST cable suspension is given out based on the results of damping identification.
2. Standard ITD Method and Problem Formulation
ITD method uses simultaneous response of multiple nodes to form system eigenmatrix. The modal frequencies and damping ratios are calculated from eigenvalue analysis [11, 12]. In general, continuous systems have an infinite number of degrees of freedom (DOF), but only a finite number of modes can be used to describe the dynamic behavior. For a multi-DOF linear oscillatory system with n excited modes, the free decay response of one node in time domain is expressed as

where ϕ i are complex modes, λ i are complex frequencies, and a i are complex constants.
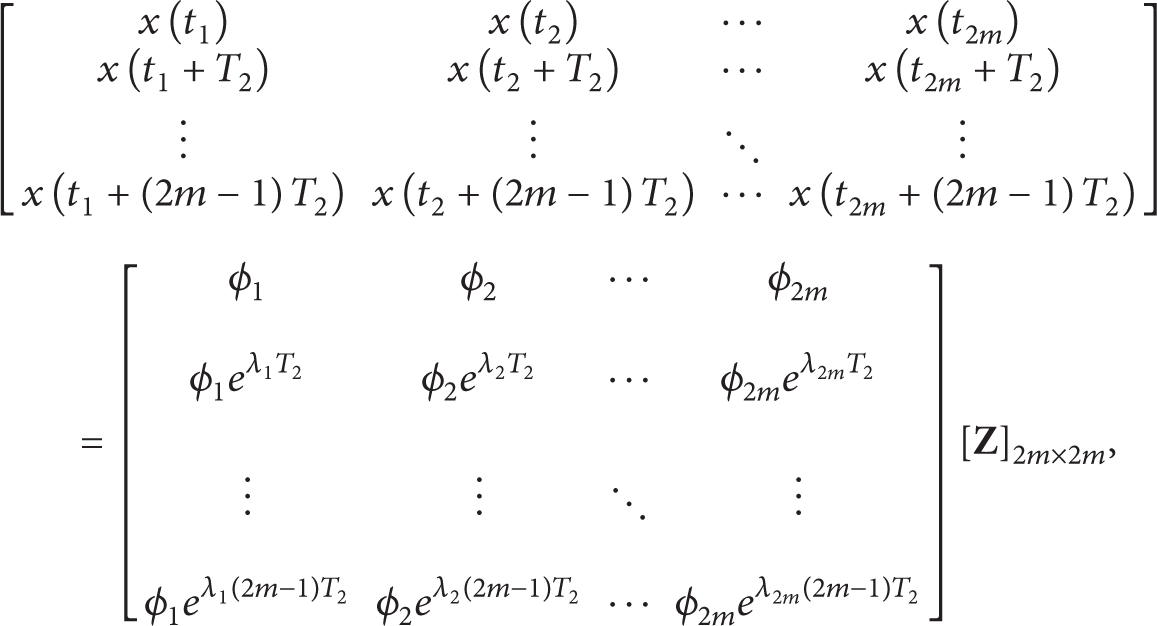
Given an impulse or step input force, the free decay response of nodes can be obtained from measurement. Assuming the number of measured nodes is m, m should be greater than n to make sure all modes are identified. Sampling the nodes’ response by a time interval, (1) can be written in matrix format:

A more compact form of (2) can be written as

Resampling the data by a time shift T1, the matrix [


Eliminating [

The eigenvalues of [
where

The number of measured nodes is often less than the number of excited modes, which will induce incomplete and inaccurate result. In this case, fictitious node response created by the delayed response of real node can be inserted to [
Numerical solution of eigenvalue always has a small error ε due to the existence of noise modes. If the real eigenvalues are
3. Proposed Modification of ITD Method
ITD method needs numerous sensors to obtain simultaneous response, which adds time and cost to the identification of complex structures. Furthermore, small errors existing in eigenvalues may lead to large deviation between identified damping ratio and the true value. Therefore, simplifying the measurement and improving accuracy are the 2 main targets of the modification.
By using fictitious node conception, the usage of measured nodes can be minimized. As the free decay response of one node is measured, the rest m − 1 rows of matrix [
which can be abbreviated to

A similar equation is obtained by using another time shift T3:

Comparing the form of (11) and (12) with (4) and (5), the new system matrix [
To obtain more accurate results, the modal parameters should be calculated by eigenvectors instead of eigenvalues. Define ϕ
ji
as the element of [ϕ
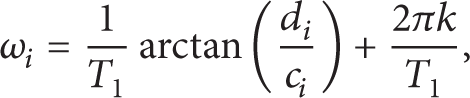
Then ω i and σ i can be calculated by


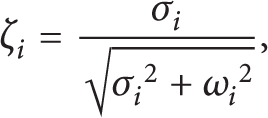
where real () and imag () are defined as real part and imaginary part of a complex number, respectively. The damping ratio ζ i can be calculated by (8). Similar to the case of eigenvalues, numerical solution of eigenvectors has an error ε as well. But both ω i and ζ i are related to the proportion of two adjacent elements in the same column. ε is therefore eliminated and the identified results are closed to the true values.
Assuming sampling interval is T s , the sum of data usage is

Therefore, to minimize data usage and maximize signal-to-noise ratio, T2 and T3 should be equal to T s .
Equation (15) shows that the value of ω i is not singleness. To obtain correct result, the following set of inequalities have to be obeyed:

where f min and fmax are the bounds of modal frequencies. Setting f min = 0 and k = 0, the solution is

4. Separating Real Modes from Noise Modes
The results of identification contain real modes and noise modes. By forming system matrix with different time shifts and comparing the results with PSD analysis, real modes can be picked up manually. To demonstrate the process, a numerical model of 2 DOF oscillatory system was created. The modal frequencies are 2.6 Hz and 3.3 Hz and modal damping ratios are 0.002 and 0.005, respectively. Sampling the impulse response from dynamic simulation and adding white noise as measurement error, the data are gathered to form system matrix.
The identified modal parameters using 4 different time shifts are shown in Figure 2. The units of abscissa axis and ordinate axis are frequency and damping ratio, respectively. Blocks of different size and color represent the identification results of frequencies and damping ratios with 4 different time shifts. Obviously, real modes flock together at 2.6 Hz and 3.3 Hz, whereas noise modes scatter randomly in contrast. The modes around 3 Hz are close to each other, which are hard to determine. In this case, a frequency domain analysis is needed as supplementary. In Figure 3, the power spectral density (PSD) analysis shows that original response has only two modes at 2.6 Hz and 3.3 Hz, respectively. Therefore the mode around 3 Hz is confirmed as noise mode.

Results of identification with 4 different sets of time shift.

Power spectral density of the response.
5. Performance Verification and Parameter Optimization
As discussed in Section 3, the modified method has an advantage in damping identification. To compare the accuracy between standard ITD method and modified method, the 2 DOF oscillatory system model in Section 4 was used. The system matrices were calculated by the same simulated response, and modal parameters were calculated by eigenvalues and eigenvectors, respectively. The defined modal parameters and identified results are listed in Table 1.
Results of identification using standard ITD and modified methods.

As shown in Table 1, both standard ITD method and modified method can calculate modal frequencies accurately. However, the relative error of damping ratios identified using standard ITD method is larger than 550%, which cannot be treated as a reasonable estimation; in contrast, the relative error of damping ratios identified using modified method is less than 5%, which shows satisfied accuracy of damping identification.
Using the modified method can realize accurate identification of both frequency and damping ratio, but proper settings of sampling frequency and signal length are prerequisite. A numerical model of 3 DOF oscillatory system was created for simulation study. The modal frequencies are 14.1 Hz, 14.6 Hz, and 15.5 Hz, and modal damping ratios are 0.004, 0.007, and 0.01, respectively. Using different sampling frequencies, the results of identification are shown in Table 2: as sampling frequency is less than 4 times a modal frequency, the modal parameters cannot be identified. For a certain mode, higher sampling frequencies have little influence on accuracy. Therefore, define critical frequency as 4 times the maximum modal frequency. The optimal sampling frequency should be greater than critical frequency to make sure all the modal parameters can be identified.
Results of identification using different sampling frequency.

X represents that the result cannot be identified.
Similar to sampling frequency analysis, two models of 3 DOF oscillatory system were created to study the accuracy of identification using different signal lengths which are expressed as duration of vibration. One model has 3 modes around 3 Hz and the other model has 3 modes around 10 Hz. The errors of identified damping ratio are shown in Figures 4 and 5. Shortening the signal length, the error of damping ratio will increase significantly. For a 3 Hz vibration signal, at least 2.7 seconds is necessary for accurate identification. And for a 10 Hz signal the minimal time is 1.3 s. In summary, to identify the damping ratio accurately, at least 15 vibration periods should be included in the vibration data.
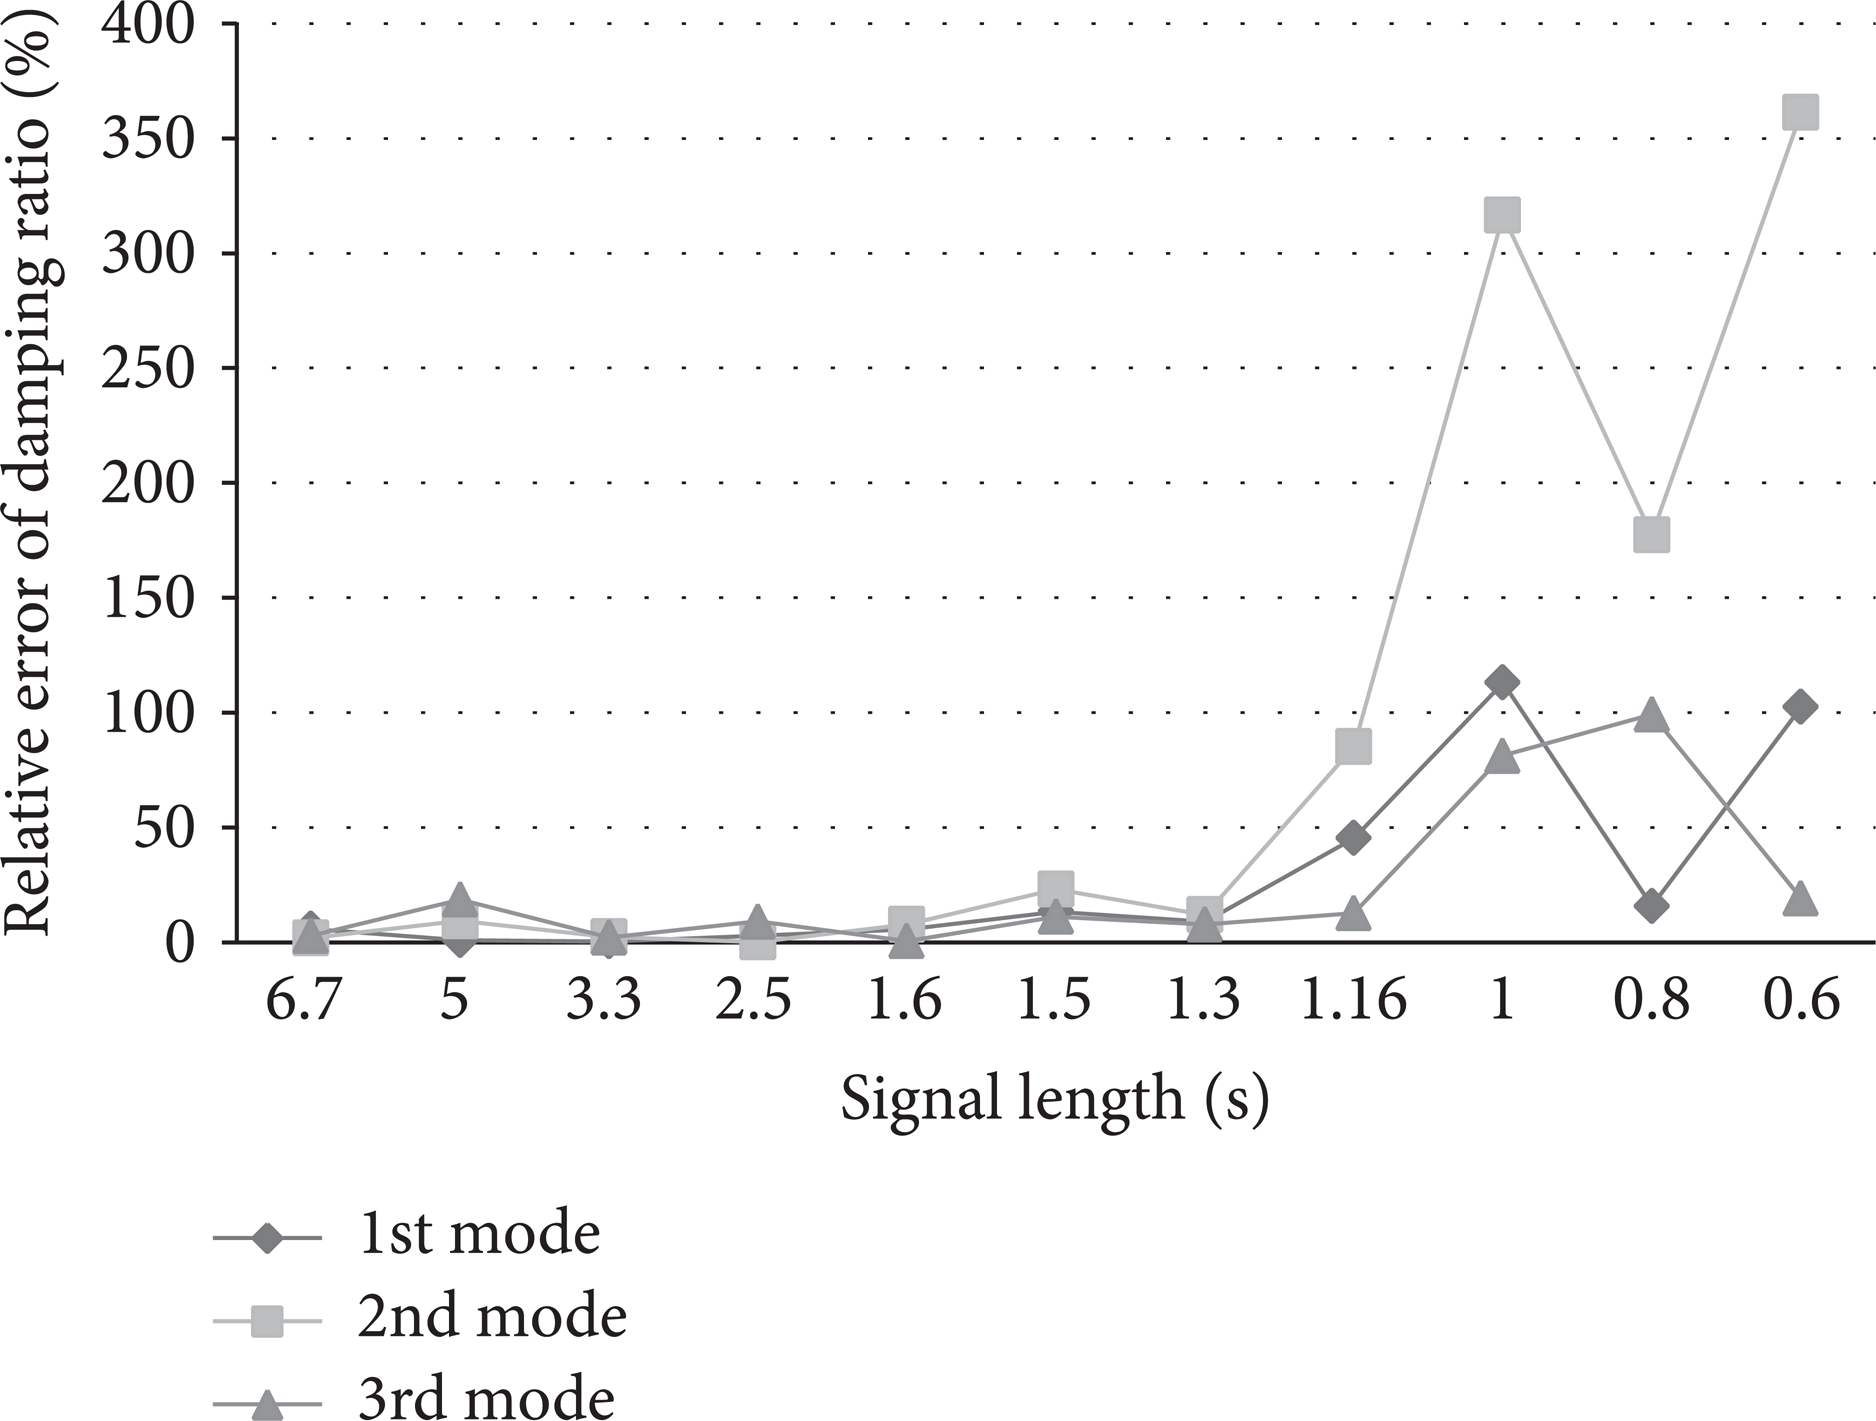
Damping ratio error of 3 Hz vibration using different signal lengths.

Damping ratio error of 10 Hz vibration using different signal lengths.
6. Damping Identification of a Single Cable
To study the damping contribution of a single suspended cable, an experimental model was built using a Φ3 mm steel wire rope (6 × 7 + FC). As shown in Figure 6(a), one side of the rope is fixed on the ground. The other side crosses over a pulley on 2 m steel tower and then connects to steel block counterweights. The step excitation is actuated by suspending a weight under the cable and then cutting off the string suddenly. To record the cable vibration in 3-dimensional coordinates without any influence from sensors, a high-speed stereo photogrammetric system was developed and employed. As shown in Figure 6(b), the measuring system consists of paper markers on the cable, two high-speed cameras, an installation stand, and a photograph-processing computer. The frame frequency of camera is up to 100 fps, and the corresponding measuring error is less than 0.1 mm in a 1 m × 1 m area at 2 m distance.
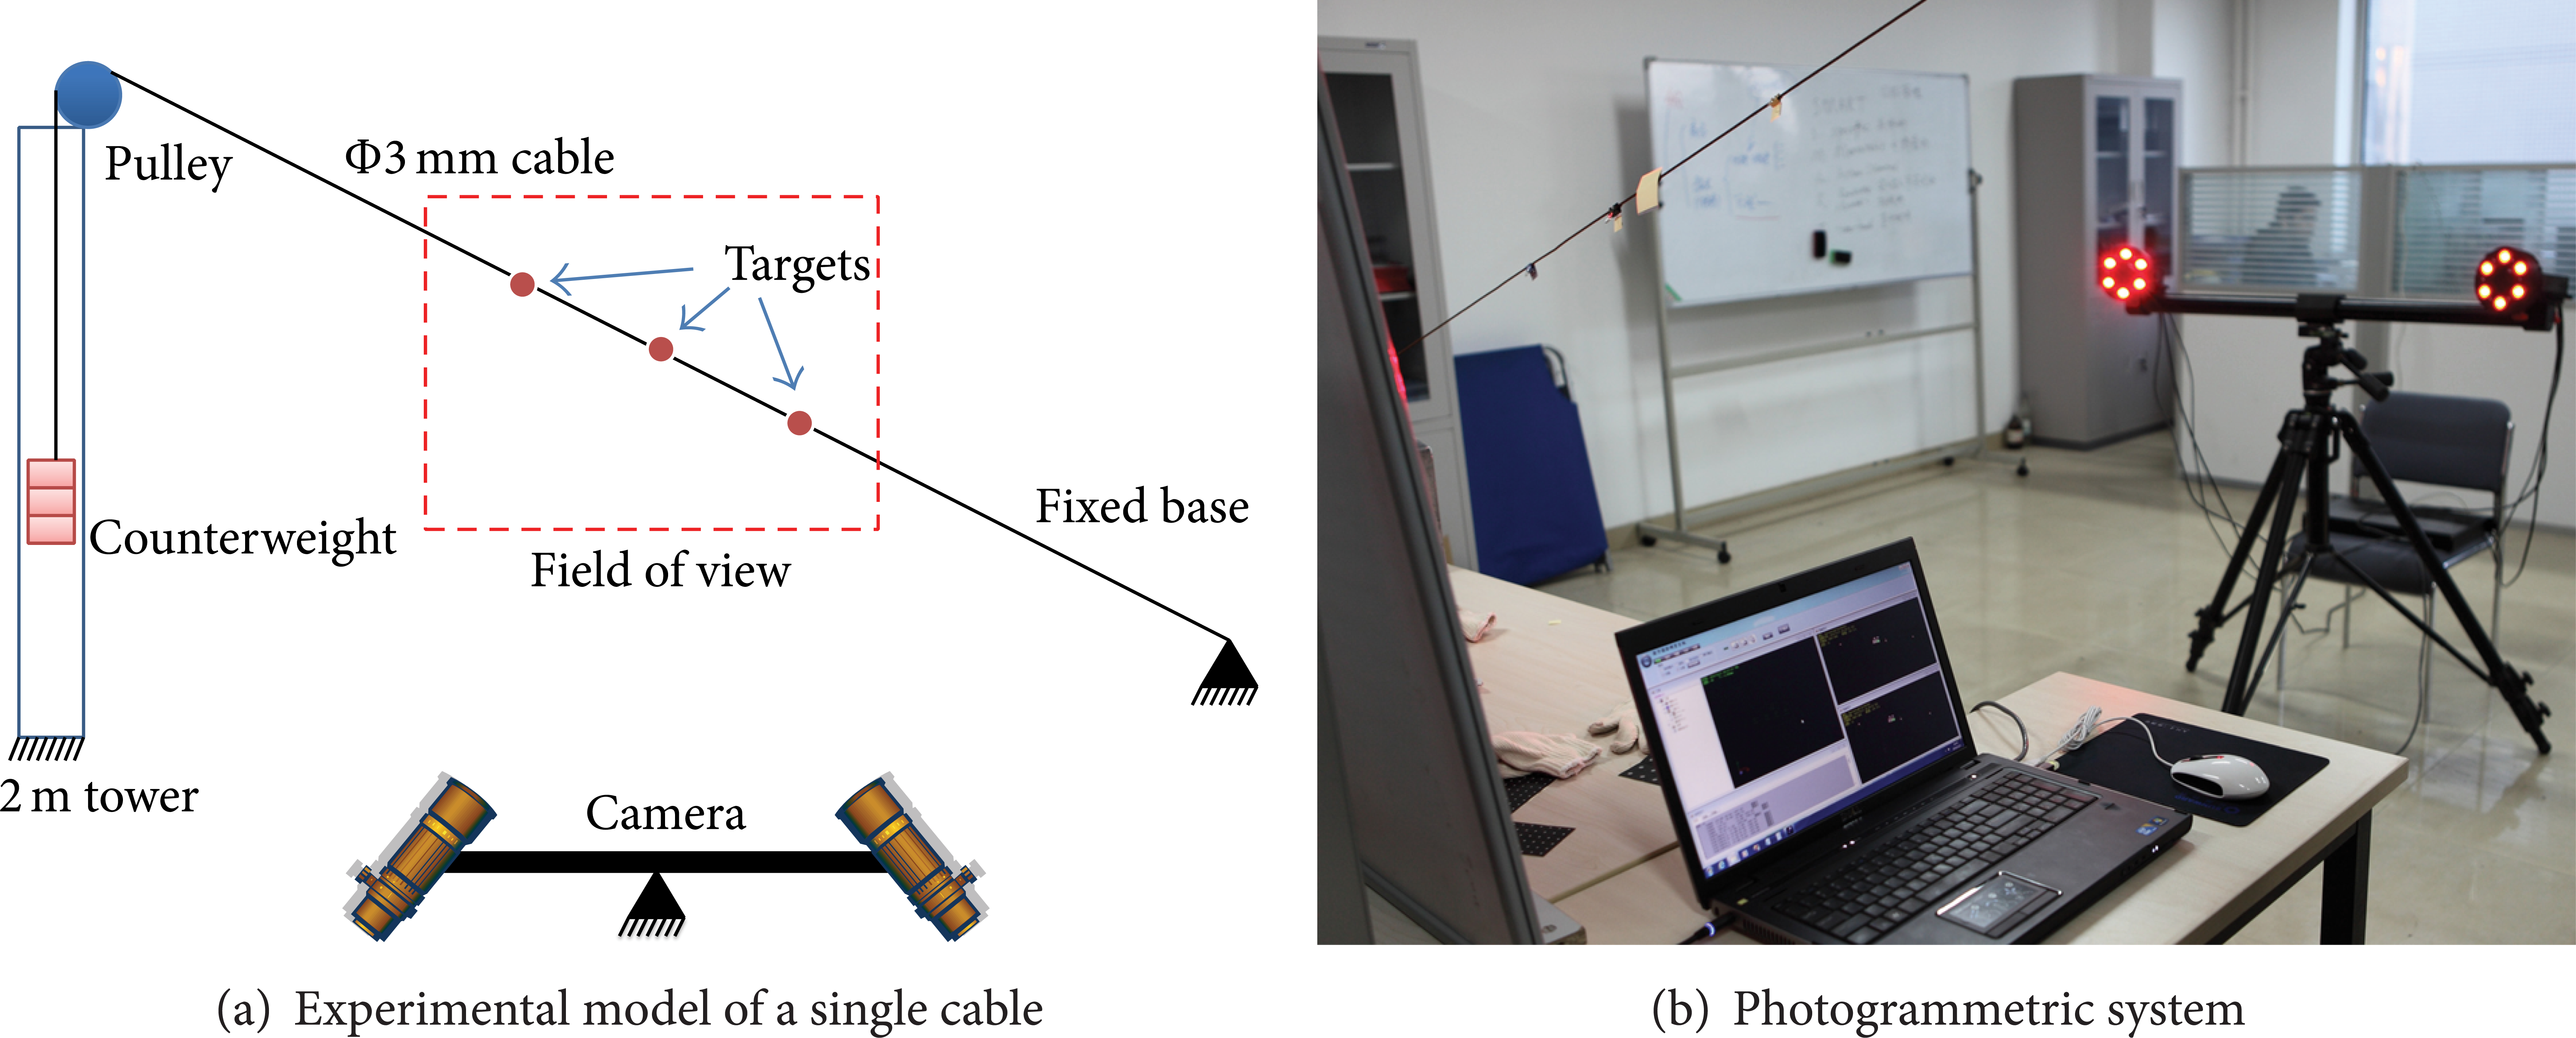
Vibration experiment of a single cable.
The experiment starts with cutting off the string of weight. As free decay vibration of the rope excited, photogrammetric system samples and records the motion of 3 targets simultaneously. As shown in Figure 7, a part of the recorded data having large signal-to-noise ratio is selected and transferred to Matlab. The selected data is used to form [

Free decay response of the rope.
In experiments, ropes of both low tension and high tension were tested. In low-tension case, 8 counterweight blocks are connected to the end of rope. The rope length is 5.1 m and excited vibration frequency is 3 Hz. In high-tension case, 18 counterweight blocks are connected. The rope length is 4.9 m and the excited vibration frequency is 4.4 Hz. To study the damping variation under different amplitude of vibration, the measured data is cut into 4 parts and each part was marked with its start point of data. The results of identification are shown in Figures 8 and 9.

Identified damping ratio of single cable with 8 counterweights.

Identified damping ratios of single cable with 18 counterweights.
The calculating processes of different targets are independent. Obviously, for the same vibrating rope, identified damping ratios from different targets are close to each other, which corroborate stability and reliability of the identification method.
As the amplitude of vibration decreases, the damping ratio will decrease simultaneously. At the beginning of a free decay vibration, a higher damping ratio is observed. The value of damping ratio is gradually decreasing as the start point of signal is increasing. In 8-counterweight case, the damping ratio decreased from 3% to 1.5%, and in 18-counterweight case the decrease is from 0.8% to 0.2%.
As the cable tension rises, vibration frequency will increase, and damping ratio will decrease. Adding counterweights from 8 to 18, the vibration frequency increases from 3 Hz to 4.4 Hz, and the damping value decreases from 3% to 0.8%.
7. Damping Identification of 3 m FAST Cable Suspension Model
There is no possibility to build a 1: 1 model of FAST cable suspension for damping estimation. The only way is using downscaled models. The total plan is measuring damping ratios of models under different scales, which are Φ3 m, Φ10 m, and Φ50 m of the tower distribution circle. The results of identification will be used to estimate the damping level of FAST prototype.
To obtain a preliminary damping estimation, the indoor 3 m model of FAST cable suspension was built. As shown in Figure 10, the model consists of a weight-adjustable cabin, 6 Φ2 mm steel wire ropes, 6 pulleys, 6 AC servomotors controlled by PLC, and a hexagon steel truss to support all of the components. In experiment, the cabin was placed on central equilibrium position and motors were locked. By adjusting the weight of cabin, a light cabin and a heavy cabin were tested to study the damping variation under different mass ratios of cabin to cables. Both cabins suspended by 3 cables and 6 cables were tested to study the contribution of the cable number.

Indoor 3 m model of FAST cable suspension.
High-speed stereo photogrammetric system was used to record the response of cabin in 3-dimensional coordinates. The identified results of modal frequency and damping ratio are listed in Table 3.
Identified modal parameters of the 3 m model.

The modal parameters are calculated by cabin responses along orthogonal X, Y, and Z axis, respectively, but only the results on main vibrating axis are listed. As shown in Table 3, in the case of heavy cabin suspended by 3 cables, only one mode is observed at 1.7 Hz, and the corresponding damping ratio is 1.8% on average; in the case of heavy cabin suspended by 6 cables, 2 modes are observed at 2.6 Hz and 3.4 Hz, and the damping ratios are 12% and 3.2%. Similarly, in the case of light cabin with 3 cables, 2 modes are observed at 1.3 Hz and 2.7 Hz, and the corresponding damping ratios are 4.8% and 4.2%; in the case of light cabin with 6 cables, 2 modes are observed at ~1.8 Hz and 2.4 Hz, and the corresponding damping ratios are 20% and 12%.
A summarized diagram of the identified results is shown in Figure 11. Obviously, by adding 3 more suspension cables to the light cabin, damping ratio increases from 5% to 20%. And in the heavy cabin case, the variance is from 1.8% to 12%. The reason is that adding cables can increase the energy dissipation and reduce the tension of single cable, which will add damping to the system. The result indicates that cable damping is a main contribution for cable-driven system, and adding more cables to the system will increase the structural damping significantly. From the cabin point of view, in 3-cable case, adding weight to cabin decreases the damping ratio from 5% to 1.8%, and in 6-cable case the variance is from 20% to 12%. The reason is that a heavier cabin results in higher cable tension and lower damping ratio, which are in accord with the conclusion of single cable case. Therefore, a lower mass ratio of cabin to cables is beneficial to increase damping.
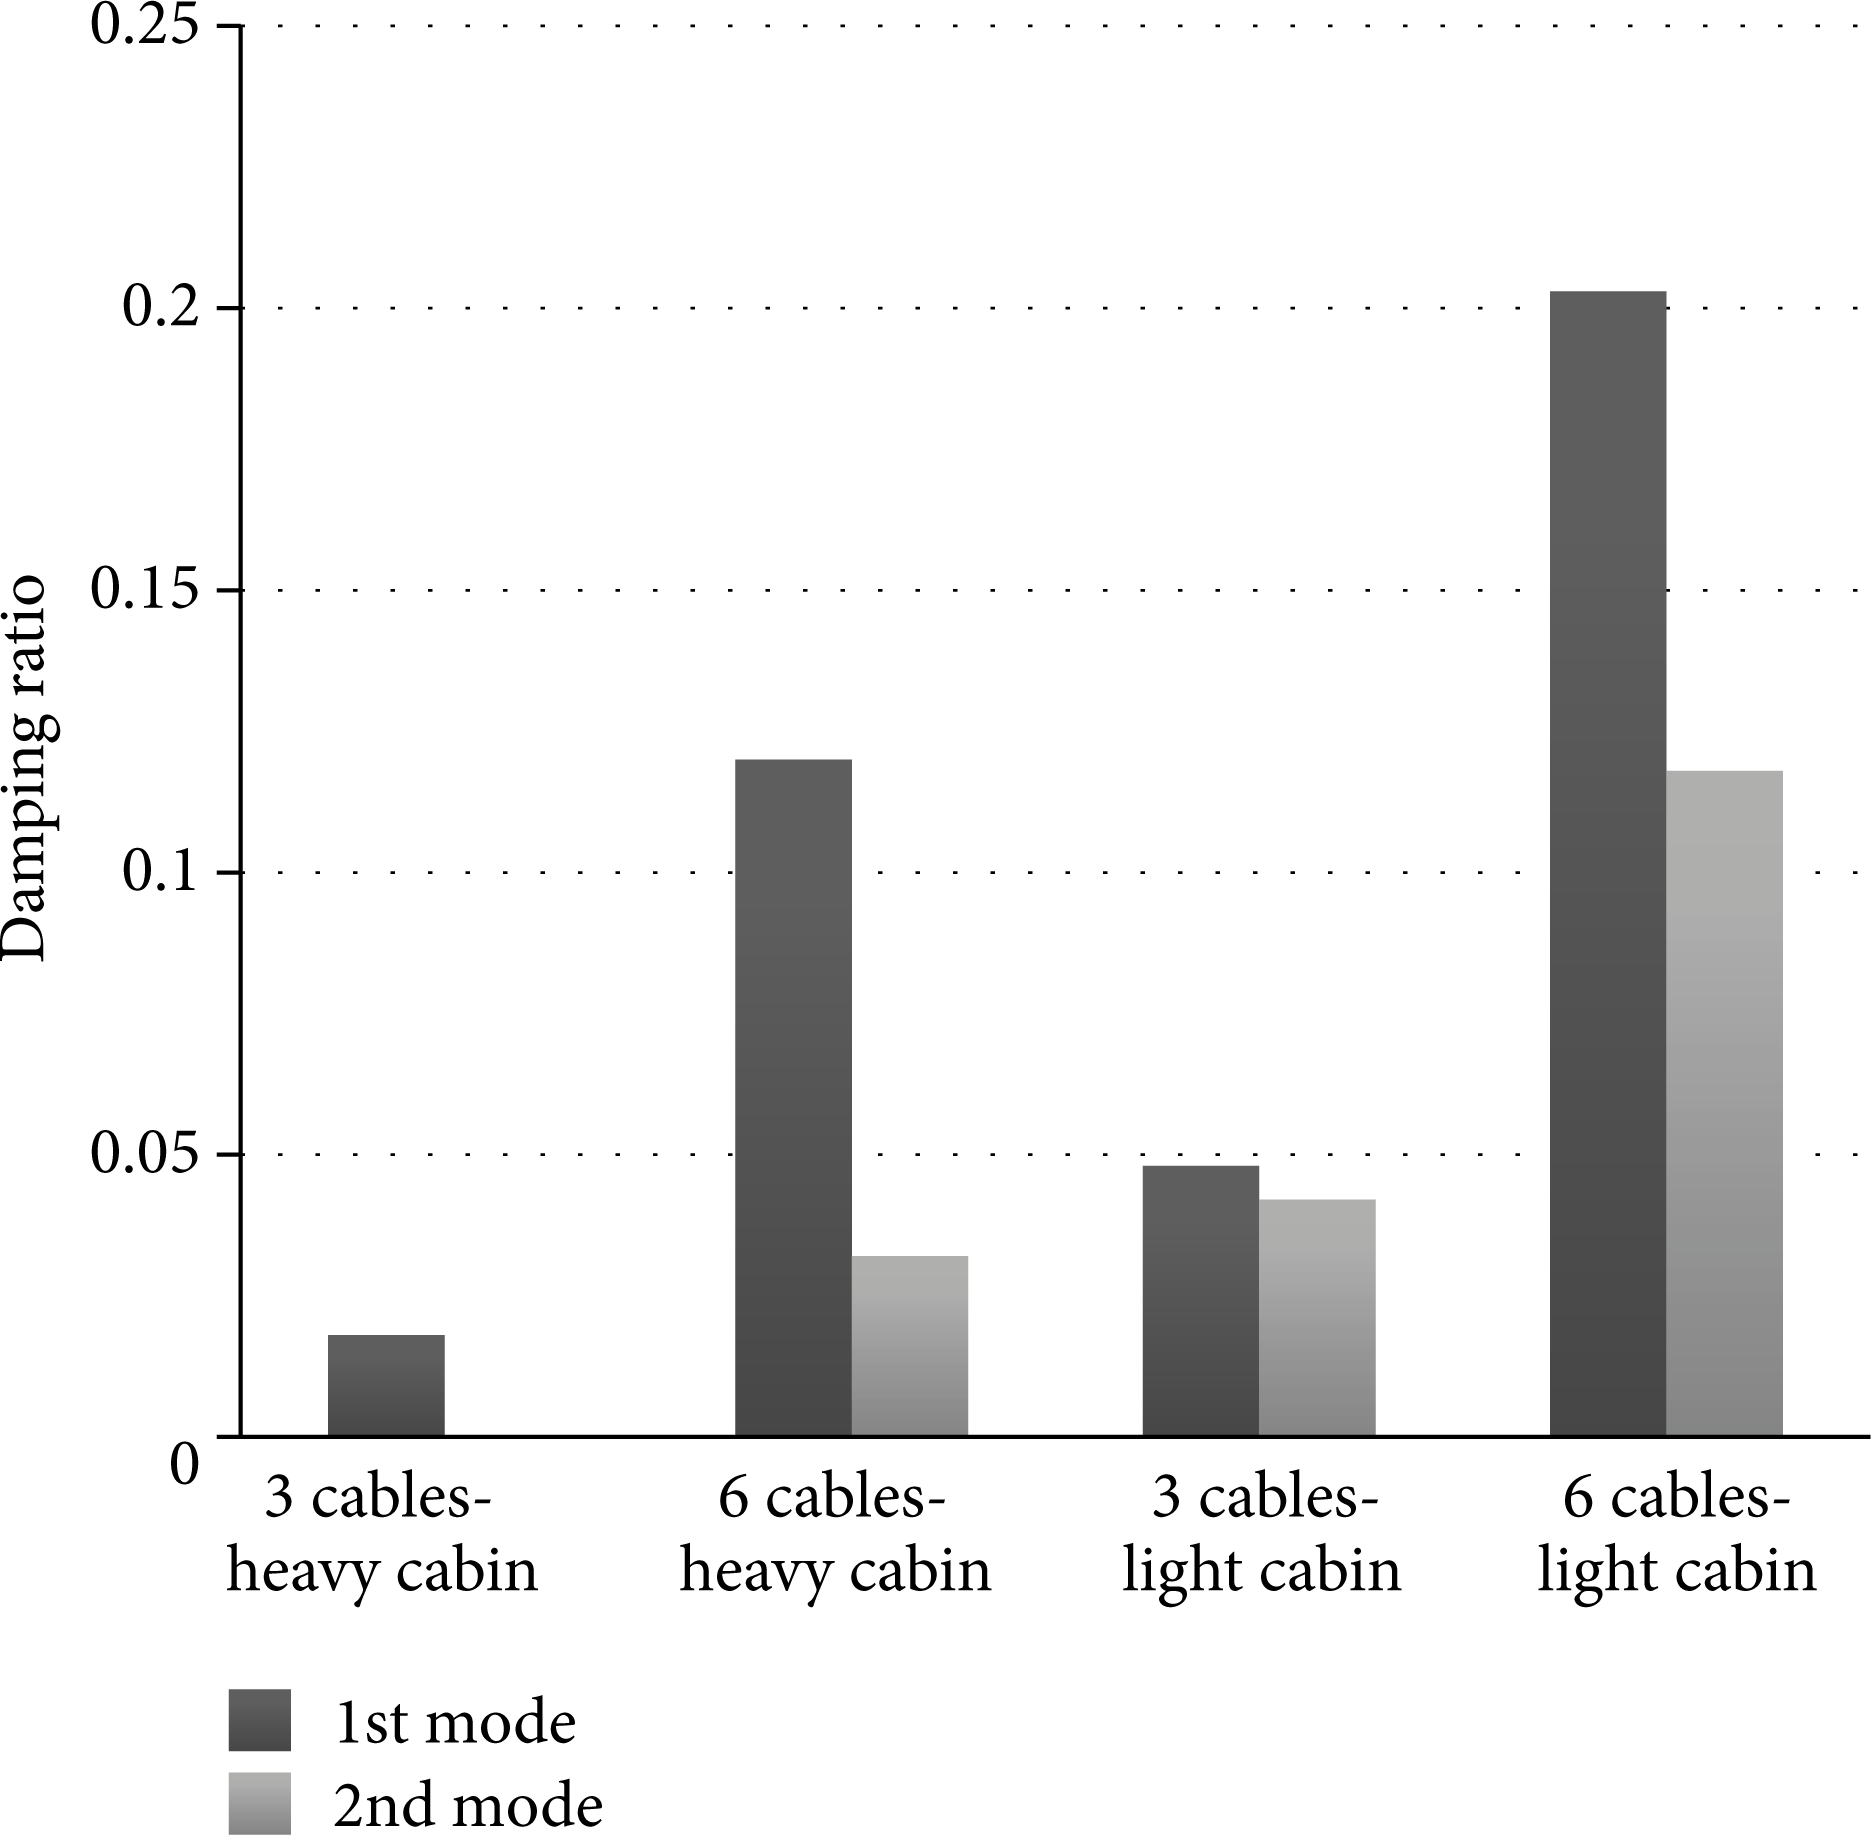
Identified damping ratios of 3 m model under different configurations.
8. Conclusion
In this paper, a practical damping identification method is developed based on ITD method. New conformation method of the eigenmatrix simplifies the requirement of measurement and calculation. By using eigenvector instead of eigenvalue, the proposed method shows advantage in enhanced accuracy of damping identification. To guarantee sufficient and accurate identification, the parameters such as time shift, sampling frequency, and data length should be carefully selected.
Series of vibration experiments are carried out to identify the damping ratio of a single cable and the 3 m model of FAST cable suspension. The analysis indicates that damping of a real system shows nonlinear property and refers to the vibration amplitude. For a certain structure, larger vibration amplitude results in a larger damping value. The damping value will decrease simultaneously as the amplitude decaying. Decreasing the mass ratio of cabin to cable is an effective way to increase the damping of cable suspension system. A lighter cabin or more suspension cables will result in little cable tension, larger vibration amplitude, and more damping value.
Conflict of Interests
The authors declare that there is no conflict of interests regarding the publication of this paper.
Footnotes
Acknowledgments
This work is supported by the Young Scientists Fund (no. 11103046) of National Natural Science Foundation of China and the Young Talent Fund (2011–2012, PI: Sun Jinghai et al.) of National Astronomical Observatories, Chinese Academy of Sciences.