
Abstract
The transport phenomena in a passive direct methanol fuel cell (DMFC) were numerically simulated by the proposed two-dimensional two-phase nonisothermal mass transport model. The anisotropic transport characteristic and deformation of the gas diffusion layer (GDL) were considered in this model. The natural convection boundary conditions were adopted for the transport of methanol, oxygen, and heat at the GDL outer surface. The effect of methanol concentration in the reservoir on cell performance was examined. The distribution of multiphysical fields in the membrane electrode assembly (MEA), especially in the catalyst layers (CLs), was obtained and analyzed. The results indicated that transport resistance for the methanol mainly existed in the MEA while that for oxygen and heat was primarily due to natural convection at the GDL outer surface. Because of the relatively high methanol concentration, the local reaction rate in CLs was mainly determined by the overpotential. Methanol concentration between 3 M and 4 M was recommended for passive liquid feed DMFC in order to achieve a balance between the cell performance and the methanol crossover.
1. Introduction
Direct methanol fuel cells (DMFCs) are electrochemical devices which can directly covert chemical energy into electricity. The passive DMFC is regarded as one of the most promising candidates to power portable devices due to its system simplicity as it has no parasitic power losses caused by the liquid pump or oxidant blower [1–3]. In the operation of a passive DMFC, methanol solution is stored in a small tank, and the cathode side of the cell is directly exposed to the atmosphere. Thus, the supply of methanol solution and oxygen to the reaction sites in catalyst layers is primarily based on the natural convection. In the past two decades, numerous scientists devoted their efforts to the commercialization of the passive DMFC. However, the wide application of this technique is still hindered by many practical problems [4, 5], such as low electroactivity and high cost of the catalyst, methanol crossover, and water management. More efforts should be made to investigate the fundamentals of the passive DMFC system. And computational modeling is a powerful and economical tool to study the intrinsically coupled transport processes in the DMFC which are much more difficult to be studied by the experimental testing.
Many numerical models have been reported for DMFCs. And a few of them focused on the passive DMFCs [6–13]. The continued improvements of these models shed light on the mechanism of inherently coupled transport processes by removing assumptions ever used. Earlier models are mainly single-phase models [9, 14–16]. In recent years, many two-phase models have been developed for DMFCs [6–8, 17–22] which can more realistically reflect the two-phase mass transport processes in the MEA. Ye et al. [7] developed a 2D two-phase model to study the methanol and water crossover in an air-breathing DMFC. Z. H. Wang and C. Y. Wang's two-phase model [18] based on the mixture multiphase flow approach was regarded as a classical numerical model for the active DMFC and was followed by many researchers. In their model, the CLs were treated as interfaces for simplicity. Yang and Zhao [21] presented a two-phase model for liquid feed DMFCs with a microagglomerate model accounting for the transfer process of oxygen from the gas pore to the active sites of the catalyst. This model had the clear physical sense and was easy to be applied in numerical codes. As performance of the DMFC was sensitive to the cell temperature, heat transport was modeled in some papers [9, 12, 23]. In previous studies, the liquid saturation was simply treated as continuously distributed through different layer of the cell. However, when researchers studied the water management issues in DMFC, they revealed a sudden change of liquid saturation at the interface between two different layers [11, 24–26].
GDLs contribute most volume of the MEA and have great effects on cell performance. GDLs are typically made of highly porous carbon cloth or carbon paper. The random overlapping structure of these materials makes the GDL exhibit strong anisotropic transport properties. For example, electrons transfer much faster along the in-plane direction than the through-plane direction. Additionally, inhomogeneous deformation of GDLs under the compression of flow plates will also change species transport properties in it. Up to now, many numerical models for PEMFC [27–33] and active DMFCs [34] considered anisotropic effects of GDLs. Pasaogullari et al. [27] presented a nonisothermal two-phase model for the cathode side of a PEM fuel cell. Their research focuses on the coupled heat and water transport in the GDL. Their results showed that the inherent anisotropy has a great effect on the temperature distribution and water transport. Himanen et al. [28–31] carried out a series of work to study the effect of inhomogeneous compression of GDL. Deformation affected physical properties are tested from experimental rig. Then, coefficients obtained from experimental data were adopted in their numerical models. Calculation of fluid flow their models are limited in single-phase model.
In our former works, we also developed a 2D two-phase transport model for active DMFCs [22]. This model was built on the classical liquid and vapor two-phase flow model in porous media. All layers in the MEA, including the GDLs, CLs, proton exchange membrane (PEM), and the microporous layers (MPLs) were considered as porous media with finite width. We improved this model later by taking account of the anisotropic transfer properties of the GDLs and the detailed multistep reaction mechanism of the methanol oxidation reaction (MOR) in anode CL [34]. Then, this modified model was used to investigate the mass, heat, and charges transport phenomena in the active DMFC [23, 26].
In the present work, we want to extend our numerical model for active DMFC to the passive DMFCs. Several boundary conditions are modified. And the anisotropic transport properties of the GDL, including the inherent anisotropy and deformation of the GDL, are taken into account in the model. A modified agglomerate model is used to consider the transport process of oxygen in cathode CL. The physical fields related to key transport processes, such as distribution of overpotentials, species concentration, local reaction rate, and temperature, are numerically studied.
2. Mathematical Model
A 2D physical domain is sketched in Figure 1(a). It represents the typical seven-layer structure of a MEA in passive DMFC which consists of a pair of GDLs, MPLs, and CLs on both the anode and cathode and a PEM. The MEA is sandwiched between two current collecting plates. Since both channel width and rib width in the current collecting plate are symmetrical with respect to their middle points, only a half-rib width and a half-channel width were considered. Figure 1(b) shows the inhomogeneous deformation of the GDL under the clamping force. The mathematical expressions [28–31, 35, 36] of the deformed surface and the structure-dependent parameters, such as the porosity, permeability, electrical conductivity, and interfacial electrical contact resistance can be found in Table 1. More details on the model development can be found elsewhere [26, 34]. Figure 2 gives computational subdomains of each solving variable. Detailed information of governing equations for solving variables related to the subdomains is given as follows.
Expressions of source terms and coefficients of the governing equations.


Schematic of (a) the computational domain and (b) deformation of the GDL under a clamping force.

Specified computational subdomains for the solving variables.
2.1. Pressures of Liquid and Gas Phases
In the liquid and gas two-phase flow in the MEA of passive DMFCs, pressures are continuous in both in-plane and through-plane directions. The pressure governing equations of liquid and gas phases can be given as


where K x and K y denote absolute permeability of the GDL on through-plane and in-plane direction, respectively. And i m in (2) is the local generation rate of proton in the anode and cathode CLs. In the classical two-phase flow theory in porous media, the liquid-phase and gas-phase pressures are related to the capillary pressure:

where σ and θ c denote the surface tension between liquid and gas phases and the contact angle of the porous media, respectively. The capillary pressure is very sensitive to liquid saturation. The Leverett function, J(s), is commonly employed to account for the effect of liquid saturation on the capillary pressure:

When solving the equations in numerical program, the liquid saturation can be calculated through (3)–(4) after pressures of liquid and gas phases have been obtained from (1)–(2).
2.2. Species Concentrations
The conservation of species transport in liquid and gas phases are, respectively, written as

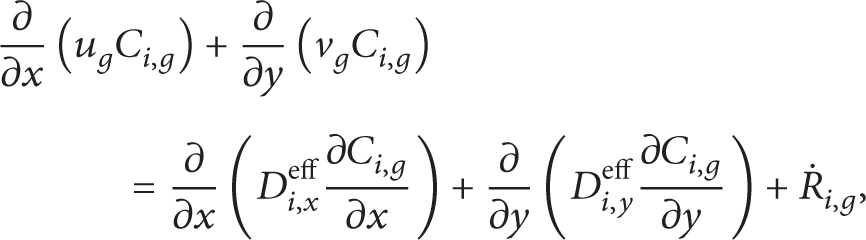
where i in (6) represents different gas species. Note that the velocities of liquid and gas phases can be calculated from the gradient of phase pressures. The diffusion coefficients are expressed as


where the constant α is 0.521 and 0.785 for in-plane and through-plane directions, respectively. Equation (7) is limited in CLs and MPLs. For the calculation of diffusion coefficients in GDLs, the anisotropy of GDLs is considered, and the expression is modified as (8) [37–39].
The nonequilibrium interfacial mass transfer of water and methanol between the liquid and gas phases is also taken into account in the present model. Simply, the interfacial species transfer rates are expressed as follows [20, 40]:

where p W sat and pMVsat, respectively, denote the saturation pressure of water vapor and methanol vapor.
2.3. Heat Transfer
For the heat transfer process through the porous region, the thermal equilibrium between the liquid and gas phases is assumed, the general conservation of energy in the porous regions can be written as

where C
p
,
2.4. Charge Transport
Charges in a passive DMFC include protons and electrons. Governing equations for their transport are given as

2.5. Electrochemical Kinetics
In CLs of the passive DMFC, the Tafel-like expressions are used to describe the kinetics of the methanol oxidation reaction (MOR) and oxygen reduction reaction (ORR):


The modification factor ξO2 in (14) is obtained from the agglomerate model [22]. Overpotentials in (12) and (14) are determined by profiles of solid phase potential and electrolyte phase potential in CLs, which are calculated from (11).

2.6. Current Balance and Cell Voltage
In an operating fuel cell, current balance should be satisfied. The mean current densities at the anode and cathode electrodes are

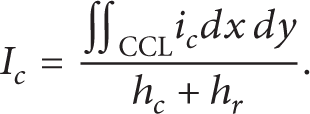
Note that the “parasitic” current density due to methanol crossover, given as I p = 6FN M , is involved in the integration expression in (17). The flux of methanol crossover is calculated from

Hence, the cell output current density and cell voltage can be determined by

Up to this point, all the governing equations have been presented. Detailed expressions of the source terms and coefficients used in these equations are listed in Tables 1 and 2.
Physicochemical properties and parameters used in simulation.

2.7. Boundary Conditions
The boundary conditions at twelve interfaces, shown in Figure 1, should be specified. The conditions at the internal interfaces between adjacent components of the MEA are specified based on the continuity principle and flux balance of mass, charges, and heat. Detailed information about these boundary conditions can be found in our former work [34].
Boundary 1 is the interface between the methanol reservoir and the anode GDL. It is assumed that natural convection controls the methanol transport through this interface, so the boundary condition can be given as

where C M ∞ is the methanol concentration in the reservoir and C M is the methanol concentration at the GDL surface. The natural convection coefficient h M can be obtained from the natural convection correlation on a vertical surface [41]:

where Sh is the Sherwood number and Ra and Sc are the Rayleigh number and Schmidt number, respectively:

Boundary 5 represents the interface between the environment and the cathode GDL. Oxygen in the air transfers through this interface to the GDL. At this boundary, the condition of natural convection mass transport is also adopted:

where the calculation of the natural convection coefficient hO2 is similar to h M but with the physical properties of oxygen.
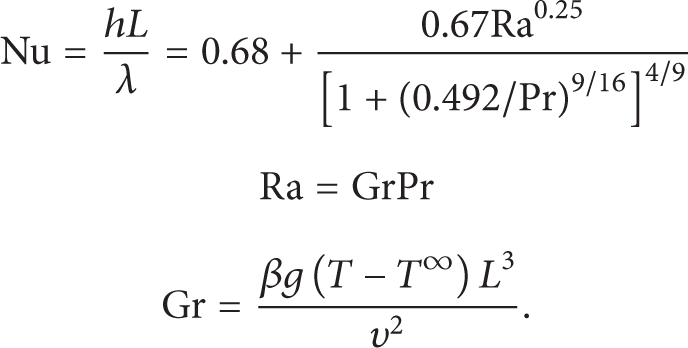
With respect to the boundary conditions for heat transfer, it is assumed that all the heat releases from the cathode electrode to the environment because the thermal resistance at the anode side is much larger. So the boundaries 1 and 2 are specified as thermal isolating boundaries for heat transfer. And conditions at boundaries 4 and 5 are given based on the mechanism of natural convection heat transfer:

where h is the heat transfer coefficient and can be determined from
3. Results and Discussion
Using a self-written computer code based on the finite-volume method, all the governing equations are numerically solved under the baseline operating conditions listed in Table 2. It is noticed that the present model is extended from the DMFC model presented in our previous work [22, 34], in which the details of the model validation against the experimental data can be found. In the following, the model is used to investigate the transport mechanisms in the MEA of a passive DMFC.
3.1. Effect of Methanol Concentration on the Cell Performance
Figure 3 gives the polarization curve of the passive DMFC feed with different methanol concentration. When methanol concentration in the reservoir is below 3 M, the cell performance improves significantly with the increase in methanol concentration. This is because the concentration polarization in the anode electrode caused by the methanol transport plays the dominant role to the cell performance at low methanol concentration. The concentration polarization regions appear apparently on the 1 M and 2 M polarization curves when the cell voltage is below 0.4 V and 0.3 V, respectively. The limiting current density increases from 436 A/m2 to 1154 A/m2 and 2305 A/m2 as the methanol concentration increases from 1 M to 2 M and 3 M. And the highest cell power density upgrades rapidly from 142 W/m2 to 270 W/m2 and 330 W/m2 with methanol concentration varying from 1 M to 2 M and 3 M, as shown in Figure 4. For the cases of moderate methanol concentration (3 M-4 M) and high methanol concentration (5 M), the methanol diffusing to the ACL is sufficient enough for the methanol oxidation reaction (MOR). Thus, no concentration polarization region can be observed on the polarization curves. As methanol concentration increases from 3 M to 4 M, the improvement of cell performance is very limited: increase in current density at 0.1 V from 2305 A/m2 to 2602 A/m2 and increase in the highest power density from 330 W/m2 to only 331 W/m2. When the methanol concentration is higher than 4 M, the cell performance will go down due to the severe methanol crossover from the anode side to the cathode catalyst layer.
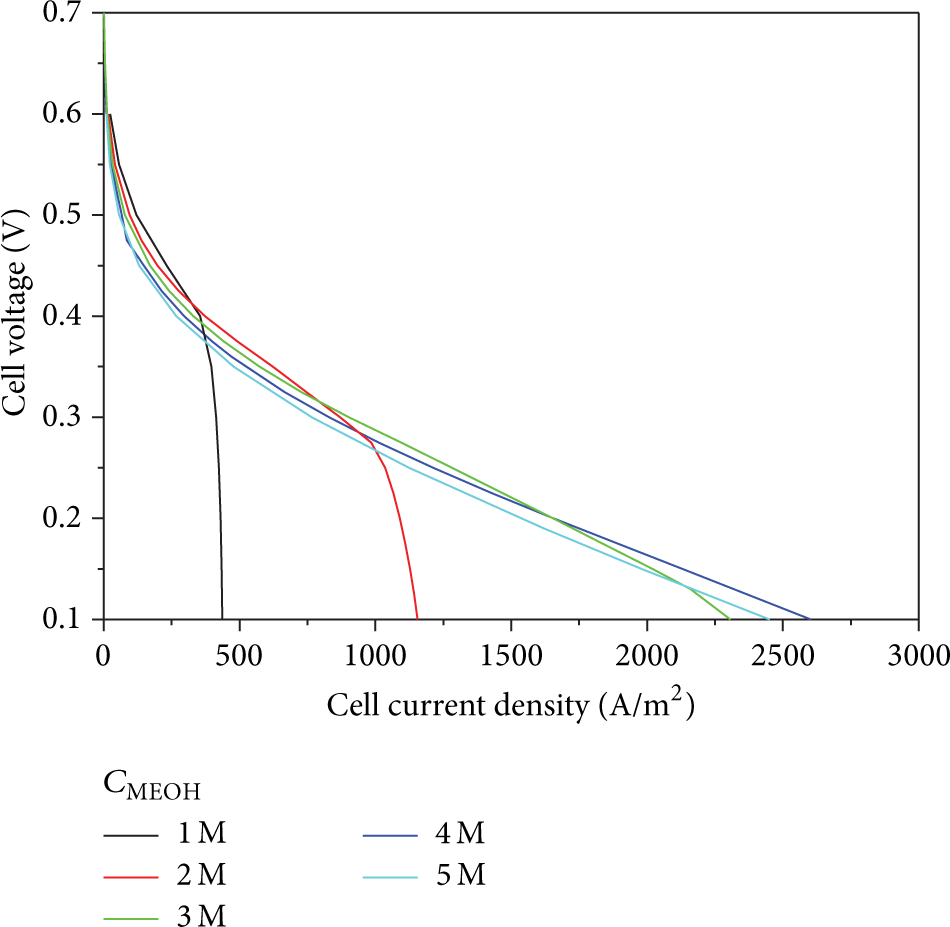
Polarization curve of the passive DMFC for different methanol feeding concentration.

Output power density of the passive DMFC for different methanol feeding concentration.
The methanol permeating through the PEM will directly react with oxygen in the cathode CL, and the reaction rate is represented by the so-called “crossover current density.” It can be seen in Figure 5 that the crossover current density at open circuit condition is approximately proportional to methanol concentration. With the increase in cell current density, the crossover current density decreases sharply when the methanol concentration is below 3 M. At the limiting current density, it even drops to zero because of the mass transport limitation of methanol. When the methanol concentration is higher than 3 M, the decrease in crossover current density becomes slow. And the crossover current density even gradually increases with cell current density when the methanol concentration of 5 M is filled in the methanol reservoir.

Methanol crossover current density of the passive DMFC for different methanol feeding concentration.
For the operation of a passive DMFC, the methanol crossover is a double-edged sword. On the one hand, methanol crossover can lead to a larger mixed potential at the cathode electrode, which results in the reduction of cell voltage and cell performance. It is also a waste of fuel. On the other hand, the directly oxidation of methanol at the cathode CL releases a lot of heat, which makes the cell run at the relatively high temperature level. And the activation of the catalyst upgrades rapidly, tending to improve the cell performance. When the methanol concentration is low (<3 M), the crossover current density is relatively small. The combined effects of mixed potential and temperature are exhibited as an improvement of the cell performance. However, when methanol concentration is as high as 5 M, the crossover current density is too large for the normal operation of the cell. The cell current density and the highest power density both become lower compared with those under low methanol concentration condition, which can be clearly seen in Figures 3 and 4.
In the present study, the temperature at the middle point of the PEM is defined as the operating temperature of the cell. Figure 6 gives the operating temperature of the passive DMFC with methanol concentration varying from 1 M to 5 M. Cell temperature at open circuit condition mainly depends on the methanol crossover rate. So it can be seen that a higher cell temperature at the open circuit condition corresponds to a higher methanol concentration. Generally speaking, the cell temperature increases with the increase in the cell current density. In addition to the heat generated from methanol crossover, the anode MOR and cathode ORR also release a lot of heat. As the cell current density becomes higher, the heat generation from anode and cathode reactions increases significantly. As a result, the cell temperature gradually goes up. For the 3 M case, with the cell current density increasing from 0 A/m2 to 2305 A/m2, the cell temperature increases from 301.8 K to 316.7 K, about 14.9 K increment. The increase of cell temperature for 1 M, 2 M, 4 M, and 5 M is 3.1 K, 7.9 K, 18.0 K, and 18.8 K, respectively.

Operating temperature in the PEM of the passive DMFC for different methanol feeding concentration.
3.2. Distribution of Key Physical Fields in the MEA
The operation of a passive DMFC is sensitive to several key factors, such as the specie concentration, temperature, and liquid saturation. Figure 7 gives the distribution of methanol and oxygen concentrations in the MEA with 4 M methanol concentration in the reservoir and cell voltage of 0.1 V. As natural convection primarily controls the mass transfer process through the out surface of the GDL, the concentration difference can be seen at both the anode and cathode side. Methanol concentration at the out surface of the anode GDL is approximately 3.6 M, 10% lower than methanol concentration in the reservoir. The environment pressure is 101.32 kPa, and the corresponding oxygen concentration is about 8.58 mol/m3. The oxygen concentration at the cathode GDL surface is about 5.5 mol/m3, 35.9% lower than the oxygen concentration in the air. The methanol concentration drops significantly from the GDL to the PEM and from the under-channel region to the under-rib region. Comparing the concentration drop of methanol at the GDL surface with that in the MEA, we can find that the main mass transport resistance for methanol exists in the MEA. And the distribution of methanol concentration along the in-plane direction is extremely nonuniform. This will lead to the nonuniform distribution of local reaction rate of methanol in the anode CL, which is discussed in the next section. And it can also be deduced that the methanol crossover mainly occurs in the under-channel region as the methanol concentration in this region is much higher than that in the under-rib region. In contrast, the distribution of oxygen concentration in the cathode porous layers reflects that the concentration drop of oxygen at the cathode side is much smaller than that at the GDL surface. The largest concentration difference of oxygen at the cathode electrode is about 0.65 mol/m3, far below the 3.08 mol/m3 at the cathode GDL surface. This indicates that the nature convection primarily controls the mass transport of oxygen.

Distribution of (a) methanol concentration at the anode electrode, PEM, and CCL, (b) oxygen concentration at the cathode electrode (cell voltage: 0.1 V).
The distribution of temperature throughout the MEA at 0.1 V and with 4 M methanol concentration is shown in Figure 8. The thermal contact resistance at the adjacent layers is neglected. It can be seen that the highest temperature appears in the under-channel region of the cathode CL. However, the temperature difference in the MEA is very small. The largest temperature difference is about 1 K. So it is reasonable that we use the temperature at the middle point of the PEM to represent the cell temperature. The environmental temperature is 298.15 K. Thus, the temperature difference at the surface of the MEA is relatively large, about 21.5 K.

Distribution of temperature in MEA of the passive DMFC (cell voltage: 0.1 V).
Figure 9 gives the distribution of liquid saturation in the anode and cathode electrode. In order to guarantee the robustness of the numerical model, the liquid saturation at the GDL surfaces of anode and cathode electrode is set as 0.95 and 0.05, respectively. Apparently, in Figure 9, the liquid saturation at the anode side is much higher than that at the cathode side as the cathode GDL directly faces the air. In the anode GDL, the liquid saturation in the under-channel region is higher than that in the under-rib region. This means the transport of methanol and water mainly occurs in the under-channel region of the MEA. Due to the hydrophobic feature of the MPL, the liquid saturation in the MPLs is quite lower than those in other layers. At the cathode side, the volume of pores in cathode electrode is mainly occupied by the gas phase. Even in the cathode CL, the liquid saturation is below 0.1. The liquid saturation in the under-rib region is higher than that in the under-channel region because of the longer transport path.

Distribution of liquid saturation in (a) anode electrode and (b) cathode electrode of the passive DMFC (cell voltage: 0.1 V).
3.3. Analysis of the Coupled Multiphysical Filed in the CLs
The CLs are the key components in a fuel cell. Electrochemical reactions and the transport of species, charges, and heat all occur in these two layers. And these complicated processes are coupled with each other. So the analysis of the coupled multiphysical processes in the CLs can help to understand the mechanism of the fuel cell. As the difference of temperature in the CLs is much small, the reaction rates of electrochemical reactions are mainly determined by three key factors: species concentration, overpotential, and the liquid saturation. The reaction rate in the cathode CL is related to (1. − s), as seen in (14). So, in this paper, we name (1. − s) as “gas saturation” for convenience. In this section, we examine the relations between the local reaction rate and the three key factors.
Figure 10 shows the distribution of local reaction rate of MOR, methanol concentration, overpotential, and liquid saturation in the anode CL. According to the fundamental of the MOR, the reference methanol concentration C M ref in (12)–(13) is set as 100 mol/m3. When the methanol concentration in catalyst layer is higher than 100 mol/m3, the reaction order γ is zero. This means the methanol concentration is high enough to supply adequate reactant for the active sites of the catalyst particles. So the local reaction rate is determined by the other two factors: overpotential and liquid saturation. In Figure 10, it can be seen that the methanol concentration in most area of the anode CL is generally higher than 100 mol/m3 due to the high methanol concentration of 4 M in the reservoir. Only methanol concentration in a very small area (color blue) of the under-rib region is lower than 100 mol/m3. In our former work [22], we have revealed that the local reaction rate in the anode CL of an active DMFC feed with 1 M or 2 M methanol concentration is mainly determined by the local methanol concentration. In the small area in Figure 10 where the methanol concentration is below 100 mol/m3, the same trend can be seen. The liquid saturation in anode CL generally decreases along the x direction and increase along the y direction while the totally contrary trends can be seen in the distribution of overpotential. And the highest local reaction rate appears in an area (color red) where the overpotential and liquid saturation are both on a moderate level.
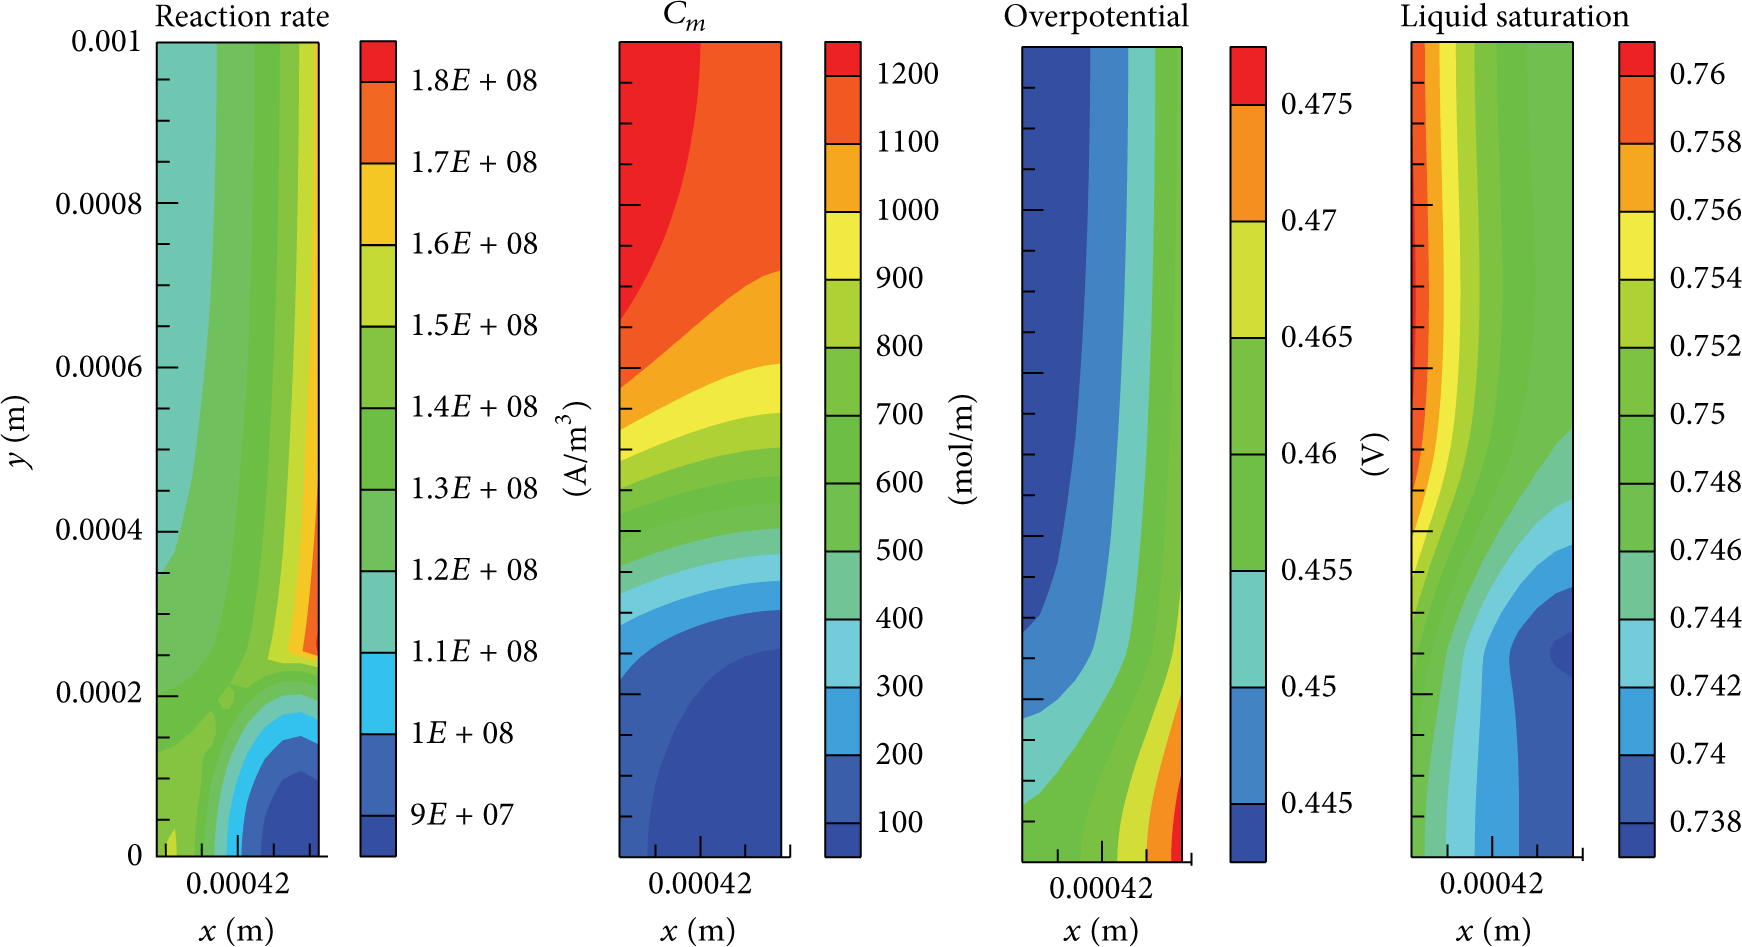
Distribution of local reaction rate, methanol concentration, overpotential, and liquid saturation in ACL of the passive DMFC (cell voltage: 0.1 V).
The distribution of local reaction rate, oxygen concentration, overpotential, and gas saturation in the cathode CL is given in Figure 11. Compared with the physical fields in the anode CL, the distributions of the four physical fields in Figure 11 are relatively simple as they all exhibit the monotonous trends. The variations of gas saturation and the oxygen concentration in cathode CL are quite small and have very limited effect on the local reaction rate. It is clearly seen that the distribution of local reaction rate of ORR is basically determined by the distribution of the overpotential. The very similar distributions of local reaction rate and overpotential can be seen. This phenomenon also greens well with conclusion in our former work [22, 34].

Distribution of local reaction rate, oxygen concentration, overpotential, and gas saturation in CCL of the passive DMFC (cell voltage: 0.1 V).
As a comparison, the distribution of physical fields in anode and cathode CLs at cell voltage of 0.2 V, at which the highest power density is achieved, are given in Figures 12 and 13. As the methanol concentration in all local areas of the anode CL at cell voltage of 0.2 V are higher than 100 mol/m3, it is seen that both the anode and cathode local reaction rate depend on the distribution of overpotential. And it is very interesting that the local reaction rate of MOR in the under-rib region of the anode CL is higher than that in the under-channel region. And this has negative effect on the operation of the passive DMFC as it will aggravate the methanol crossover in the under-channel region.

Distribution of local reaction rate, methanol concentration, overpotential, and liquid saturation in ACL of the passive DMFC (cell voltage: 0.2 V).

Distribution of local reaction rate, oxygen concentration, overpotential, and gas saturation in CCL of the passive DMFC (cell voltage: 0.2 V).
The distributions of local reaction rate in ACL for different methanol concentration at cell voltage of 0.2 V are also compared in Figure 14. It has mentioned in Section 3.1 that mass transport limitation for methanol exists for the operation of passive DMFC with 1 M and 2 M methanol solution. At this condition, methanol concentration in the anode CL dominates the distribution of the local reaction rate of MOR, shown in Figure 14. With the increase in methanol concentration, the effect of methanol concentration on the local reaction rate becomes weak. For the 3 M and 4 M condition, the local reaction rates are mainly determined by the overpotential which responds to the transport of protons in the PEM. Besides that, the local reaction rates in 3 M and 4 M cases distribute more uniform compared to 1 M and 2 M cases. The uniform local reaction rates are beneficial for the high utilization of the catalyst. As a comprehensive consideration of the overall cell performance and the distribution of multiphysical fields in CL, the methanol concentration in reservoir between 3 M and 4 M is recommended to achieve a balance between the cell performance and methanol crossover.

Distribution of local reaction rate in ACL of the passive DMFC for different methanol feeding concentration (cell voltage: 0.2 V).
4. Conclusions
A 2D two-phase nonisothermal mass transport model for a passive DMFC is proposed in the present work with the consideration of the anisotropic transport characteristic and deformation of the GDL. This model is used to simulate the coupled transport phenomena in the MEA. The natural convection boundary conditions are adopted for the transport of methanol, oxygen, and heat at the GDL outer surface. Based on the numerical results, some conclusions are summarized as follows.
The sudden change of species concentration and temperature concentration exists at the outer surfaces of the GDL due to the natural convection mechanism. The transport resistance for the methanol mainly exists in the MEA while that for oxygen and heat is primarily at the GDL outer surface.
When the methanol concentration in the reservoir is relatively high (>3 M), the local reaction rate in CLs is mainly determined by the overpotential and distributes more uniform which can improve the utilization efficiency of the catalyst.
The methanol concentrations between 3 M and 4 M are recommended for the passive liquid feed DMFC in order to achieve a balance between the cell performance and the methanol crossover.
Footnotes
Nomenclature
Conflict of Interests
The authors declare that there is no conflict of interests regarding the publication of this paper.
Acknowledgments
This work is supported by the National Natural Science Foundation of China (51306048), the National Natural Science Foundation of China of International Cooperation Project (51210011), and the Program for New Century Excellent Talents in University (NCET-13-0792).