
Abstract
Sensor grid is a platform that combines wireless sensor networks and grid computing with the aim of exploiting the complementary advantages of the two systems. Proper integration of these distinct systems into effective, logically single platform is challenging. This paper presents an approach for practical sensor grid implementation and management. The proposed approach uses a metamodeling technique and performance analysis and tuning as well as a middleware infrastructure that enable practical sensor grid implementation and management. The paper presents our implementation and analysis of the sensor grid.
1. Introduction
Recently, the concept of sensor grid is gaining attention among researchers [1–4]. Sensor grid is a platform that unifies wireless sensor networks (WSNs) and grid computing infrastructures to enable the collection, processing, sharing, visualization, archiving, and searching of large amounts of sensor data. Grid computing is a conglomeration of geographically distributed, disparate computational, and storage resources interconnected by high-speed networks. In contrast, WSNs consists of a collection of sensor nodes capable of sensing and wireless communication. WSNs are commonly deployed for collection of real-time data about a given environment and physical processes. The main advantage of WSNs is its accessibility, scalability, and flexibility. The advantages of the combined WSN and grid computing (i.e., sensor grid) are that it is capable of collecting, processing, sharing, visualizing, storing, and searching vast amount of wireless sensor data.
Sensor grid makes it possible for sharing of computing resources among geographically distributed groups. The fundamental service model and robust publish-subscribe messaging ability of the sensor grid provides greater management capabilities and scalability than traditional sensor nets as discussed in [5]. Sensor grid can be used for many applications such as healthcare, agriculture, disaster management, and other applications involving analysis and processing of large amount of data in terms of images, video, and audio in a distributed environment.
The main challenge addressed in this paper is how to develop a practical sensor grid platform to enable real-time information gathering, processing, correlating, and sharing efficiently. Integrating the two disparate systems efficiently requires a mechanism that enables each system to work both independently and integratively to achieve the design aims of the integrated system. There are several frameworks that support sensor grid development and deployment. Tham and Buyya introduced some early works in the field by introducing the implementation of distributed information fusion and distributed autonomous decision-making algorithms into the sensor grid community as discussed in [4]. Fan et. al. [6] proposed a solution for the storage of growing sensor data which included, HBase, the Hadoop cloud computing framework for database storage and management, and the Zookeeper for coordination services. Kousiouris et al. [7] proposed the collaborative sensor grid framework that provided a grid builder tool for the purpose of discovering and managing grid services along with distributed sensors which were used in environmental monitoring. Hohwald et al. [8] proposed a distributed-computing architecture that allows for the efficient processing of massive and heterogeneous sensor datasets based on map/reduce. The proposed architecture addressed the challenges of scalability, reusability, and domain independence for constructing user models from large heterogeneous sensor data generated from pervasive environments. The architecture used metamodels to provide a user desired model for designing purposes. Evaluation of performance and scalability of the architecture was measured in terms of number of CPUs and user model size. However, existing frameworks have not been tuned for performance. Also, many of these frameworks do not have components that facilitate the management and visualization as well as flexibility, extensibility, and scalability. Ituen and Sohn [9] have set up a sensor network with wireless sensor motes and have used a monitoring tool such as Moteview to monitor the deployed wireless sensors. In order to utilize the collected sensor data effectively, it must be provided with a grid computing facility. This major disadvantage of sensor data accessibility was rectified through our proposed work.
In this paper, we propose a framework for the design and deployment of efficient sensor grid infrastructure. The sensor grid framework requires a workflow model to visualize the sensor grid setup that is to be implemented. The proposed approach uses a metamodeling technique and performance analysis and tuning as well as a middleware infrastructure that enable practical sensor grid implementation and management. The overall contributions of this paper are as follows.
A workflow model to visualize the sensor grid setup based on a metamodeling technique. An efficient middleware to couple WSN and grid for the collection, storage, and analysis of large set of data. A performance analysis and tuning technique that can provide a proper evaluation of the sensor grid and tune it to meet the needs of the applications.
The rest of the paper is organized as follows. In Section 2, the sensor grid architecture and its components are discussed in brief. Section 3 highlights the performance analysis used for the proposed framework and performance tuning techniques with experimental results. Section 4 provides a brief discussion about the proposed work and its advantages. Section 5 concludes the paper.
2. Sensor Grid Architecture
Figure 1 shows the overall architecture of the proposed sensor grid framework. The proposed sensor grid architecture is based on open geospatial consortium (OGC) protocol [10]. The architecture comprises a data computing grid, a sensor web enablement, a sensor grid middleware, sensor nodes, and end users. The end users can access information about sensor processes through the SWE standards. The SWE component includes encoding and web service standards defined by OGC. Each of the proposed sensor grid system components is discussed in the following subsections.

Sensor grid overall architecture.
2.1. Grid Web Users
The end users can access the features of the sensor grid middleware through the web service interface. The end user applications are agriculture, healthcare, and disaster management. A personalized middleware was designed in [11], which provided an intelligent collection of physiological data for healthcare purposes. The proposed middleware offered medical services to their users through uHealth providers.
2.2. Sensor Nodes
Sensor nodes denote the geographically deployed wireless sensor motes for collecting environmental details such as humidity, light, and temperature. Indriya [12] provided research possibilities in sensor network programming environments, communication protocols, system design, and applications by implementing the sensor network testbed named Indriya. One of the main features of Indriya testbed is that it allows users to schedule the deployed wireless sensors to collect data. It also provided a permanent framework for the development and testing of sensor network protocols and applications. Registered Indriya users interacted with the testbed through a web-based interface based on Harvard's Motelab's interface.
2.3. Data Computing Grid
The data computing grid comprises data grid nodes and the grid interface service. The data grid nodes are used to store and maintain the collected data in a distributed manner. The grid interface service acts as an interface to utilize the data through data grid nodes.
2.4. Sensor Web Enablement
Sensor web enablement (SWE) is a suite of standard encodings and web service defined by OGC. SWE enables discovery of sensors, their processes, and observations followed by tasking of sensors. SWE allows access to observations and observation streams as well as publish-subscribe capabilities for alert system. SWE specifications for interfaces, protocols, and encodings which enable the implementation of interoperable and scalable service-oriented networks of heterogeneous sensor systems and client applications are further classified as encoding and web service specifications as discussed in [13]. Encoding specifications provided by OGC are sensor model language (SensorML), observations & measurements (O&M), and transducer markup language (TML). Web service specifications are sensor observation service (SOS), sensor planning service (SPS), sensor alert service (SAS), and web notification service (WNS). 52° North [14] provided an open source software set based on SWE standards designed to access sensor data through Java web services. It was an initiative sponsored by the Institute for Geoinformatics at the University of Munster, Germany. These Java web services were based on the specifications and data encodings. SWE clients were capable of communicating with services and visualizing observational data through the initiative.
2.5. Sensor Grid Middleware
The main purpose of the sensor grid middleware is to maintain and manage the growing sensor data through scalability. The core components of the middleware are wireless sensor motes, Moteview, MySQL, Hadoop, and user interface as shown in Figure 2.
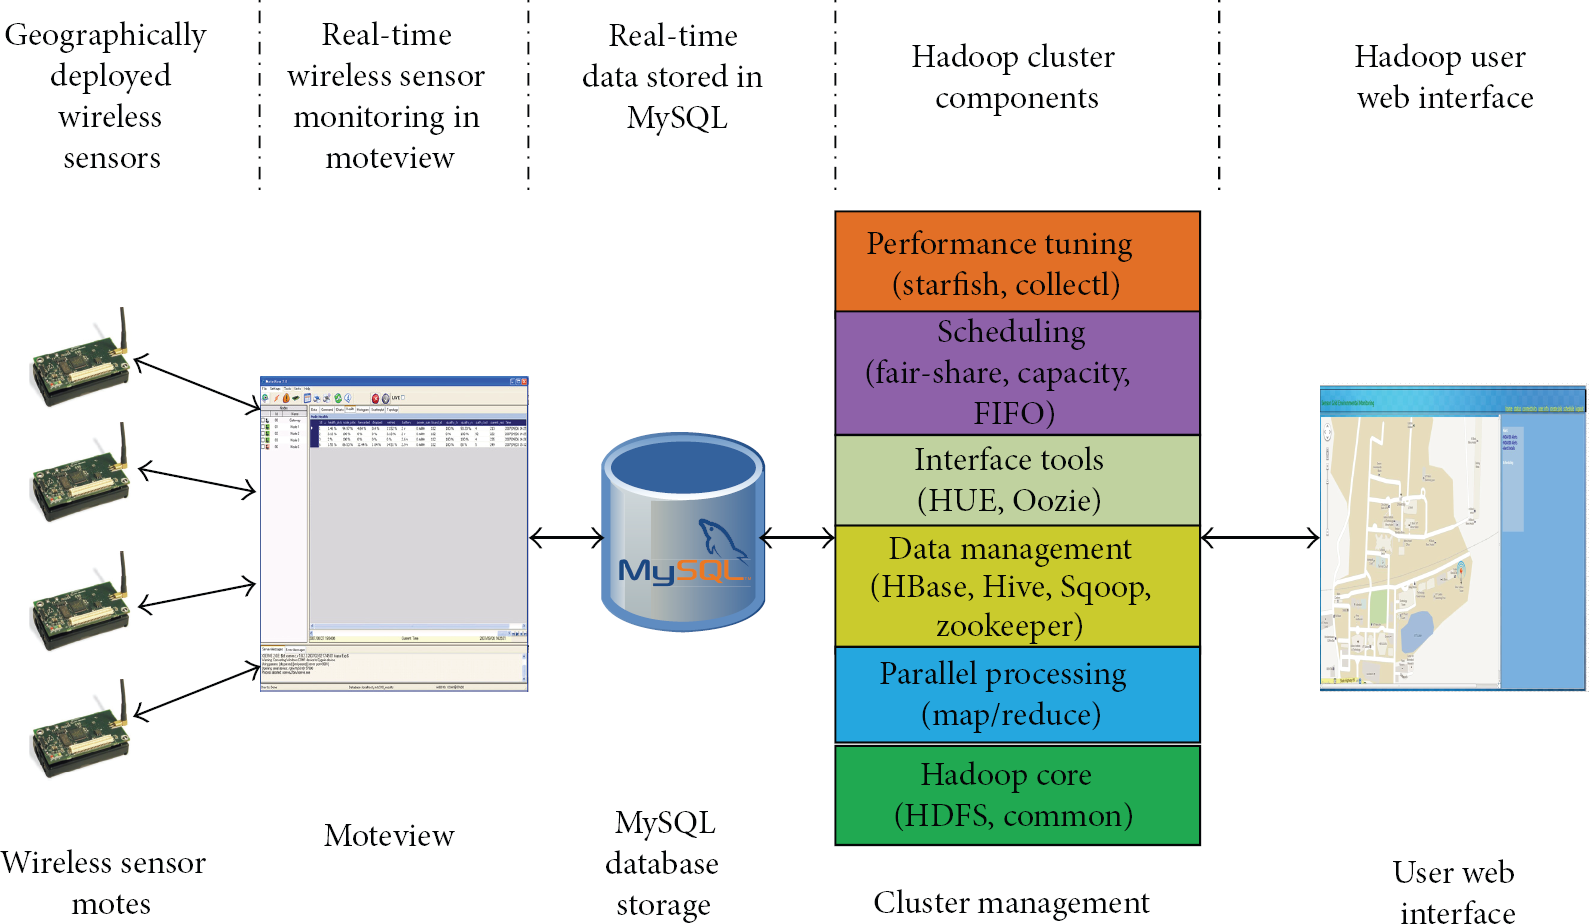
Interpretation of the core components.
In the middleware, Hadoop [15] is used to manage the cluster. The fair share scheduler that comes with Hadoop is used in our case. The wireless sensor network setup consisted of Micaz motes deployed geographically. The Micaz motes collect data such as temperature, light, and humidity. The Moteview is the primary user interface for monitoring the deployed network of wireless sensors. Moteview provide a graphical analysis of the monitored wireless sensors with real-time data. The collected real-time sensor data were stored in MySQL database and then transferred to HBase from MySQL using the Sqoop tool [16]. HBase plays a vital role in storing large scale sensor data [17]. We used a data query mechanism similar to SQL called HiveQL [18]. The user interface provided by the Hadoop framework could not be handled easily by each and every user. In order to ease the user's work, a simple user interface was developed in Java. The web user interface designed for Hadoop provided features such as alerts and scheduling of wireless sensor networks within the sensor grid system.
2.6. Metamodeling
Metamodel is an abstraction of a model, which highlights the model properties and it depends on model driven architecture (MDA) [19]. The metamodeling tool used for representing the abstract of a model is the GME, which is used for domain specific modeling as discussed in [20]. The main reason for choosing the GME tool over others for metamodeling is its advantage in reusability of the generated workflow model rather than beginning from scratch. Metamodeling acts as a preprocess for sensor grid middleware implementation by providing metamodel for the sensor grid workflow. Figure 3 shows the workflow model for the sensor grid framework generated using the GME modeling tool. It depicts a rough sketch for the sensor grid framework which serves as an initial step in the implementation of this model in real-world applications. The workflow from metamodeling acts as a front end to develop the sensor grid application. Due to the reusability factor of metamodeling workflows, the sensor grid application can be altered by adding or removing features based on user requirements. The metamodeling process is based on the open standard protocols provided by open GIS consortium (OGC) [21, 22] for interoperability and integration facilities for the sensor grid.

Generated result from GME.
2.7. Performance Analysis and Tuning
The performance of the system is analyzed using the evaluation metrics such as total runtime and CPU time. Based on the performance analysis, the performance tuning is used to tune the system to provide better and efficient results. The performance tuning techniques that can be used to improve the system performance are code optimization, load balancing, caching strategy, distributed-computing, and self-tuning. In this work we used starfish and collect tools from Hadoop [15] for performance tuning. Starfish is a tool which does autotuning for the configurations in Hadoop based on the load, data, cluster, and so forth and provides the best performance [23]. It provides three levels of tuning with a what-if engine, optimizer, scheduler, and a data manager. The collectl tool is a performance monitoring and benchmark tool that monitors a broad set of subsystem performance. We used collectl to gather CPU usage details on each node of the cluster.
2.8. User Interface
The user interface written in Java provides a simple and easy way of accessing sensor data information. The two features made available are scheduling and alerts.
3. Performance Analyses
3.1. Testbed Environment
The testbed environment consists of the micaz motes, MDA100CB sensor motes for measuring temperature, MDA300CA for measuring humidity, MIB520 is a gateway for connecting these sensor motes with a system through USB, and an HP workstation for monitoring and storing collected sensor data. There were totally 8 micaz motes which send data to a database managed by Moteview through micaz USB base station. The cluster configuration is comprised of four nodes, including one master and three slave nodes. Each node runs an Ubuntu 11.04 operating system with 4 GB ram and 4 core CPUs each. The micaz motes with MDA100CB/MDA300CA sensors collected the temperature and humidity data and sent it to the system through MIB520 gateway. The collected data were stored in MySQL for later use in Hadoop framework's HBase. Hadoop cluster consisted of one master node and three slave nodes. The data was stored as regions within HBase which was split between the master and slave nodes for processing. With a user interface, users can schedule the sensor motes for alert or the user can collect the historical data of the sensor motes for reference.
3.2. Workload
We used two scenarios with 25000, 50000, 75000, and 100000 rows of data stored in HBase database. Scenarios I and II deal with the evaluation metrics such as total runtime and CPU time, respectively. Both the scenarios are discussed in detail under Section 3.4.
These scenarios require queries to test the functionality of Hadoop setup. In our case, the four queries used for performance analysis are shown in Table 1. Table 2 depicts details for each query or map/reduce job with their total runtime and CPU time shows the values obtained by running the four types of queries with respect to increase in number of rows.
Queries used for performance analysis.

Queries with their total runtime and CPU time with respect to rows.

Note: CPU time—8821 ms is rounded off to 8.8 ms.
3.3. Performance Metrics
The evaluation metrics used for performance analysis were CPU time and total runtime of a sensor similar to the analysis performed in [24]. CPU time represents the amount of CPU time consumed by the map/reduce job to complete the job and total runtime represents the total time taken from the map/reduce job to complete within the Hadoop cluster. The coefficient of variation, CV, for the total running time t can be derived based on the standard deviation σ and the mean μ for total number of nodes N as follows as discussed in [25]:

3.4. Performance Analysis
Scenario I. The experimental setup for scenario I comprised the Hadoop cluster with one master and three slave nodes. Sensor data were stored using HBase which was integrated with a Hive query mechanism to enable SQL-based query from HBase tables. Four types of queries used for the analysis purpose of the Hadoop framework are given in Table 1. Scenario I shows the performance comparison of the four queries with respect to the total runtime of each query.
The graph in Figures 4(a), 4(b), 4(c), and 4(d) shows the comparison of total runtime for four queries, namely, Avg. temp, count, max temp, and distribute with respect to increase in number of rows. Each query was executed four times, and the total runtime for the query each time was collected for tabulation, as shown in Table 2. In order to test the performance of the Hadoop framework, each query was executed against increasing number of rows, as shown in Table 2. The graphs depict that with an increase in the number of rows, the query or a map/reduce job consumes more time to complete the map/reduce job. In other words, the total runtime of a map/reduce job increases with an increase in the number of rows in the table to be queried.

Query versus total runtime (Sec). (a) Average temperature, (b) count, (c) maximum temperature, and (d) distribute.
The graph shows irregularity of job completion time, even when the query and total number of rows in the database are unchanged. The main reason for such irregularity in the graphs for a total runtime of a map/reduce job might be caused due to factors such as workload, increase in the number of processes, and node unavailability due to hardware problems on the cluster node that executed the map/reduce job. Such problems can be managed by using a proper cluster monitoring technique that alerts the user with user-defined triggers such as when a node is down and when the number of processes exceeds the trigger limit.
Scenario II. The experimental setup for scenario II was similar to that of the Scenario I. The main difference between these two scenarios was that Scenario I analyzed the Hadoop framework performance with respect to the total runtime of the map/reduce job, whereas the Scenario II analyzes the Hadoop framework with respect to total CPU time consumed for the map/reduce job. The graph in Figures 5(a), 5(b), 5(c), and 5(d) shows the comparison of CPU time consumed for four queries, namely, Avg. temp, count, Max temp, and distribute as given in Table 1 with respect to increase in number of rows. The graphs depict that with an increase in the number of rows, the query or a map/reduce job consumes more CPU time to complete the map/reduce job. In other words, the CPU time consumed for a map/reduce job increases with an increase in the number of rows in the table to be queried.

Query versus CPU time (ms). (a) Average temperature, (b) count, (c) maximum temperature, and (d) distribute.
The increase in the number of rows affects the performance of the cluster in terms of total running time and CPU time of the map/reduce job. One of the main reasons for such irregularity in graphs might be due to heterogeneous nodes within the cluster. But the Hadoop cluster setup consists of each node with equal processing capability and memory. The other reasons for irregularity in the graphs for CPU time for a map/reduce job are the same as the factors such as workload, increase in the number of processes, and node unavailability due to hardware problems on the cluster node which executed the map/reduce job. In order to overcome such a drawback due to workload or increase in the number of processes, the problematic map/reduce job must be tuned. The strategy to overcome the performance issue is discussed in Section 3.5. The node unavailability issue can be managed by using cluster monitoring techniques but in this case we are concentrating on the other two issues using a tuning tool such as starfish.
3.5. Performance Tuning
We used starfish tool to optimize the execution of the map/reduce job. The main advantage of starfish is that it performs in-depth job analysis with profiles, predicts the behavior of hypothetical job executions, and optimizes arbitrary map/reduce programs. Starfish's what-if engine shows that adding a new node to the Hadoop cluster can provide better results. In order to improve Hadoop performance, a new node was added to the existing Hadoop cluster. The results of tuning are shown as the graph in Figures 6(a), 6(b), 6(c), and 6(d) with respect to the total runtime evaluation metric.

Query versus total runtime (Sec) after tuning. (a) Average temperature, (b) count, (c) maximum temperature, and (d) distribute.
Figures 6(a), 6(b), 6(c), and 6(d) show the decrease in total runtime for each query after tuning when compared to the total runtime before tuning. The tuning technique provided better results when compared with before-tuning graphs. In this case, better and stable results were produced due to the addition of a node to the Hadoop cluster as per the starfish's what-if engine strategy. The proper characterization of Hadoop jobs can also provide better results as discussed in [26].
4. Discussion
In comparison to Table 3, which shows the features implemented in past works, our methodology proves to be effective in implementing all the features as a whole whereas those past works implements only part of the features. The advantages of the features implemented will prove the significance of our methodology.
Comparison of past works with the proposed work based on their implemented features.

Table 3 shows the list of related works based on the implementation features such as metamodeling, Hadoop, HBase, performance analysis factors, and performance tuning. The proposed methodology in this paper implements all the features listed when compared to other works.
The advantages of the proposed sensor grid framework are as follows. (1) Use of GME for metamodeling provides a workflow of the proposed sensor grid framework. (2) The Hadoop framework provides a platform for sensor grid to manage data within the grid system. (3) Hadoop's map/reduce engine allows effective processing of sensor data within the sensor grid system. (4) The use of HBase, a distributed column-oriented database, allows storage of large scale sensor data. (5) Hive integration with HBase allows SQL-like query structure rather than a complex HBase query. (6) Performance tuning tools such as starfish allows map/reduce job optimization in order to provide better results.
The summary of our methodology is as follows. Sensor grid architecture was proposed based on the OGC standards. The metamodeling tool, namely, GME was used to generate a model for the proposed sensor grid framework which served as a model for implementing real world applications. The specifications of the OGC's SWE standard were discussed. Real-time wireless sensor data collected through Moteview were stored in MySQL and later imported into HBase using Sqoop in order to use with Hadoop. The open source framework Hadoop was implemented as the sensor grid middleware and its other components such as HBase, hive, and schedulers were discussed. Performance analysis was done in the implemented Hadoop framework based on evaluation metrics such as total runtime and CPU time. The performance analysis of the sensor grid framework shows irregularities due to workload on a node in the cluster, number of processes running, and cluster node unavailability. Such irregularities can be reduced by implementing a proper cluster monitoring system which sends alerts to the user during these situations. Performance tuning tool such as starfish with a brief discussion and how it manages to tune the Hadoop framework performance has been discussed. The combination of metamodeling, OGC standards, and sensor grid for the first time is the main significance of our methodology. Our methodology has implemented the rapidly growing Hadoop framework as a sensor grid middleware along with the metamodeling technique based on OGC standards.
5. Conclusions
In this paper, a sensor-grid architecture is proposed. The proposed architecture demonstrates the efficiency, effectiveness, and feasibility of implementing wireless sensor grid services based on the open geospatial consortium standards. The Hadoop framework implemented in the sensor grid network had the capability of withstanding hardware failures when compared to existing grid middleware due to its scalability, accessibility, and robustness. The performance of the proposed architecture was analyzed based on evaluation metrics such as total runtime and CPU time with respect to increase in the number of data read rows. The performance tuning tools such as collectl and starfish were used to collect system data, while Hadoop executed a map/reduce job and to enhance map/reduce job optimization through profilers and what-if engines, respectively. Future work can be done by providing advanced security mechanisms and applying different evaluation metrics for performance analysis and optimizing the map/reduce job accordingly. Also, an efficient cluster monitoring technique can avoid performance deflection of sensor grid framework in future.
Footnotes
Conflict of Interests
The authors declare that there is no conflict of interests regarding the publication of this paper.
Acknowledgments
This research was supported by the Basic Science Research Program through the National Research Foundation of Korea (NRF) funded by the Ministry of Education, Science and Technology. (Grant no. 2011-0011507). This work is a part of a funded project sponsored by DST (NRDMS), New Delhi, India.