
Abstract
A hydraulic design method of three-dimensional blade was presented to design the blades of the rotodynamic multiphase pump. Numerical simulations and bench test were conducted to investigate the performance of the example impeller designed by the presented method. The results obtained from the bench test were in good agreement with the simulation results, which indicated the reasonability of the simulation. The distributions of pressure and gas volume fraction were analyzed and the results showed that the designed impeller was good for the transportation of mixture composed of gas and liquid. In addition, the advantage of the impeller designed by the presented method was suitable for using in large volume rate conditions, which were reflected by the comparison of the head performance between this three-dimensional design method and another one.
1. Introduction
With the exploitation of the offshore oil and remote oilfields, gas-liquid multiphase technology has attracted attention of the world's major oil companies for its significant economic benefits. In recent years, some technologies have emerged, for example, gas-oil mixture pumping [1, 2]. So far, several kinds of positive displacement and rotodynamic multiphase pump have emerged for gas-liquid multiphase flow in the petroleum industrial processes.
The rotodynamic multiphase pump which has larger flow and higher sand toleration is predicted as the ideal choice of the oil exploitation in the subsea [3]. Large numbers of rotodynamic multiphase pumps have been installed all over the world since the first pump was tested successfully in the oil field in the early 1990s [4, 5]. However, the state of fluid flow in the impeller of a multiphase pump is complicated and the two-phase flow regime is greatly influenced by the flow rate of the mixture and inlet gas volume fraction (IGVF) as well as the pump speed. Because of these reasons, new requests and challenges have been put forward for designers.
With regard to the design method of the multiphase pump impeller, the velocity coefficient method and the similarity design theory were used [6–12]. The former method depends heavily on the designers’ knowledge and experience, and the latter needs impeller models with excellent performance. Given that most studies of this kind of pump have so far suffered from a lack of large-scale empirical data, the latter method is not popular. Based on this reason, a new method is proposed to design the blades of the impeller of a rotodynamic multiphase pump in this paper, in which, the gas-liquid two-phase meridional velocity gradient equation and the two-phase coupled equations solved by a quasiorthogonal method are deduced. The medium is the gas-liquid multiphase flow, and the blade mean camber line equation is integrated with the point-by-point integral method, which ensures that the blade shape satisfies the gas-liquid two-phase flow pattern as well as enhances the rationality of the flow passage of impeller. The blade in this paper is calculated by 20~30 stream surfaces; it ensures the smoothness and accuracy of the blade transition between impeller shroud and hub.
2. Main Design Parameters of the Impeller and Blade
A multiphase pump, mainly rotodynamic multiphase pump, is a kind of multistage pump which includes the suction unit, the compression cells and the exit unit [13], as is shown in Figure 1. A compression cell, which is also called one stage, is composed of an impeller and a diffuser. Gas-liquid mixture gains kinetic energy when it flows through the impeller. When the mixture flows through the diffuser, its speed will drop and part of the kinetic energy will be converted to pressure energy. The structure of the impeller is shown in Figure 2.
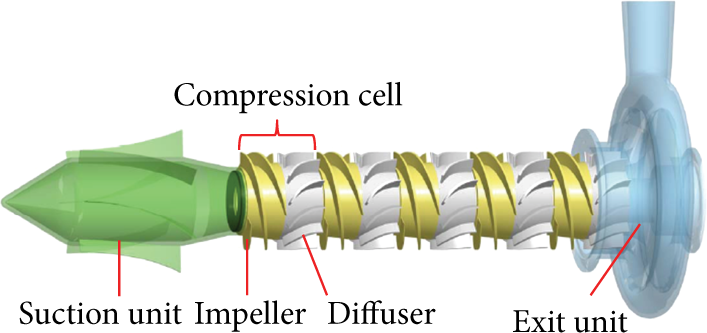
Flow passage of a rotodynamic multiphase pump.
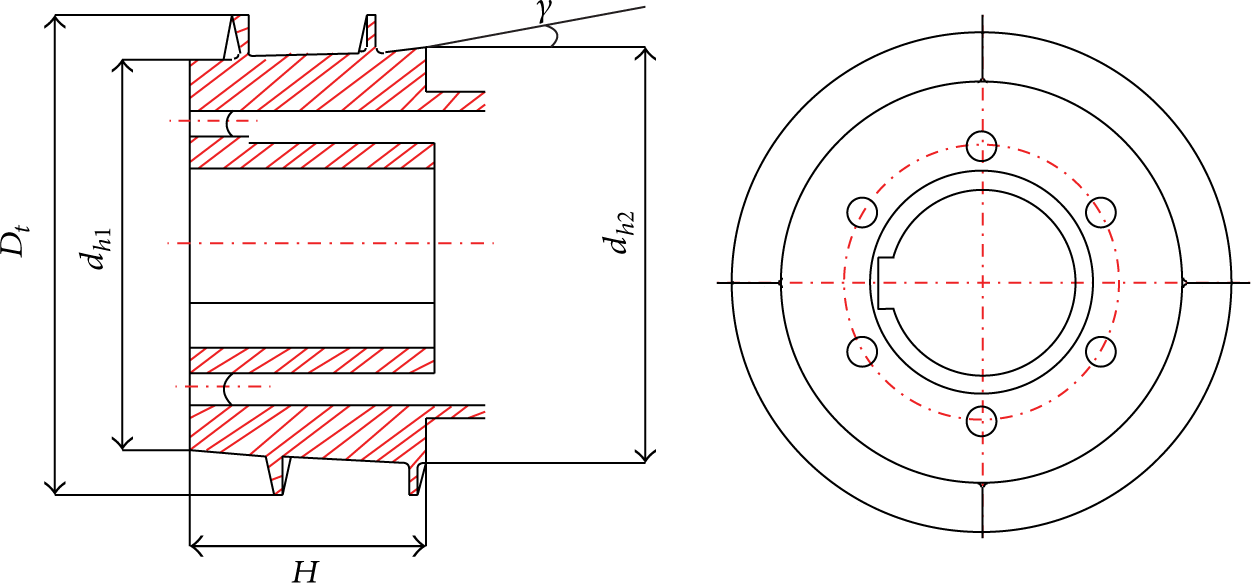
Impeller of a rotodynamic multiphase pump.
Some main parameters which will influence the geometric construction of this pump impeller are the diameters of hub at inlet and outlet (dh1 and dh2), the hub ratio at inlet (dh1/D t ), the cone angle of hub (2γ), the diameter of shroud D t , the axial length of impeller (H), blade inlet angle β1, blade outlet angle β2, the number of blades, the wrap angle of the blade, and so on.
3. Hydraulic Design of Impeller
In order to design the blade of the multiphase pump impeller, the 3D blade design method is adopted. From the numerical solution of the meridian flow net on the meridional plane and blade mean camber lines on the stream-surfaces of revolution, the blade shape is obtained. The new hydraulic design method of multiphase pump impeller is shown in Figure 3.

Design procedures of impeller blades.
3.1. The Axial Profile of the Impeller Blade
The axial profile of the impeller blade has a great influence on the flow ability of multiphase pump, so it is the key point in the process of the reasonable design. The axial profile designed in this paper is shown in Figure 4. One obvious characteristic is that the cross section gradually reduces for the compressibility of the medium.
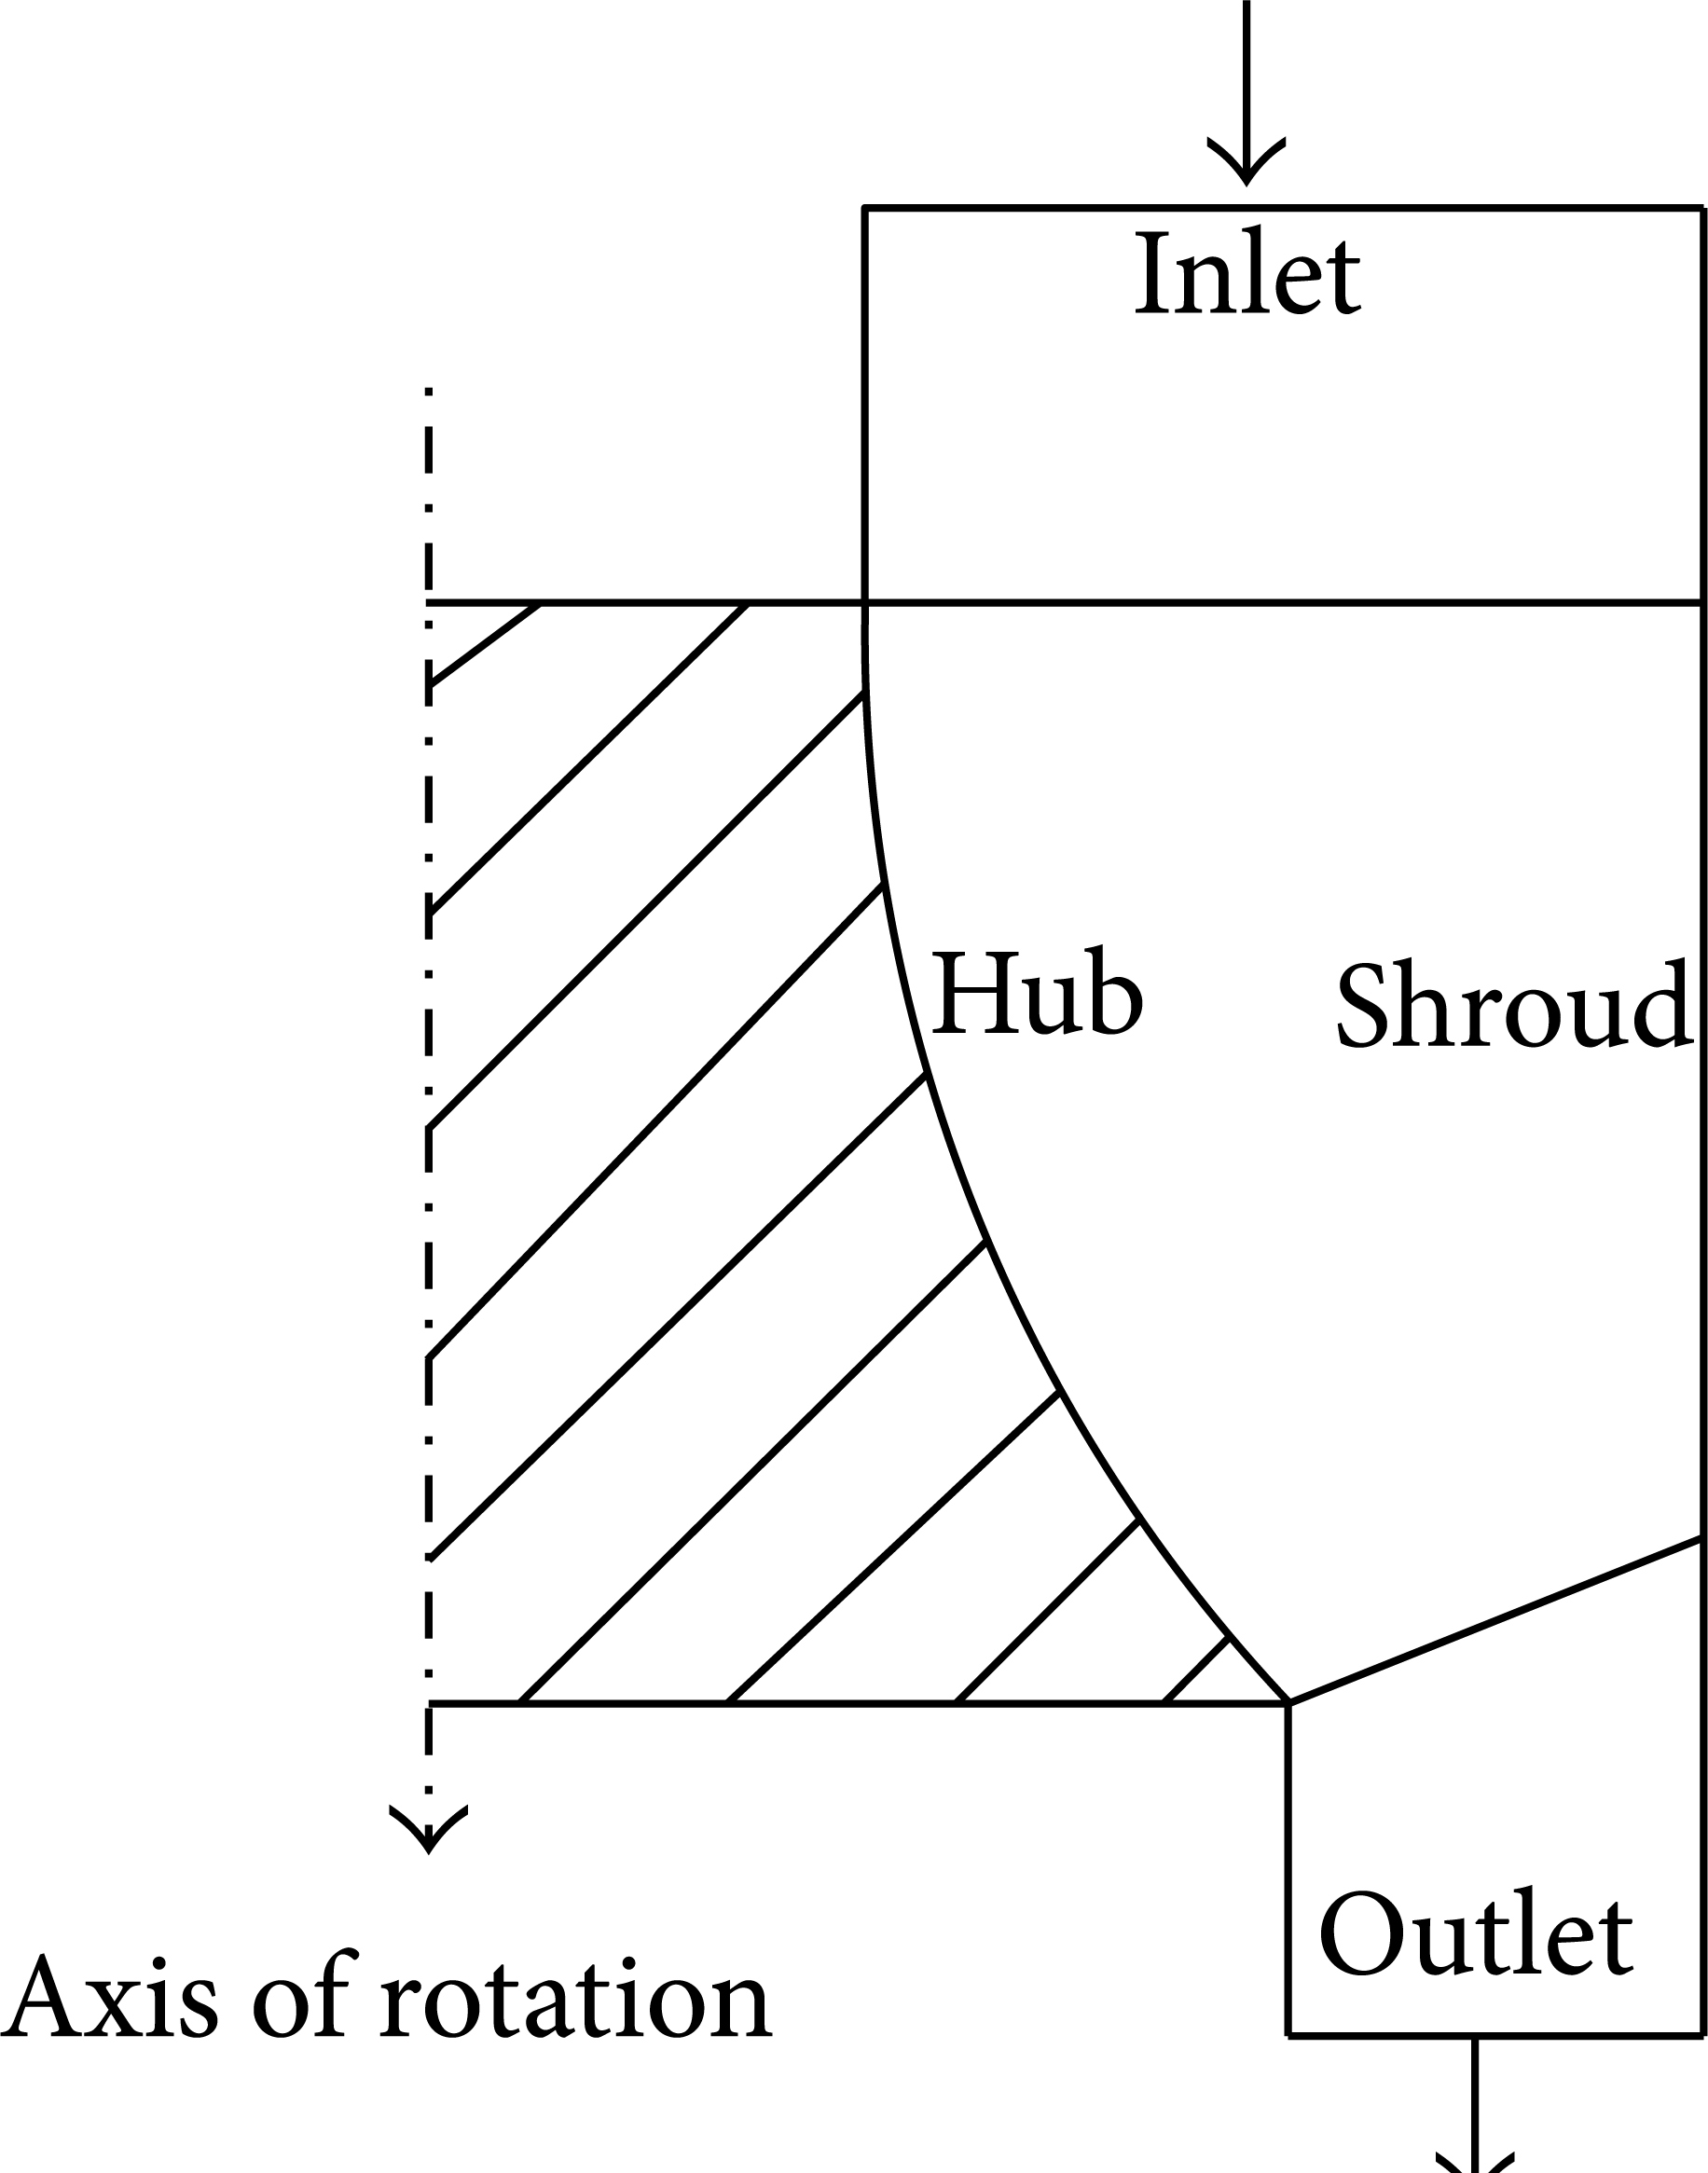
Axial profile of the impeller blade.
3.2. The Meridional Velocity Gradient Equation
Figure 5 shows an infinitesimal hexahedron which is comprised of a series of stream surfaces. And after a series of processing and analysis, the meridional velocity gradient equation can be obtained as

where C m is meridional velocity; ψ is blockage coefficient which is the area ratio of the effective flow and the geometric flow in the pump; α1 is the angle between the meridian streamline and the axis of rotation; α2 is the angle between the line of wetted perimeter and the axis of rotation. The details are shown in Figure 6.

Flow path differential unit.
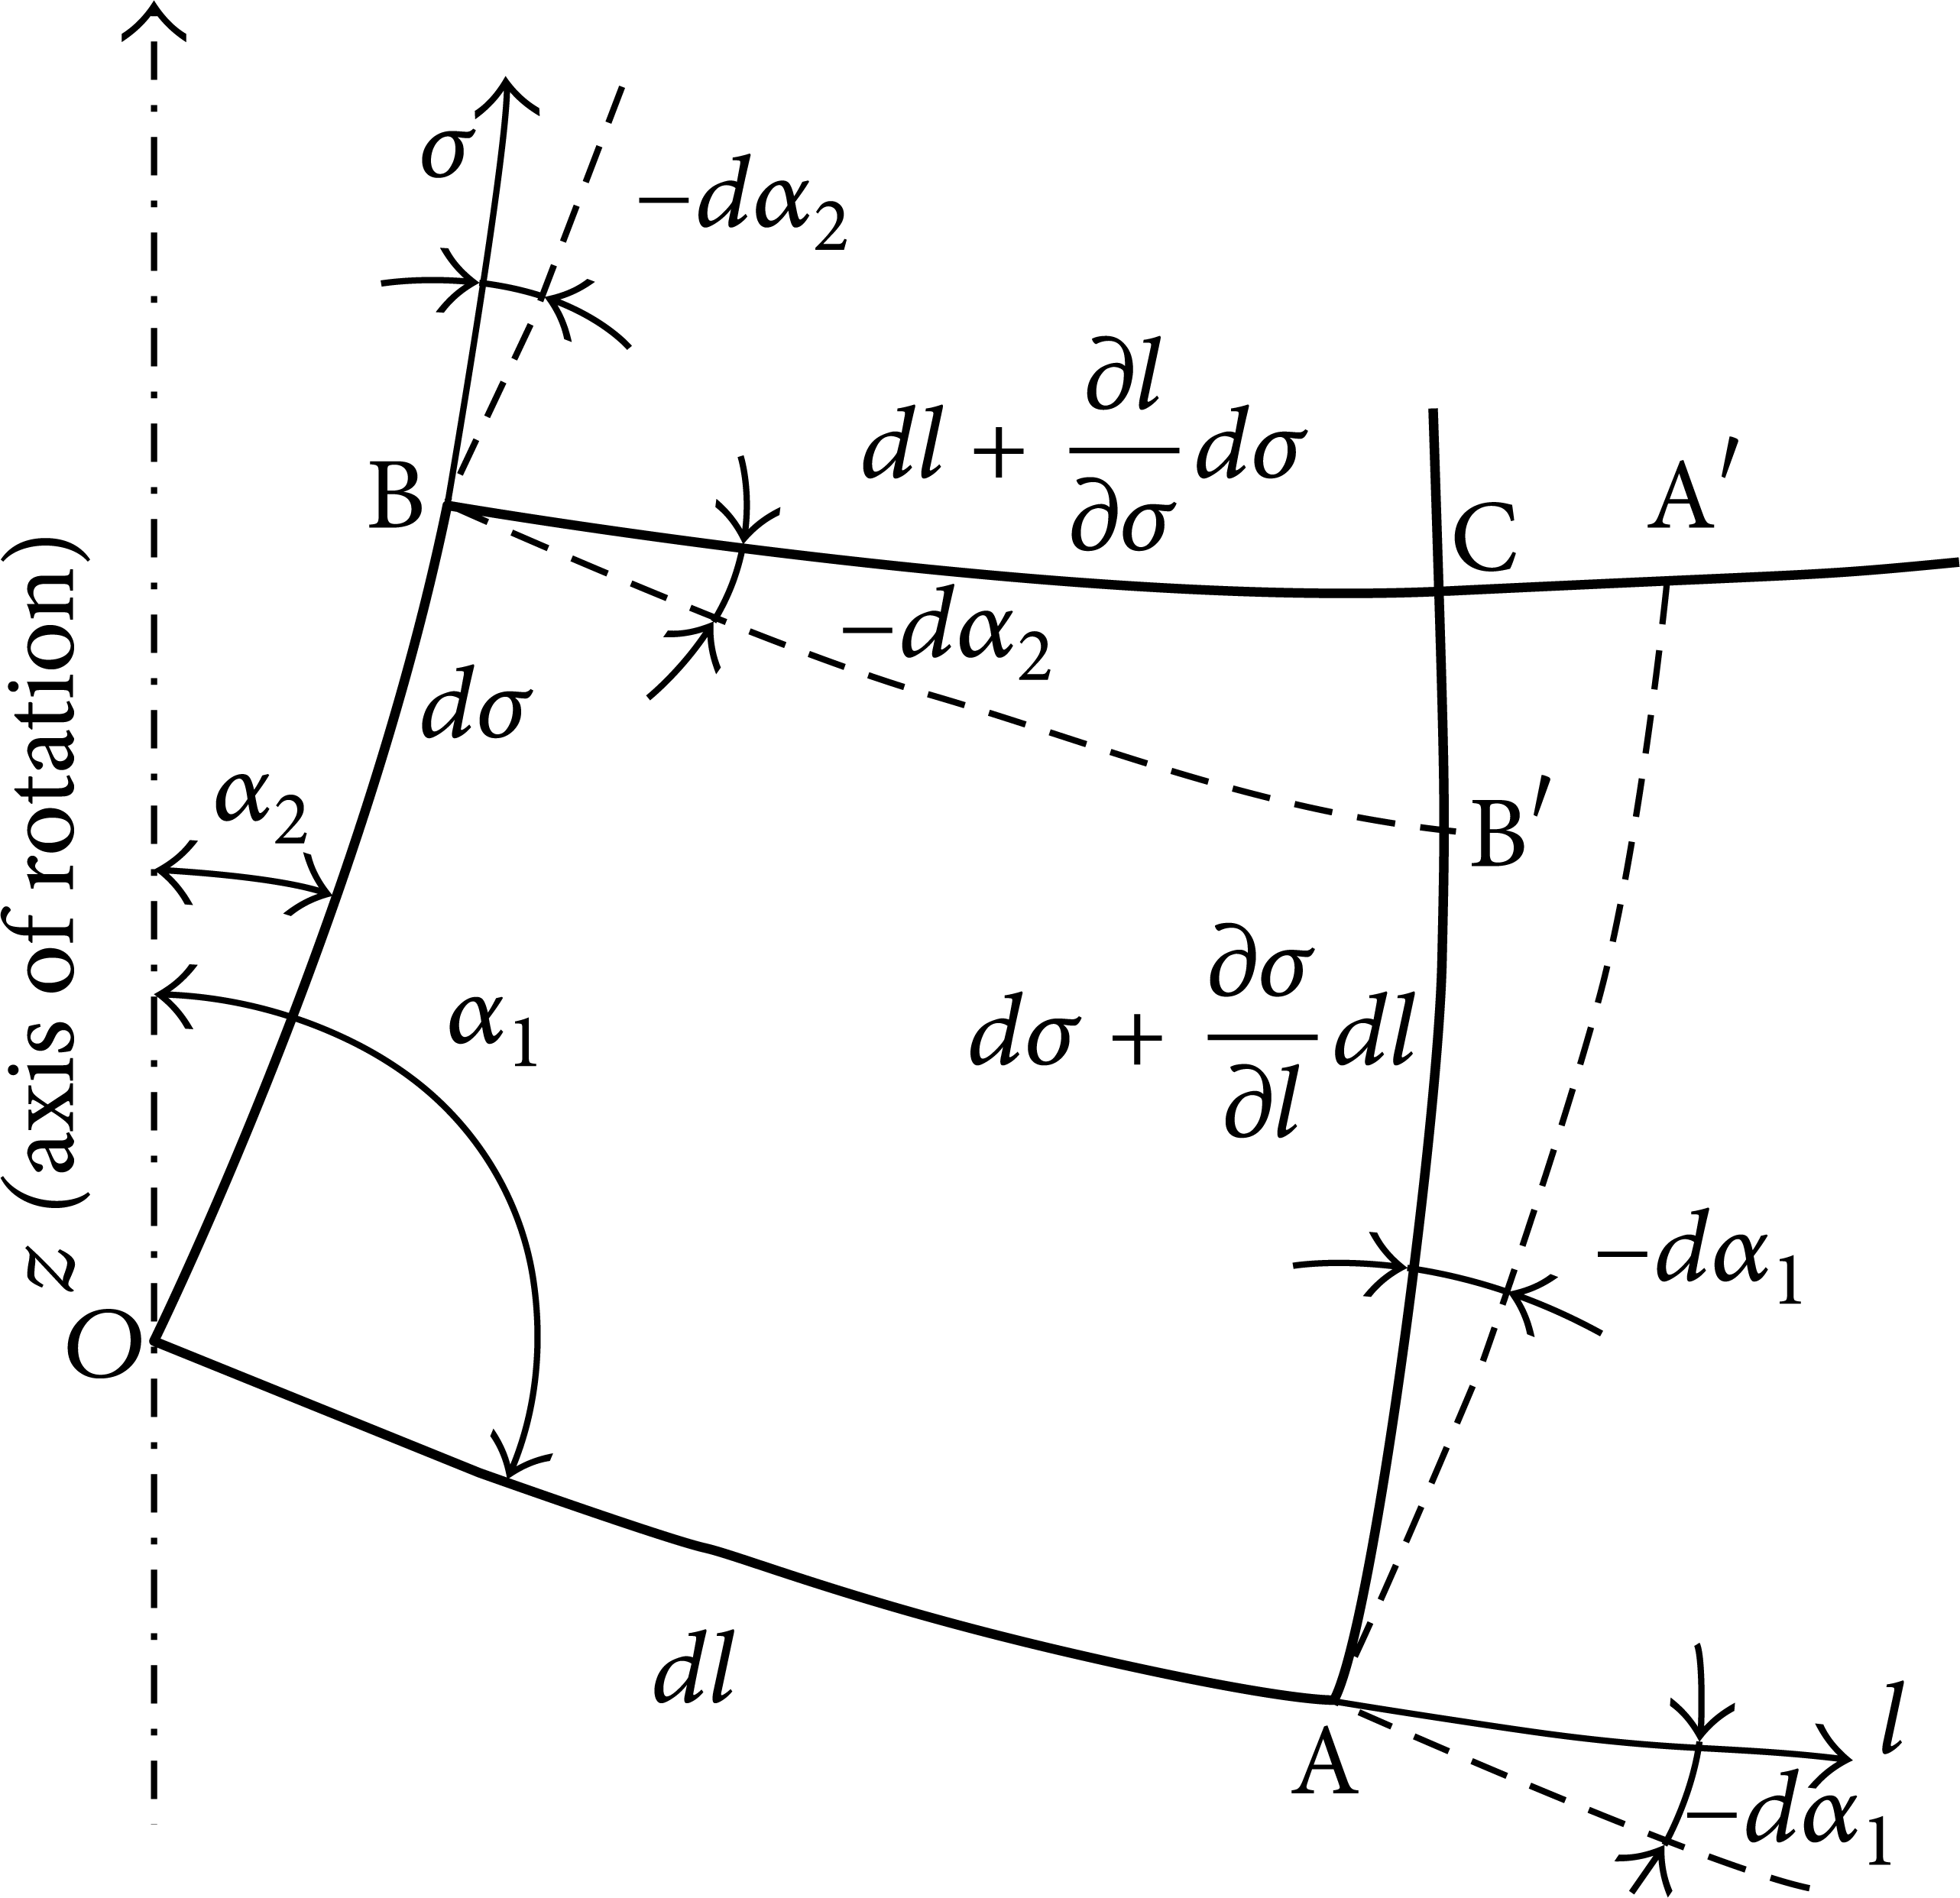
Geometric meaning of α1 and α2.
The relationship between angles α1 and α2 is α2 = α1 − (π/2). The line of wetted perimeter σ is unknown, so the quasiorthogonal line “s” is introduced in order to avoid the derivation of σ. In addition, δ = γ + (π/2) − α1, where δ is the angle between s and l and γ stands for the angle between s and z. Figure 7 shows the relationships between the quasiorthogonal line, the meridian streamline, and the line of wetted perimeter.
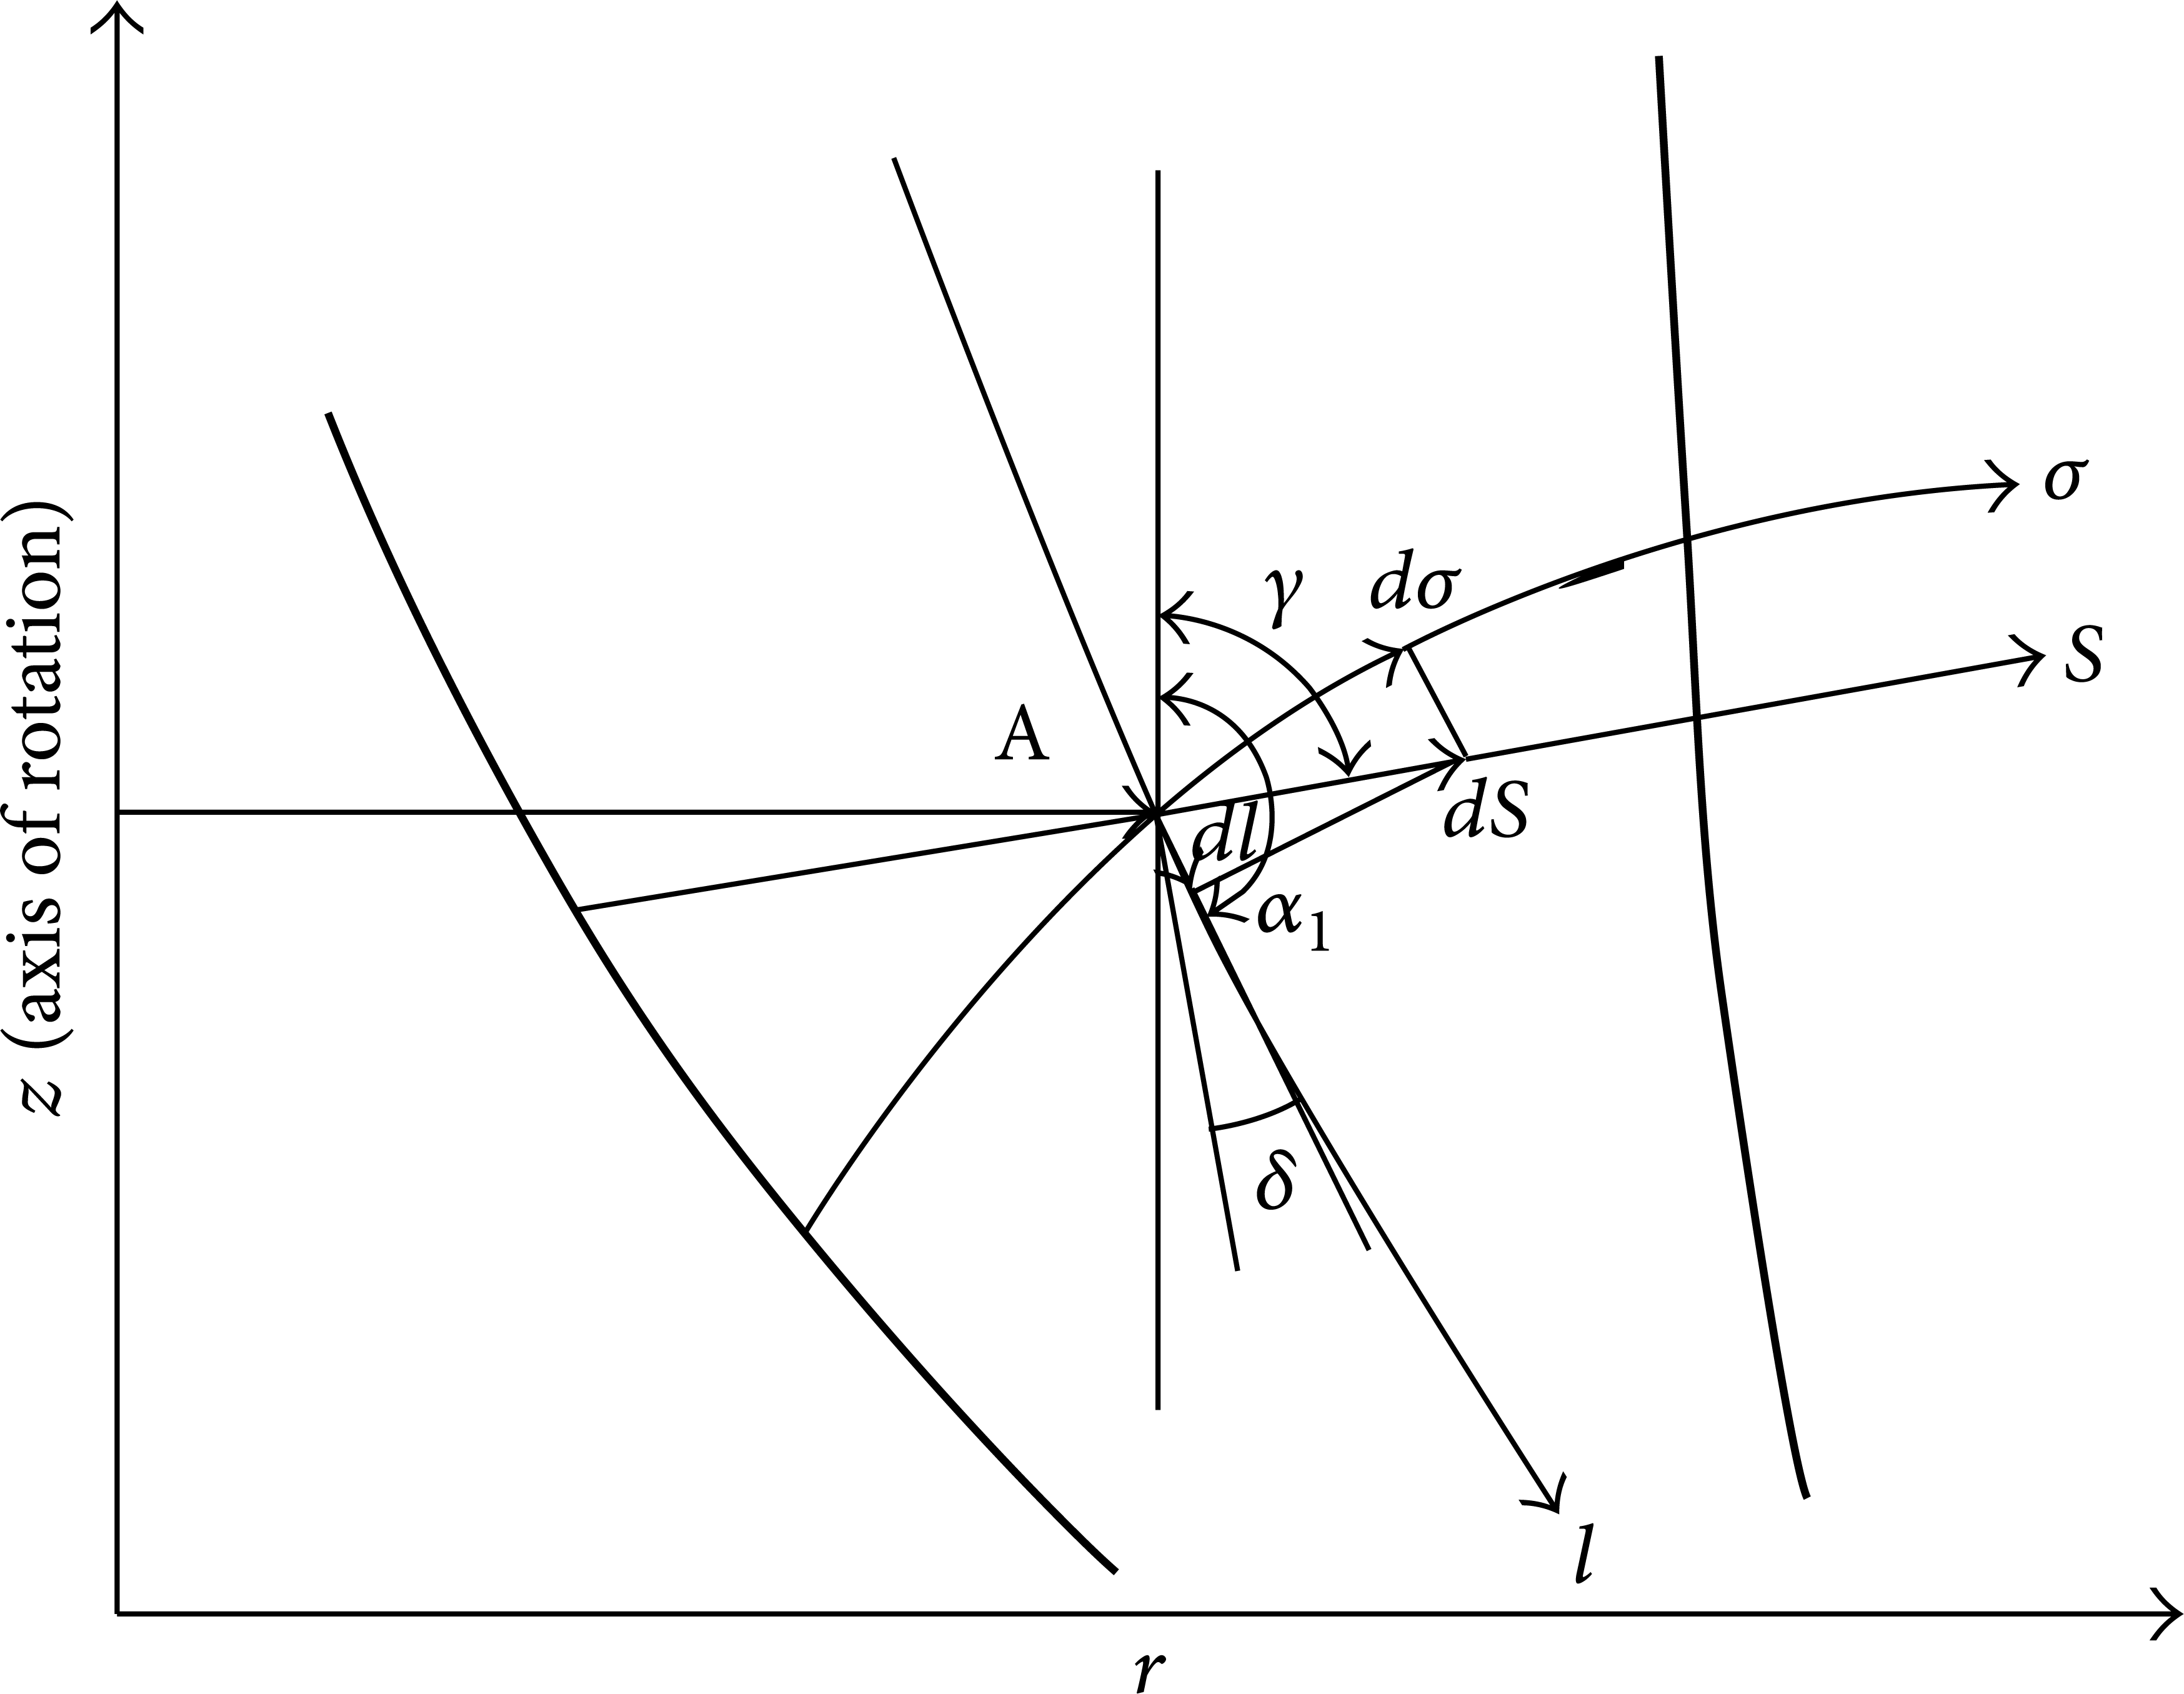
Relationships between the quasiorthogonal line, the meridian streamline, and the line of wetted perimeter.
3.3. Coupling Equations of Gas-Liquid Two-Phase
The GVF and the density of mixture are different everywhere because the pressure in the impeller varies and the gas is compressible, so the GVF and density of mixture ρmix can be expressed as

where the subscripts g, l, mix, and p stand for the gas, the liquid, the mixture, and the working pressure, respectively; ρgas and ρliquid represent the density of gas and liquid, respectively.
The density of gas ρgas can be calculated as

where p, m, ϑ(i) stand for the static pressure in the impeller, the polytropic exponent of gas, and the integral constant depending on the number of the flow line which represents the entropy, respectively. Consider

where Qgas stands for the volume flow of gas and the subscripts 1 and 2 represent the inlet and outlet, respectively.
Equations (2) to (4) are gas-liquid two-phase coupling equations, which play a major role in the computational process. They are also the main difference between the design method of multiphase pump and that of the common rotodynamic pump.
3.4. Calculation of Blade Mean Camber Lines and the Shape Surface of Blade
The parameters of meridian streamline can be obtained by iterative calculations. And then, the flow field is divided into 60 axial planes and the blade mean camber lines are integrated with the point-by-point integral method. Based on the principle of B-Spline surface, all of the blade mean camber lines are combined, so the shape of the impeller blade surface is formed. According to the relationship between meridian streamline and the blade mean camber line as (5), the blade thickness along the meridian streamline can be obtained through the Cubic Spline Method in the curve of δ x = f(L):
where L, δ x , and β stand for the length of the meridian streamline, the real thickness of the blade, and the blade angle in each calculated point, respectively.
4. Design Example
By using the method above, an example of the rotodynamic multiphase pump impeller is designed according to the parameters showed in Table 1. The 3D impeller model is shown in Figure 8.
Design parameters of the design example.


3D impeller model of the design example.
5. Numerical Simulation of the Design Example
The characteristics of the designed multiphase pump are investigated by numerical simulations with the commercial software ANSYS-CFX 14.0 in this paper.
5.1. Calculation Model and Mesh
As shown in Figure 9, three parts compose the calculation model. The first part is the front extension which is once as long as the impeller's diameter, the second part is the impeller, and the third part is the back extension which is three times the length of the impeller's diameter.

Calculation model.
5.2. Mesh Independence
For the reduction of computation time and the improvement of accuracy, the optimum number of grid cells in the simulation has been investigated. In Figure 10, it is observed how the differential pressure and hydraulic efficiency reach an asymptotic value as the number of cells increases. According to this figure, when the number of cells is more than 867180, the change of differential pressure is less than 0.2 × 10⁻⁴ MPa and the hydraulic efficiency is less than 0.15%. So, the Grid E (867180 cells) is considered to be sufficiently reliable to ensure mesh independence.

Influence of grid cells on impeller performance (n = 2900 rpm, Q = 100 m3/h, and IGVF = 15%).
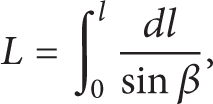
The grid numbers of each part are 147670 on the front extension, 867180 on the impeller, and 193, 600 on the back extension. Figures 11 and 12 show the mesh generated on calculation field and impeller, respectively.

Calculation mesh.
Mesh of impeller flow field.
5.3. Simulation Solution and Boundary Conditions
In the process of 3D flow simulation of the pump, the Reynolds Averaged Navier-Stokes equations are adopted and the finite volume method is used to solve the control equations. The k-ω SST turbulence model is adopted to deal with the water, and the dispersed phase zero equation model is applied to the ideal compressible gas. In addition, the chasing method of finite differences of implicit scheme is applied. Within the computational domain, the multiphase flow calculation utilizes the two-fluid model which supposed that the bubbly flow occurred in the multiphase pump [14].
For all simulations, the boundary conditions are as follows.
(1) Inlet Conditions. Before the mixed fluid flowed into the multiphase pump, liquid and gas had been mixed in a buffer tank. So the distribution of IGVF is considered as homogeneous, and the inlet total mass flow and IGVF are set as the inlet boundary condition.
(2) Outlet Conditions. According to the estimated differential pressure, the outlet static pressure is set as the outlet condition.
(3) Interfaces Boundary Conditions. The data on interfaces between inlet extension, outlet extension, and impeller deliver each other.
(4) Wall Boundary Conditions. The flow pattern is set to no-slip condition and the wall function is applied for dealing with two-phase fluid in the near-wall region.
5.4. Calculation Results and Discussions
5.4.1. Pressure Field Characteristics
When the IGVF is 30%, the static pressure distribution on the blade to blade surfaces is shown in Figure 13 and the average static pressure distributed along the impeller meridional surface is shown in Figure 14.

Static pressure distributions on the blade to blade surfaces.
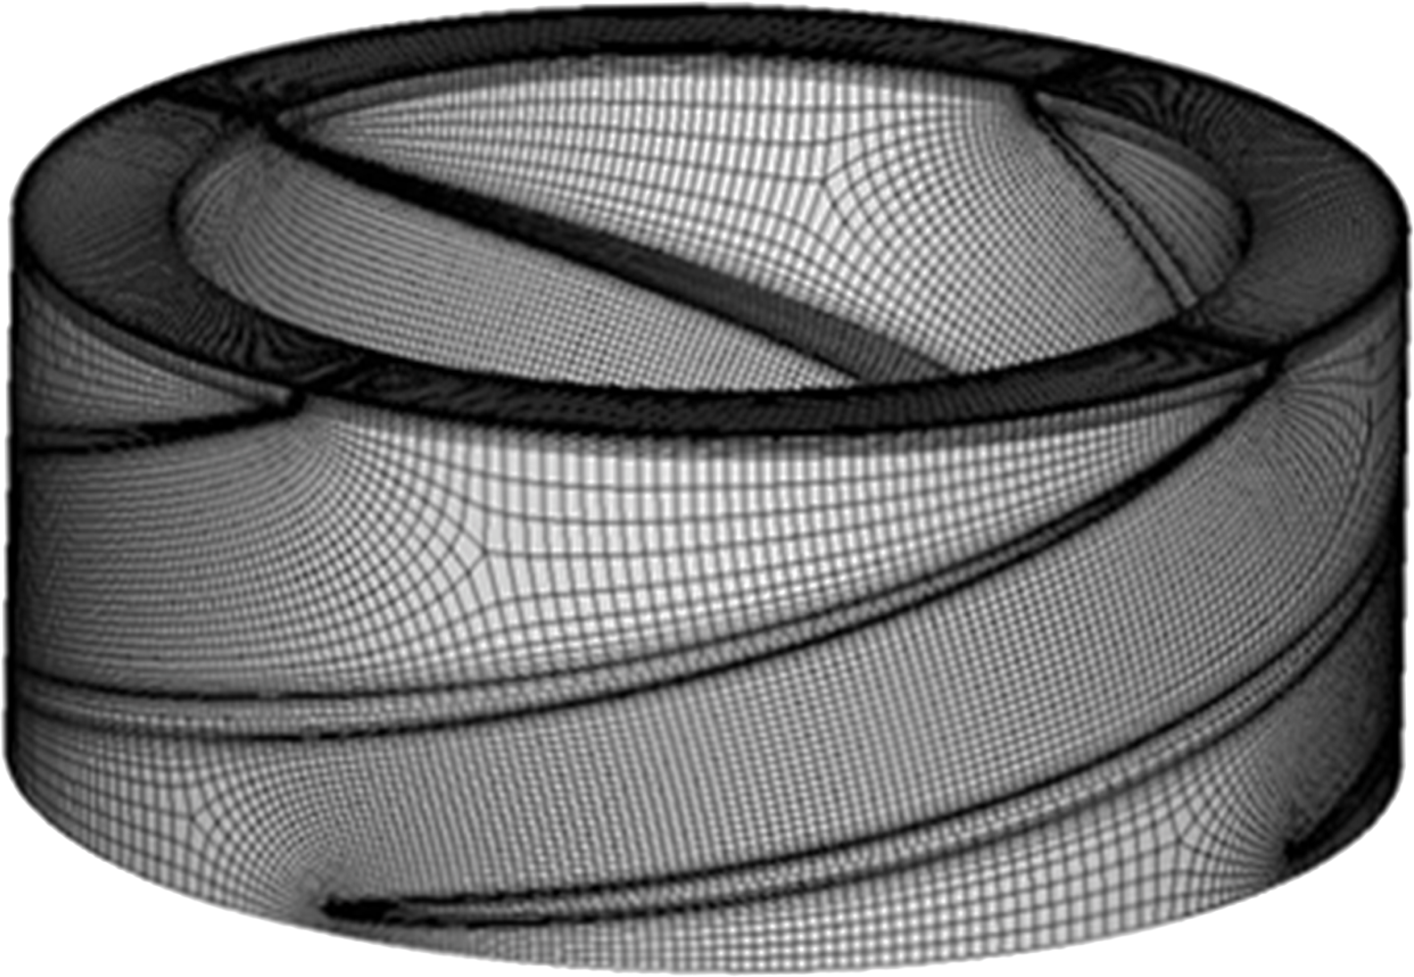
Average static pressure distribution along the impeller meridional surface.
From Figure 13, it can be seen that the static pressure gradient is uniform on the blade to blade surfaces in different spans of the impeller, which is good for the transportation of mixture composed of gas and liquid except for the appearance of pressure fluctuation on the surface of 0.9 span near the outlet.
The results obtained from Figure 14 are as follows.
Average static pressure increases uniformly from the inlet to the outlet. The lowest pressure is about 0.02 MPa and the highest is about 0.24 MPa.
There is a high pressure region near the shroud of outlet, which is probably due to the separation of mixture composed of gas and liquid.
5.4.2. The Distribution Characteristics of GVF
Figure 15 shows the contour plots of the GVF distribution on blade to blade surfaces. Figure 16 shows the average GVF distribution along the impeller meridional surface.

GVF distributions on blade to blade surfaces.

Average GVF distribution along the impeller meridional surface.
The details obtained from Figure 15 are as follows.
The GVF decreases uniformly from the inlet to the outlet for the compressibility of gas.
It is inevitable that the GVF is lower on the surface of 0.9 spans. This is due to the centrifugal force caused by the rotating impeller. However, this phenomenon is very faint in the design example which affirms the design method presented in this paper.
As is shown in Figure 16, the higher GVF that appeared near the hub is about 20% and the lower that appeared near the shroud is about 5%. On the whole, the GVF decreases gradually from the inlet to the outlet as the gas is compressed, which reflects that the gas-liquid separation is not significant which is good for the transportation of gas-liquid mixture.
6. Experiment of the Designed Example
6.1. Experiment Facility
According to the requirement of experiment operated on the designed multiphase pump, a test bench has been set up and its schematic diagram is shown as in Figure 17, which consists of open-type gas circuit and closed-cycle water-flow loop. Limited to the test conditions, water and air are selected as the test medium. Power is provided by the variable-frequency high-speed motor and speed is controlled by the frequency converter. First, air and water flow into the buffer mixture and form uniform multiphase flow that bubbles are uniformly distributed in it. Then, the mixture flows into the multiphase pump and is pressurized. Finally, it enters the open tank through the outer tubes. Water will be recycled and air will be discharged directly into the atmosphere.

Schematic diagram of the multiphase pump bench test.
6.2. Experiment Results
6.2.1. Performance Test
In order to test the differential pressure and hydraulic efficiency of the pump produced based on the 3D design method, three rotational speeds are investigated. Figure 18 shows the differential pressure and efficiency change with the total volume flow when the IGVF keeps 15% and the speeds are 2600 rpm, 2900 rpm, and 3200 rpm. Some conclusions can be obtained as follows.
It is obvious that the differential pressure changes with the increase of rotational speed.
The maximum efficiency point of the pump and high efficient area changes with the increase of rotational speed. The best volume flow is improved with the increase of rotational speed.

Differential pressure and hydraulic efficiency with different Q (IGVF = 15%).
6.2.2. The Influence of Volume Flow on the Performance
Figure 19 shows the performance change with the increase of IGVF under different operational conditions, that is, n = 2900 rpm, Q = 90 m3/h; n = 2900 rpm, Q = 100 m3/h; n = 2900 rpm, Q = 110 m3/h. Some obtained details are as follows.
The differential pressure of the impeller declines gradually with the increase of IGVF, but there is no sudden failure. At the same IGVF, the maximum differential pressure happens when the Q is 90 m3/h, and the minimum happens when the Q is 110 m3/h.
The hydraulic efficiency of the impeller keeps high with different IGVF. The maximum efficiency point of the pump happens when the IGVF is about 40% in each volume flow. When the Q is 100 m3/h, the efficiency is higher than others.

Differential pressure and hydraulic efficiency with different IGVF.
6.2.3. Test Results Compared with CFD Results
Figure 20 shows a qualitative comparison between differential pressure and hydraulic efficiency obtained by experiments and simulations, under differential operating conditions where Q changes from 70 m3/h to 120 m3/h when the IGVF is 15% and n is 2900 rpm. From Figure 20, it can be seen that the simulation results are slightly overestimated as compared with the experiment ones. The experiment results are in a good agreement with the numerical simulation results, which indicates that the performance of the multiphase pump can be precisely evaluated by the experimental techniques and the computational method implemented in this study.

Comparisons between CFD results and experiment results.
6.2.4. Comparison of the Results Obtained by the Design Method Presented in This Paper and Another Design Method
In order to evaluate the 3D design method, it is necessary to compare the test results with ones obtained by another design method [15], which has finished the simulations and experiments to research its performance. Comparisons can be made by investigating the change of head coefficient (ψ) with the flow coefficient (ϕ).
Consider,

where x, H, Hl,Hg, c1, and c2 are the mass flow rate of gas, the total head of the pump, the head of water and gas, and the absolute entrance and exit velocity, respectively. Consider

where vm2 and u2 are the average axial velocity in the outlet of impeller and the tangential velocity in the shroud of the impeller, respectively.
Figure 21 shows the comparison of head performance obtained by the other design method and the method in this paper. The details are as follows.
The head performance obtained by the 3D design method has the same trend of change with the reference results, which verified the reasonability of the 3D design method.
The results in the reference have large ψ in low flow rate. The 3D method results change smoothly in a large flow range, so the 3D design method has an advantage in the transportation of large discharge.

Comparison of head performance.
7. Conclusions
3D design method and an example impeller investigated by CFD numerical simulations and bench test for a rotodynamic multiphase pump are presented in this paper. A brief summary of the major findings are as follows.
In the process of design, a 3D method based on the numerical solution of meridian flow net for the impeller of rotodynamic multiphase pump is put forward.
In the steady numerical prediction, the static pressure gradient and GVF are uniformly distributed on the blade to blade surfaces in different spans of the impeller, which is good for the transportation of mixture composed of gas and liquid.
In experimental study, the hydraulic efficiency of the example pump is investigated in this paper. The experiment results verify the reasonability of the design method. According to the comparison of the 3D design method with another design method, the advantage of the former is shown that it is suitable for large volume flow rate. Furthermore, the results provide a good guidance for the initial design of pump and can also be used as the basis for further research.
Footnotes
Nomenclature
Conflict of Interests
The authors declare that there is no conflict of interests regarding the publication of this paper.
Acknowledgments
This work was supported by the National Science Foundation of China (no. 51209217) and the Science Foundation of China University of Petroleum, Beijing (no. YJRC-2013-10).