
Abstract
The nonferromagnetic debris is easier to be detected as the excitation frequency increases; however, the sensitivity of ferromagnetic metal debris decreases as the excitation frequency increases. This paper is aimed at finding a range of excitation frequency that fit both ferromagnetic metal debris detection and nonferromagnetic metal debris detection. The equivalent circuit of the metal debris detection system with microinductor sensor is analyzed in this paper. The formulae of relationship between the sensitivity and excitation frequency are achieved according to the equivalent circuit. The simulation model of metal debris detection with the microsensor coil is built with the Ansoft software. The equivalent inductance and the electromagnetic induction field of the microinductor sensor are simulated as the excitation frequency changed. The experimental test is carried out with the prototype of microinductor sensor. The simulation results and the test results are compared. The studies indicate that the relationship between the excitation frequency and the changing rate of sensor inductance can be described by the fitting formulae. A higher sensitivity can be obtained if a suitable excitation frequency is selected. These researches have reference value for the design of inductor sensor and the parameters setting in the experimental test.
1. Introduction
Research shows that about 80 percent of mechanical faults are caused by the abrasion failure and the lubrication failure. About 82 percent of these failures are induced by debris, which is induced by the wear of metal parts. Therefore, it is important to detect the metal debris in the lubricant of machinery [1, 2]. The debris detection can be classified into the offline detection and the online detection. The offline debris detection includes ferrography test and spectrum analysis. The ferrography test can detect the ferromagnetic debris. However, the ferrography test is powerless in detecting nonferromagnetic debris. It is easy to get the information of the debris size by spectrum analysis. But the ingredient of the debris cannot be obtained by spectrum analysis. In addition, the offline debris detections have some shortcomings such as long test cycle and high cost. The offline debris detections also cannot provide the real-time information of equipments abrasion. As a result, the online debris detections turn into focus of recent researches [3–5]. Several online debris detections are studied recently, such as the ultrasonic testing, the capacitance detection, and the inductance testing. The high frequency ultrasonic energy is introduced in the ultrasonic testing. The ultrasonic energy propagates through the lubricant oil in the form of waves. When there is debris in the wave path, part of the energy will be reflected. So, the size and position of debris can be detected with the ultrasonic testing. But, the composition of the debris cannot be obtained by ultrasonic testing. Furthermore, the sensitivity of ultrasonic sensor is easily interfered by the temperature of the lubricant [6]. The capacitance debris detection gets the size information of debris through the capacitance changes. It has advantages such as simple structure and high resolution. However, it is also unable to distinguish between ferromagnetic debris and nonferromagnetic debris [7, 8].
Recently, the inductance sensor was adopted to detect the metal debris in lubricant [9, 10]. The test principle is that the nonferromagnetic metal debris decreases the sensor inductance, but the ferromagnetic metal debris increases the sensor inductance. So the ferromagnetic debris and nonferromagnetic debris can be distinguished according to the rise or the decline of inductance, and the size of debris can be discriminated in light of the change of inductance [11, 12]. The double-layer plane inductor coil and the solenoid inductor coil were adopted by Du and Zhe to detect metal debris in lubricant separately [13, 14]. The experimental results indicated that the solenoid coil has a wider detection range than the double-layer plane sensor, but the sensitivity of the solenoid coil is lower than the double-layer sensor. The iron debris with the size between 50 μm and 75 μm was detected in the experiment with a double-layer plane inductor coil. The changing rate of the sensor inductance is about 0.04%. About 32 μm iron particle was detected in experiment with the LC resonance method; however, the copper particles which can be detected in experiments are also fairly large about 75 μm with 2.8 MHz excitation frequency [15]. Liu et al. [16, 17] built a simulation model of detecting metal debris by the microinductor sensor with Ansoft software. The inductance of the sensor is researched with this model as the distance between the metal debris and the sensor coil is changed. The static experimental system is built to measure the inductance caused by different metal debris. The simulation model is also used to research the detecting performance of sensors with different turns and enwinding styles. The nonferromagnetic debris is easier to be detected as the excitation frequency increases; however, the sensitivity (inductance change rate) of ferromagnetic metal debris decreases as the excitation frequency increases. But, how to select the proper excitation frequency for the inductance sensor to detect two types of debris has not been researched.
So, the appropriate excitation frequency should be selected in order to obtain a higher sensitivity of the micro-inductance sensor. This paper studies the relationship between the excitation frequency and the changing rate of microcoil's inductance based on the Kirchhoff principle and the theory of equivalent circuit. The simulation model of the metal debris test with micro-inductance sensor is built with the Ansoft software. The relationship between the test sensitivity and the excitation frequency is analyzed with this model. Furthermore, the experimental test of metal debris with micro-inductance sensor is carried out. At last, the excitation frequency, which makes the sensor a higher sensitivity, is selected based on the theory analysis, simulation result, and the experimental test.
2. The Principle of Metal Debris Detection
There will be an alternating magnetic field around the micro-inductance coil while the alternating current is applied to the micro-inductance coil. The relation between the magnetic field and the current is shown in Figure 1(a). The magnetic field will be affected while nonferromagnetic metal debris is near to the microcoil, which is shown in Figure 1(b). The eddy current will be generated in the metal debris because of the alternating magnetic field. The direction of the magnetic field generated by eddy current is opposite to the magnetic field which is generated by the microcoil. So, the result is that the magnetic field of the microcoil decreases. The decrease of the magnetic field causes the reduction of the sensor inductance. So, the equivalent inductance will decrease while the nonferromagnetic metal debris is near to the sensor. The magnetic field of the microcoil with ferromagnetic metal debris is described in Figure 1(c). The ferromagnetic metal also causes the eddy current effect, which decreases the sensor inductance. But the ferromagnetic metal has large permeability. So the magnetic induction will increase due to the magnetization effect. The magnetization effect is greater than eddy current effect. The inductance of microcoil will increase because of the large permeability [18]. Therefore, the material of the metal debris can be recognized according to the increase or decrease of inductance. The debris size can be identified by the quantity of inductance's change.

The testing principle of the micro-inductance sensor. The black arrow lines indicate the magnetic lines generated by the coil, the white arrow lines indicate the direction of the eddy current, the blue rotate lines mean the magnetic lines generated by the eddy current, the red arrow lines indicate the increased magnetic lines by the ferromagnetic debris, the single round indicates the metal debris, and the circular arrangement indicates the coil.
The equivalent circuit of the micro-inductance sensor is shown in Figure 2(a). The equivalent circuit consists of the resistance R1 and the inductance L1 as there is no any metal debris near to the microsensor coil. The current flow through the coil is I1 when an alternating voltage U is applied to the sensor coil.

The equivalent circuit diagram.
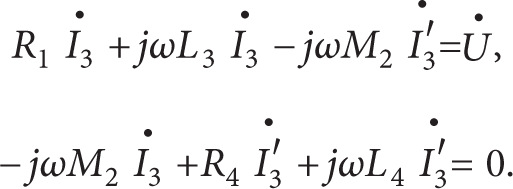
The equivalent circuit of microsensor coil detecting nonferromagnetic debris is shown in Figure 2(b). The current that flows through the microcoil is I2 when the applied alternating voltage is U. The impedance of the sensor coil consists of the resistance R1 and the inductance L1. The eddy current in the nonferromagnetic metal debris is regarded as a short-circuited coil. The equivalent circuit of short-circuited coil consists of the resistance R2 and the inductance L2, and the eddy current is I2′. The mutual inductance between the sensor coil and the nonferromagnetic metal debris is M1 [19]. The equivalent circuit of microsensor coil detecting ferromagnetic debris is shown in Figure 2(c). The ferromagnetic debris increases the coil inductance because of its huge magnetic permeability. So, the impedance of the sensor coil consists of the resistance R1 and the inductance L3. The current that flows through the microcoil is I3 when the alternating voltage U is applied to the sensor coil. The eddy current in the ferromagnetic metal debris is also regarded as a short-circuited coil. The equivalent circuit of the short-circuited coil consists of the resistance R4 and the inductance L4, and the eddy current is I3′. The mutual inductance between the sensor coil and the ferromagnetic metal debris is M2.
Equations (1) can be obtained according to the equivalent circuit in Figure 2(b) and the Kirchhoff law. Equations (1) can be used to explain the theory of the nonferromagnetic debris detecting:

Here, ω = 2πf, f is the frequency of the alternating voltage in metal debris detection.
As shown in (2), the equivalent impedance of the microsensor for nonferromagnetic debris detecting can be got by solving (1). Consider the following:
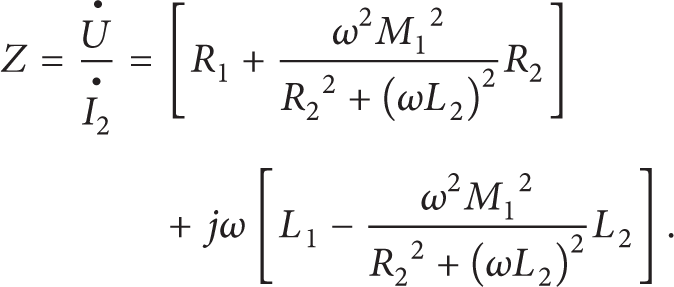
The equivalent inductance LS1 of the microsensor can be described as (3) while the nonferromagnetic debris is tested:

Here, the unit of the inductance is H,
The inductance L1 and L2 of coils with rectangle cross section line can be calculated with (4) according to the references [20, 21]:

Here, N is the turns number of the sensor coil, D is the average diameter of the sensor coil or the short-circuit ring (cm), b is the width of the coil or the short-circuit ring (cm), and c is the radial thickness of the coil or the short-circuit ring (cm), d = b/D, t = c/D.
The equivalent resistance R2 of the short-circuited coil can be calculated with the model that electromagnetic wave transmitted to a large conductor. The metal debris is larger than the distribution of the eddy current in size. The Maxwell equations can be described as (5) according to the boundary conditions. Consider the following:
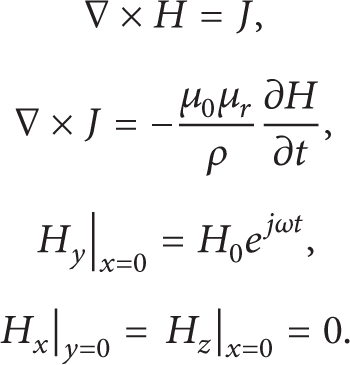
Here, H is the magnetic field intensity, J is the current, μ0 is the magnetic permeability of vacuum, and μ r is the magnetic permeability of the metal debris. The x direction is from the center of sensor coil point to the center of metal debris.
Equations (5) can be simplified as the following equations:
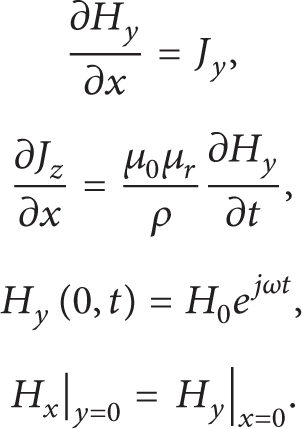
Equations (7) are obtained by solving (6):

Here,

Then, the formula of the equivalent resistance R2 can be obtained as shown in the following equation:
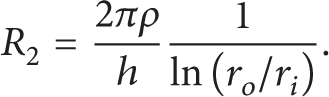
Here, r o is the outer radius of the short-circuit ring, r i is the inner radius of the short-circuit ring, and the ratio from r o to r i is about 2.6476.
It is observed that the equivalent resistance R2 is a formula of excitation frequency according to (8) and (9). The inductances L1 and L2 are unaffected by the excitation frequency. So, the change rate of the inductance of the sensor coil while it detects nonferromagnetic debris can be described as the following equation:

Here, Δ is the changing rate of inductance sensor. The constant parameters in (10) can be substituted with undetermined coefficients. Here α substitutes for

The equivalent circuit of ferromagnetic debris detecting is similar to the equivalent circuit of nonferromagnetic debris detecting. But the ferromagnetic debris has a large magnetic permeability, which makes the inductance of microcoil increase from L1 to L3. Equations (12) can be obtained according to the equivalent circuit in Figure 2(c) and the Kirchhoff law:
As shown in (13), the equivalent impedance of the microsensor for ferromagnetic debris detecting can be got by solving (12). Consider

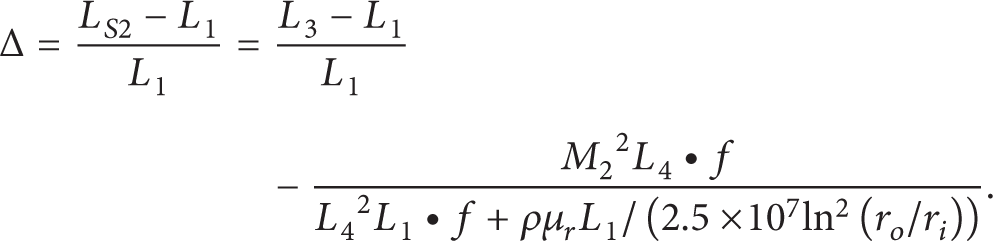
The equivalent inductance LS2 of the microsensor can be described as (14) while the ferromagnetic debris is tested:

Here, M2 is the mutual inductance between the coil and the ferromagnetic debris, L3 is the inductance of the microsensor coil while the ferromagnetic debris is considered as the magnetic core, L4 and R4 are the inductance and the resistance of the short-circuit loop separately, and the ferromagnetic debris is also regarded as short-circuit loops of eddy current in alternating magnetic field.
The simplification of formula (14) is similar to the simplification of formula (3). The short-circuit loop resistance R4 of the ferromagnetic debris can be calculated with formula (8) and formula (9). So the changing rate of the microsensor coil inductance can be described as formula (15) while it detects ferromagnetic debris. Consider the following:
Only the parameters ω and R4 are changed according to the excitation frequency. The constant parameters in (15) can be substituted with undetermined coefficients. Here α substitutes for

The constant undetermined coefficients can be obtained by theoretical calculation and experimental test. Formula (11) can be used to describe the detection of nonferromagnetic debris with the microsensor coil and formula (16) can be used to describe the situation of the ferromagnetic debris which is detected. Then the relation between frequency and the changing rate of the coil inductance can be obtained while ferromagnetic metal debris and nonferromagnetic metal debris are detected.
3. The Simulation of Metal Debris Detection with Microsensor
As shown in Figure 3, the simulation model of metal debris detection with the microsensor coil is built with the Ansoft software. The parameters of the simulation model are matched with the parameters in the experimental test. The model of the microcoil is set as a planner spiral coil, whose inner diameter is 400 μm and the number of turns is 10. The diameter of the coil line is set as 60 μm and the radius change of Archimedes spiral is set as 70 μm. Agilent 4294A is adopted in experiment test because it has the frequency sweep test mode. However, the precision of this instrument is ±0.08%. Too small debris may not be detected. So, fairly large debris with a diameter about 200 μm is selected according to the precision of the test instrument. Copper debris model is simulated as nonferromagnetic metal debris and an iron debris model is adopted as ferromagnetic debris. The model of copper debris is set as a ball shape whose diameter is 200 μm. The iron debris is set as a cube shape with the size of 200 μm × 200 μm × 40 μm (length × width × height). The distance between the metal debris and the coil is 200 μm. The parameters of the material in simulation models are selected from the material storage of the software. The relative permeability of copper is 0.99999 and the conductivity of copper is 5.8 × 10⁷ siemens/m. The relative permeability of iron is 4000 and the conductivity of iron is 1.03 × 10⁷ siemens/m. The magnetic induction of the microsensor coil is simulated while no metal debris is detected. The inductances of microsensor coil are 94.17069 nH, 92.85224 nH, and 90.69283 nH when the excitation frequencies are 1 MHz, 10 MHz, and 20 MHz separately.
The simulation model.
The excitation frequencies are also simulated with 1 MHz, 10 MHz, and 20 MHz separately while metal debris is detected. The magnetic induction figures of microcoil are shown in Figure 4 while the copper debris is detected. Figure 4(a) is the magnetic induction with 1 MHz excitation frequency. Figure 4(b) is the magnetic induction with 10 MHz excitation frequency. Figure 4(c) is the magnetic induction with 20 MHz excitation frequency. It can be seen that the magnetic induction of the microcoil decreases with the increase of the frequency by comparing the magnetic induction with different excitation frequency. The equivalent inductances of the microcoil are 94.1223 nH, 92.74316 nH, and 90.58325 nH while the excitation frequencies are set as 1 MHz, 10 MHz, and 20 MHz separately, and the changing rates of the equivalent inductance are −0.051%, −0.118%, and −0.12%.

The magnetic induction of testing copper debris with different frequency.
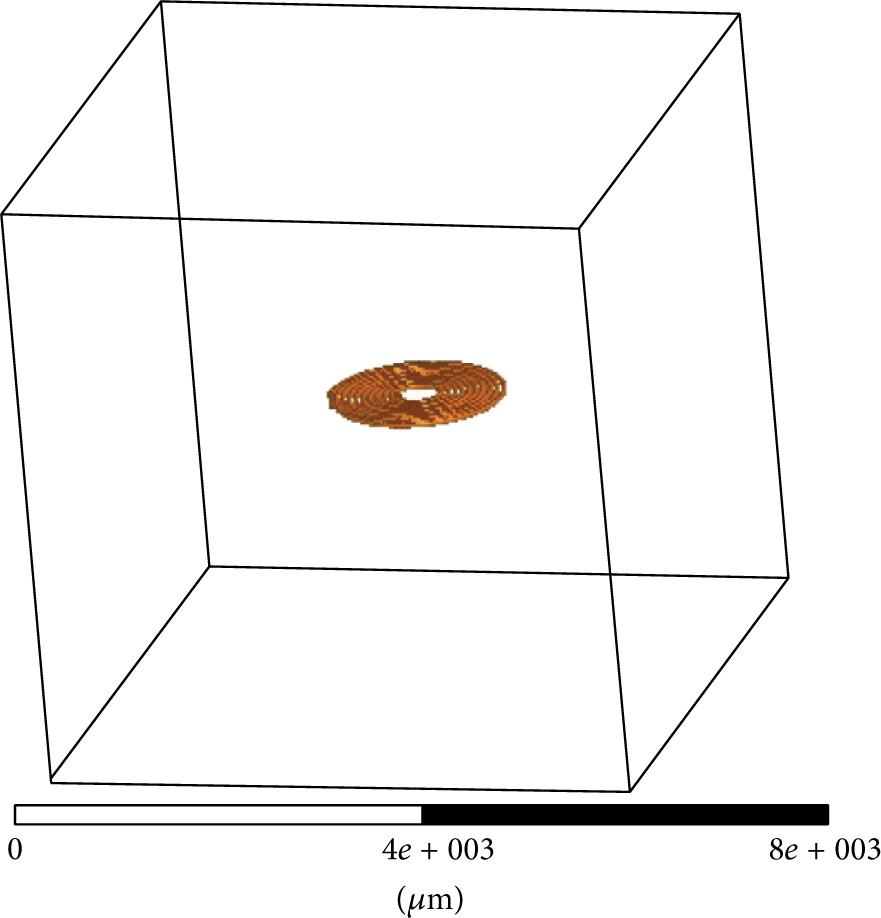
The distribution of the magnetic induction near to the micro-coil is shown in Figure 5 while the iron debris is detected. The equivalent inductances of microcoil are 94.3652 nH, 92.97020 nH, and 90.80476 nH while the excitation frequencies are set as 1 MHz, 10 MHz, and 20 MHz separately, and the changing rates of the equivalent inductance are 0.207%, 0.127%, and 0.123% separately. The simulation results indicate that the iron debris increases the equivalent inductance of the sensor and the testing sensitivity of the sensor decreases with the increase of the excitation frequency while iron debris is tested.

The magnetic induction of testing iron debris with different frequency.
4. The Experimental Detection of Metal Debris with Microsensor
There are 10 circles and 1 layer in the prototype of microsensor. The inner diameter of the microplanner sensor coil is 400 μm and the outer diameter is 1600 μm. The diameter of the copper line is 60 μm. The Agilent 4294A is selected as the testing instruments because the instruments can measure the inductance in sweep frequency mode. The size of metal debris is selected according to the precision of the testing instrument. So the 200 μm debris is selected as the testing debris. The experimental test with such size debris can reflect the rule of changing rate of inductance with different excitation frequency. The copper debris and the iron debris used in the experiments are shown in Figures 6(a) and 6(b) separately.

The microphotograph of metal debris.
As shown in Figure 7, the experimental system consists of a 3 axes movable platform, a convex plate, a microsensor coil, a nonmetal probe, a cantilever, a Agilent 4294A LCR testing instrument, and a computer. The metal debris is fixed on the tip of the nonmetal probe. The location of metal debris can be controlled by adjusting the 3 axes moveable platform. The microsensor coil is connected to the testing instrument of Agilent 4294A, and the test data are sent to computer.
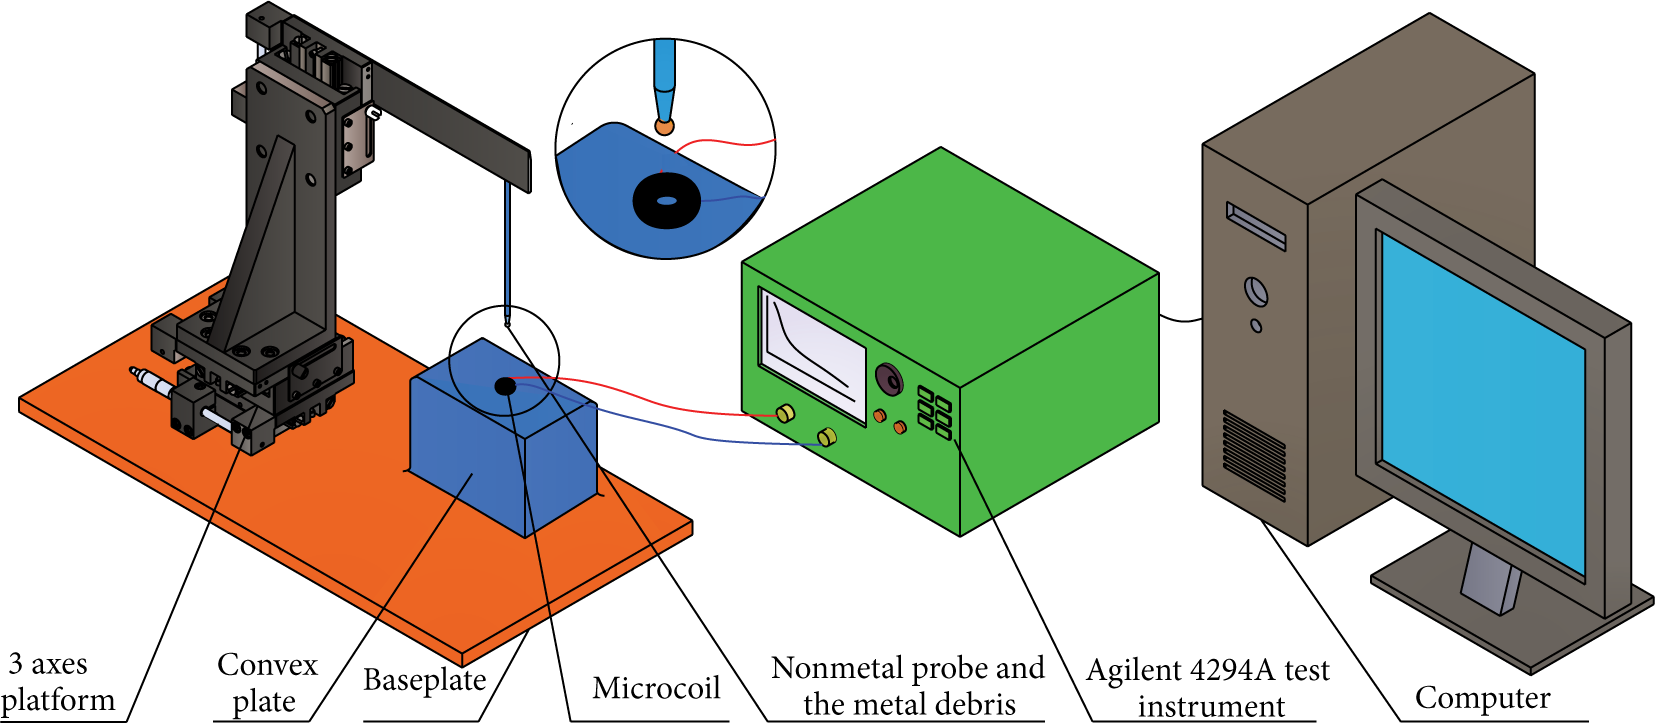
The schematic diagram of experimental test system.
The testing model is set as L-Rs and the sweeping range of the frequency is from 1 MHz to 40 MHz in the experiments. The distance between the microcoil and the metal debris is about 200 μm. The constant undetermined coefficients can be obtained by fitting the testing results of copper debris detection to formula (11) with Matlab software. The constant undetermined coefficients in formula (16) can also obtained with the iron testing result. The determination coefficients of fitting formulae are shown in Table 1 as different range excitation frequencies are adopted in the experiments.
The determination coefficients of fitting curves with different range of excitation frequency.
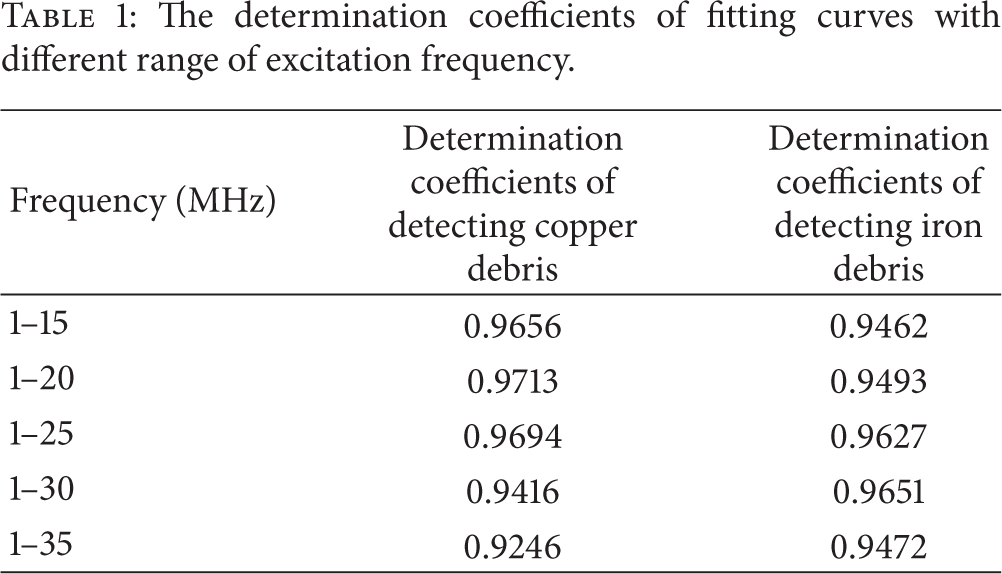
It can be seen that both the determination coefficients for copper detection and iron detection increase with the rise of excitation frequency range. This is because the fitting formula could describe the experimental detection comprehensively when there are more data. However, the determination coefficient decreases when the excitation frequency is too high and the range of excitation frequency is larger. The determination coefficient is 1 when the experimental curve coincides with the fitting curve completely. The experimental test result and the fitting curves of copper debris detection are shown in Figure 8(a). The determination coefficient is 0.9713 while the range of the excitation frequency is from 1 MHz to 20 MHz. The experimental test result and the fitting curves of iron debris detection are shown in Figure 8(b). The determination coefficient is 0.9651 while the range of the excitation frequency is from 1 MHz to 30 MHz.

The experimental curve and the fitting curve.
The undetermined coefficients in fitting equations can be obtained when some experimental results are put into fitting equations. Then the fitting equations can be used to describe the relationship between frequency and the changing rate of coil inductance.
5. Discussion
The inductance of the microsensor itself is 94.17069 nH when the frequency is 1 MHz in simulation, and the experimental result is 107.6217 nH. The two data are different because the inductance in experiment not only includes the inductance of the microcoil, but also includes the inductance of lead line. The changing rate of inductance of experiment and simulation are compared in Table 2. The two groups of data are quite close. So, the simulation model is valid and it can be used to describe the detection of metal debris with microsensor coil.
The changing rate of inductance in experiment and simulation.

6. Conclusion
The influence of the excitation frequency on the sensitivity of metal debris detection is studied in this paper. The equivalent circuit of the metal debris detection system with microinductor sensor is analyzed. The formulae of relationship between the sensitivity and excitation frequency are achieved according to the equivalent circuit. The simulation model of metal debris detection with the microsensor coil is built with the Ansoft software. The equivalent inductance and the electromagnetic induction field of the microinductor sensor are simulated as the excitation frequency changed. The experimental test is also carried out with the prototype of the microinductor sensor. The simulation results and the test results are compared. The studies indicate that the relationship between the excitation frequency and the changing rate of the sensor inductance can be described by the fitting formulae with a little experimental result. This work is profitable for saving time on the experiment.
It is easier to detect the nonferromagnetic metal debris as the excitation frequency increased from 1 MHz to 40 MHz. However, the inductance change rate of ferromagnetic debris is decreased as the excitation frequency increases. A suitable excitation frequency can be selected according to the fitting formulae to detect both nonferromagnetic and ferromagnetic debris. For the prototype of microsensor, the suitable frequency is about 2 MHz. These researches have reference value for the design of inductor sensor and the parameters setting in the experimental test.
Conflict of Interests
The authors declare that there is no conflict of interests regarding the publication of this paper.
Footnotes
Acknowledgments
Project of National Natural Science Foundation of China no. 51105011 supported this research. Project of Beijing Board of education no. KM201210005015 supported this research.