
Abstract
In the integrated traffic environment, human factor is always a main factor of the three elementary factors, besides the vehicle and road factor. The driver physiological and psychological characteristics have an important impact especially on traffic safety in urban road traffic conditions. Some typical traffic scenes in condition of urban road, such as light signal control at intersection, overtaking, and passing, are selected for condition analysis. An eye movement apparatus was used to obtain driver eye closure, blink frequency, and other visual physiological indicators in the traffic conditions of urban road. The regular patterns of driver visual characteristics in the corresponding scenes were analyzed in detail to provide data and theoretical support for the further research on traffic safety of urban environment from the viewpoint of driver psychology and behavior.
1. Introduction
During recent years, the traffic accidents happened more and more frequently, which make more and more serious impacts on people's lives and the socioeconomic. The frequency of traffic accidents is especially higher in the intersection or during overtaking and passing. The traditional solution, to decrease the accident frequency in theory, mainly focused on analysis and optimization of the road alignment and the mechanics of vehicle movement [1–4]. The driver factor, as an important human factor besides the other factors of road and vehicle in traffic system, is seldom taken into account in the traditional research. The recent studies started to concentrate on the physical and physiological characteristics of the driver [5–15]. Many of them analyzed the relationship between the driver physical or physiological state and the road alignment of expressway and mountain highway. However, the driver physiological characteristics in certain environments of urban road are seldom concerned. In reality, the driver immediate reaction to the traffic conditions, which affects a lot during traffic accidents, has strong relationship with the driver physiological states that could be measured by certain professional equipment. Through measurement of some typical parameters of visual characteristic, eye closure and blink frequency, for example, in the typical condition of urban traffic, such as especially overtaking, passing, and traffic light controlling, the regular pattern of the visual characteristic can be described for further analysis and research on the relationship between the visual features and driving reaction during typical urban traffic environments. The described pattern could be highly helpful to improve the safety of urban traffic, while the corresponding steps were correctly taken.
2. Test Design and Analysis
The main aim is to analyze driver visual characteristics in typical conditions of urban road, such as traffic light alternating on intersection, overtaking, and passing. Two visual parameters, the blink frequency and the eye closure, were mainly selected as the indicators. The two indicators indicate the visual features of drivers. The indicator, blink frequency, is defined as the blink times (N) during a certain interval (T). Eye closure is an indicator to measure the degree of how much eyes are closed, whose value is between 0 and 1. The smaller the closure is, the greater the eyes are open. The two indicators indicate the physiological characteristics of the drivers indirectly.
2.1. Test Equipment
The faceLab Seeing Machine, an eye tracking system, was adopted to get data of driver visual features in certain traffic conditions. The machine can generate data on eye movement, eyelid aperture, pupil size, and so on. And real-time analysis on the generated data could be developed for further applications. Vehicle traveling data recorder is used to record the traffic environment, which is linked tightly with the data of visual features. The following data analysis is taken to find out the regular pattern of visual parameters and physiological characteristics for further analysis, in corresponding traffic conditions.
The primary equipment of faceLab is shown in Figure 1.
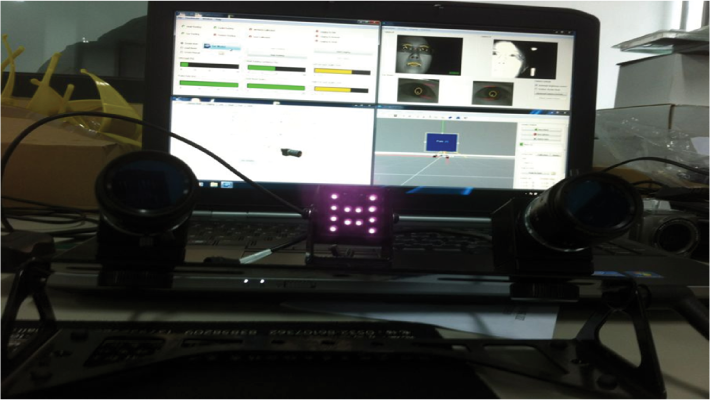
The basic configuration of test equipment.
2.2. The Experimental Procedure
To gain the real data, field test was carried out. A section of 30 km, which covers some crossings with traffic lights and practical traffic vehicles, was selected as typical urban traffic environment. The road alignment of the selected section was shown in Figure 2. The numerous traffic lights control, overtaking, and passing have the character of typical factors of urban road.
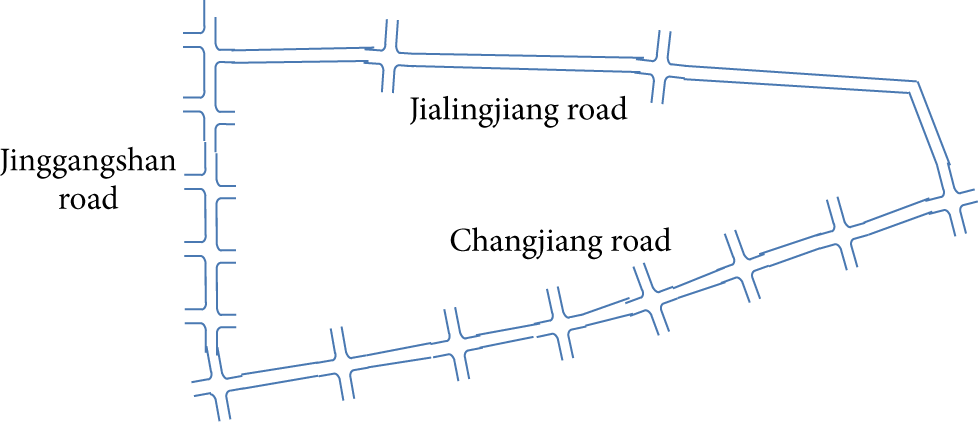
The selected section of urban road.
3. Test Results and Analysis
3.1. The Influences of Traffic Lights
A large number of accidents happened on intersections, for complicated traffic conditions that existed there. Drivers are prone to be tense when coming into the intersections, especially with traffic signal lights changing. The psychological tension will increase the probability of misoperation or improper operation, which likely leads to an accident. Studying the certain visual characteristics in the certain traffic environment, which can indicate the psychological tension, can be practically helpful for decreasing the accident rate.
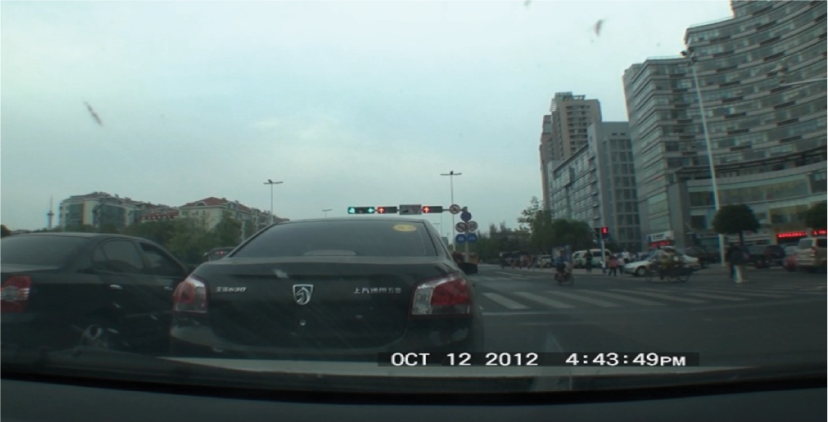
3.1.1. When Red Light Is Turned On
A typical scene is selected as shown in Figure 3. The driver has seen the red light turned on and starts to decelerate the car until the car fully stops. The whole process is recorded by the vehicle traveling data recorder, and the values of the two above visual indicators are recorded by the eye tracking system. After data mining, the change over time of the parameter, eye closure, is shown in Figure 4, where a time frame unit of horizontal axis stands for 1/60 second.

The traffic environment when red light is turned on.
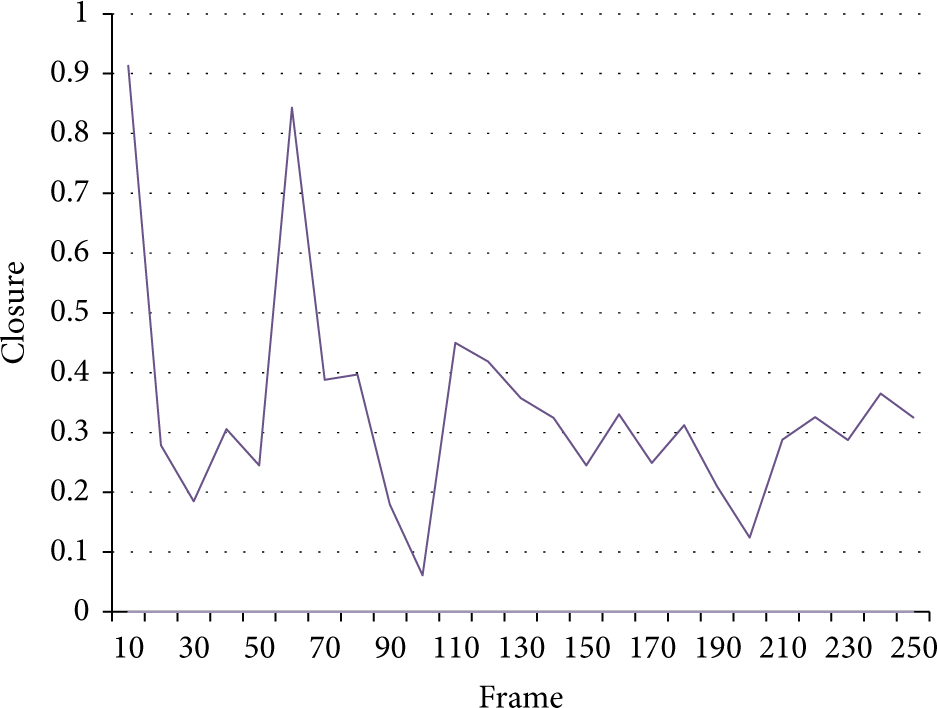
The change of eye closure over time after the red light is turned on.
From the time when the driver notices the red light turned on to the time when the vehicle fully stops, the maximum point of the driver's eye closure turns out to be descendent in tendency. It means obviously that the driver becomes more and more concentrated on the traffic environment, with larger fluctuation at earlier time. The fluctuation becomes tiny and can be explained as stable, the psychological status mentioned.
The change of blink frequency over time is shown in Figure 5.

The change of blink frequency over time after the red light is turned on.
The blink frequency of driver eyes has certain relation to the closure. There are two aspects to be analyzed: whether the variation of eye closure is reflecting blink or not and whether the variation of eye closure certainly leads to the variation of blink frequency.
The changing extent of eye closure varies corresponding with the blink frequency. The changing extent of eye closure fluctuates very little, while the blink frequency is kept in a certain state, as shown in Figure 5.
3.1.2. Waiting on the Stop Line
The eye closure of the driver during the period of waiting in the red light (shown in Figure 6) is shown in Figure 7.
The traffic environment while waiting on the stop line.

The change of eye closure over time while waiting on the stop line.
The change tendency of the peak point of eye closure during the red light waiting time is shown in Figure 7. The general tendency of eye closure over time is just declining. This means that the driver gradually tends to get concentrated over time while waiting for the green light. The attention has achieved the best point when the green light appears.
The tendency of blink frequency over time is shown in Figure 8.

Blink frequency over time while waiting on the stop line.
The blink frequency remains consistent at earlier time, as the frequency of the changing eye closure stays stable, while waiting for the green light. As the eye closure changes, the blink frequency fluctuates. When the changing extent of eye closure is not big, the maximum of blink frequency is also maintained at a certain value.
3.1.3. After the Traffic Light Is Turned Green
Figure 9 shows the condition that the light is turned to green and the car goes through the intersection. Figure 10 shows the variety of eye closure over time after the light is turned green until the car completely goes through the intersection.

The traffic environment after green light is turned on.

Eye closure over time after green light is turned on.
Figure 10 indicates that the trend of the maximum closure is rising with large fluctuation, during the time while the car goes through the intersection. It suggests that the driver's attention becomes decentralized.
Blink frequency over time is shown in Figure 11.
Blink frequency over time after green light is turned on.
At the beginning of the time period, the amplitude of eye closure changes greatly and the blink frequency accordingly changes. But as the maximum value of the eye closure changes in regular pattern, the blink frequency is also maintained at a certain state.
Blink frequency is substantially in a steady state as shown in Figure 11. Blink frequency is within the normal range.
3.1.4. The Practical Influences
The variation of the two visual indicators described above, which indicate the physiological attention of the driver, accurately conforms to the common analysis conclusion of the traffic accidents. The traffic accidents in intersection with traffic lights usually happen after the red light or the green light is just turned on, when the two visual indicators indicate that the physiological attention of the driver is just becoming decentralized. If some appropriate and corresponding steps are taken to avoid the decentralization of drivers’ attention, the accident rate in intersection of urban traffic will significantly decrease as expected.
3.2. The Physiological Index Varies While Overtaking and Passing
3.2.1. Overtaking
As Figure 12 shows, the car is overtaking a bus. The eye closure variety over time while overtaking is shown in Figure 13.

Overtaking in traffic conditions of urban road.

The eye closure over time while overtaking.
The peak of the eye closure totally tends to get down at the first stage of the overtaking as shown in Figure 13. The closure is maintained steady during overtaking with the value about 0.4. The peak tends to be ascendant just after the overtaking accomplished.
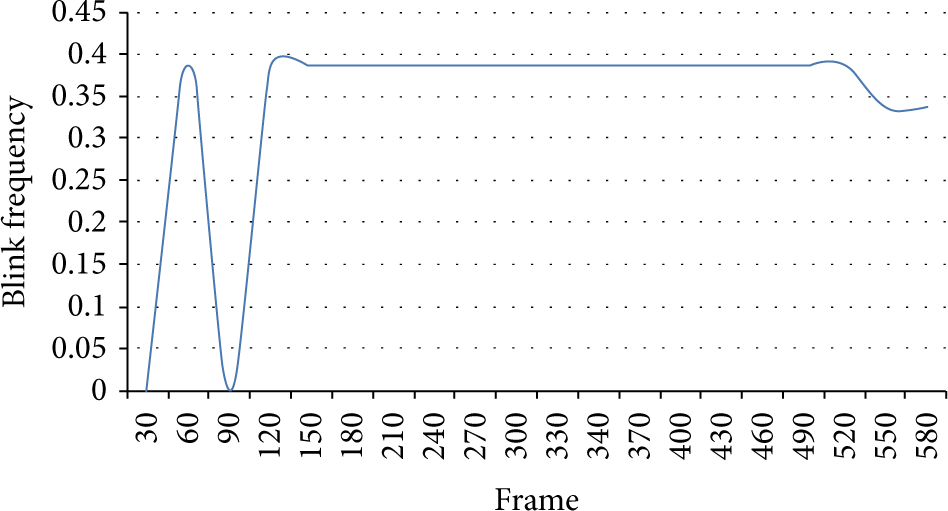
The variety of blink frequency over time in overtaking was shown in Figure 14.

The blink frequency over time while overtaking.
The blink frequency turns out to be an upward tendency at the beginning of overtaking, as it is large for the changes of the amplitude of eye closure. The blink frequency arises to a certain value during the overtaking and is kept at a certain value with little change. The increase of blink frequency indicates that the driver is nervous and concentrated. After overtaking accomplished, the change of the amplitude of eye closure increases and the blink frequency declines.
3.2.2. Passing
Figure 15 shows the scene of passing, and Figure 16 shows the eye closure over time during the whole passing procedure.

Passing in the traffic condition of urban road.
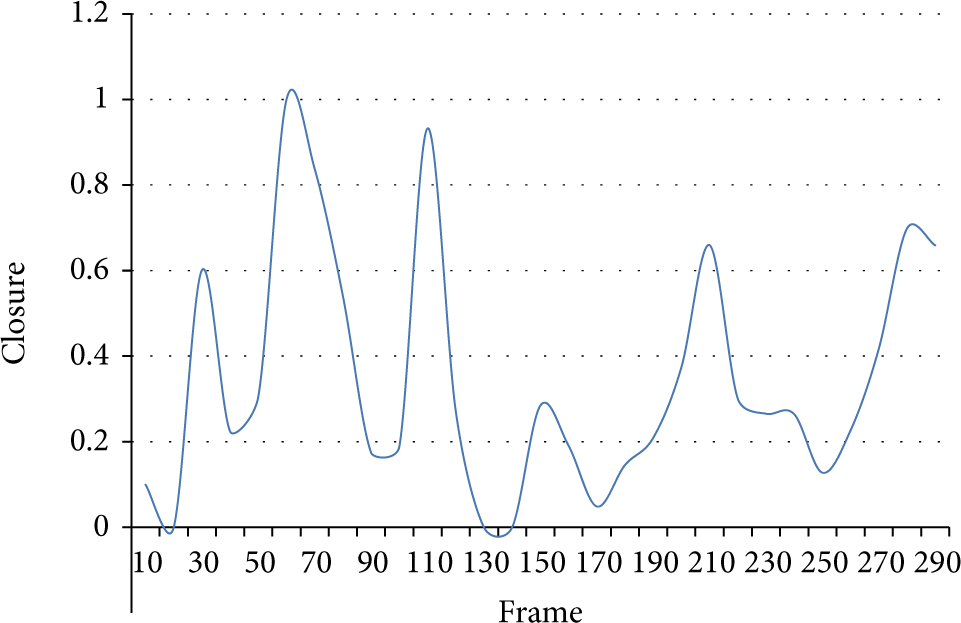
The eye closure over time while passing.
As Figure 16 shows, the value of eye closure gets higher at the beginning of passing, gets lower during passing, and gets higher again when the process of passing comes to an end. On the whole, the change extent is great.
The blink frequency over time while passing is shown in Figure 17.

The blink frequency over time while passing.
During passing, the blink frequency keeps rising and comes to a maximum when the passing is accomplished. The change amplitude of eye closure is large and no distinct regularity is shown, when the blink frequency is changing linearly.
3.2.3. The Practical Influences
The traffic accidents while overtaking and passing usually happen at the first and final stage, when the two visual indicators described above suggest that the psychological attention is just decentralized. Although there are many other causes, which relate to the immediate traffic conditions and environments, of the traffic accidents while overtaking and passing, the improvement of the centralization of drivers’ attention, according to the variation of the two visual indicators, will be helpful to the traffic safety while overtaking and passing in urban traffic.
4. Conclusion
Through numerous tests and measurements over the two parameters, eye closure and blink frequency, with the help of eye movement equipment, the changing tendency of the two parameters turns out to be a regular pattern, in the typical urban traffic conditions. The blink frequency becomes higher and the changing amplitude of the eye closure is large, when complex traffic conditions such as overtaking turn out. It means that the complex conditions need more attention from the driver to treat them. The practical study and analysis could provide practical references for further research and application on the drivers’ psychological characteristics and reduce the rate of the accident. A warning system, against the decentralization of the driver's physiological attention, built on the real-time analysis on the driver's visual characteristics, may become a viable choice as further application.
Conflict of Interests
The authors and coauthors of the paper, declare that there is no conflict of interests. They have fully communicated with each other and have no conflict in the involved work or the submission of the paper. They also have no financial or personal relationships with other people or organizations that can inappropriately influence their work, and there are no professional or other personal interests of any nature or kind in any product, service, and/or company that could be construed as influencing the position presented in, or the review of, the submitted paper entitled “Study on driver visual physiological characteristics in urban traffic.”