
Abstract
A design methodology which uses the regenerative brake model is introduced to determine the major system parameters of a parallel electric hybrid bus drive train. Hybrid system parameters mainly include the power rating of internal combustion engine (ICE), gear ratios of transmission, power rating, and maximal torque of motor, power, and capacity of battery. The regenerative model is built in the vehicle model to estimate the regenerative energy in the real road conditions. The design target is to ensure that the vehicle meets the specified vehicle performance, such as speed and acceleration, and at the same time, operates the ICE within an expected speed range. Several pairs of parameters are selected from the result analysis, and the fuel saving result in the road test shows that a 25% reduction is achieved in fuel consumption.
1. Introduction
Facing more and more stringent emissions regulations and the world ever-increasing petrol price, the automotive industry is looking for cleaner and more efficient powertrain for the next generation of vehicles [1]. Hybrid electric vehicle (HEV) which combines the traditional internal combustion engine with the electric motor and batteries is the prime choice for automakers as the next generation of alternative powertrain because of its good fuel economy and better operating range compared to the traditional vehicle and acceptable price and cost. Many Chinese bus manufacturers and powertrain producers are engaged in projects to develop clearer and more economical hybrid buses to meet the requirements [2].
City buses often have low average speed and rapidly accelerated movement when they move in city routes. In order to transfer more and more heavier guests, most cities of China adopt the 12 m long buses. The average speed is less than 35 km/h, and the distances between two stops often are less than 500 meters, even if there exit many traffic lights between them. In most situations, the maximal velocity of city buses is less than 50 km/h. Naturally the hybrid system should be able to emulate the engine driving in low speed, to recover the brake energy, and to stop the engine when the bus is in stops or waiting for the traffic lights [3, 4].
The EV function uses the motor to drive the bus from zero to a certain speed, so the start process of low efficiency clutch-slipping, high fuel consumption, and high emissions in traditional engine buses is avoided.
The larger the brake regeneration is, the better the fuel economy is. To increase the brake regeneration, the engine must be disengaged from the powertrain to avoid its friction.
The Stop & Go function enables the engine to shut down when the vehicle is waiting and the engine is idling. In city conditions, this function is important because there are too many traffic problems.
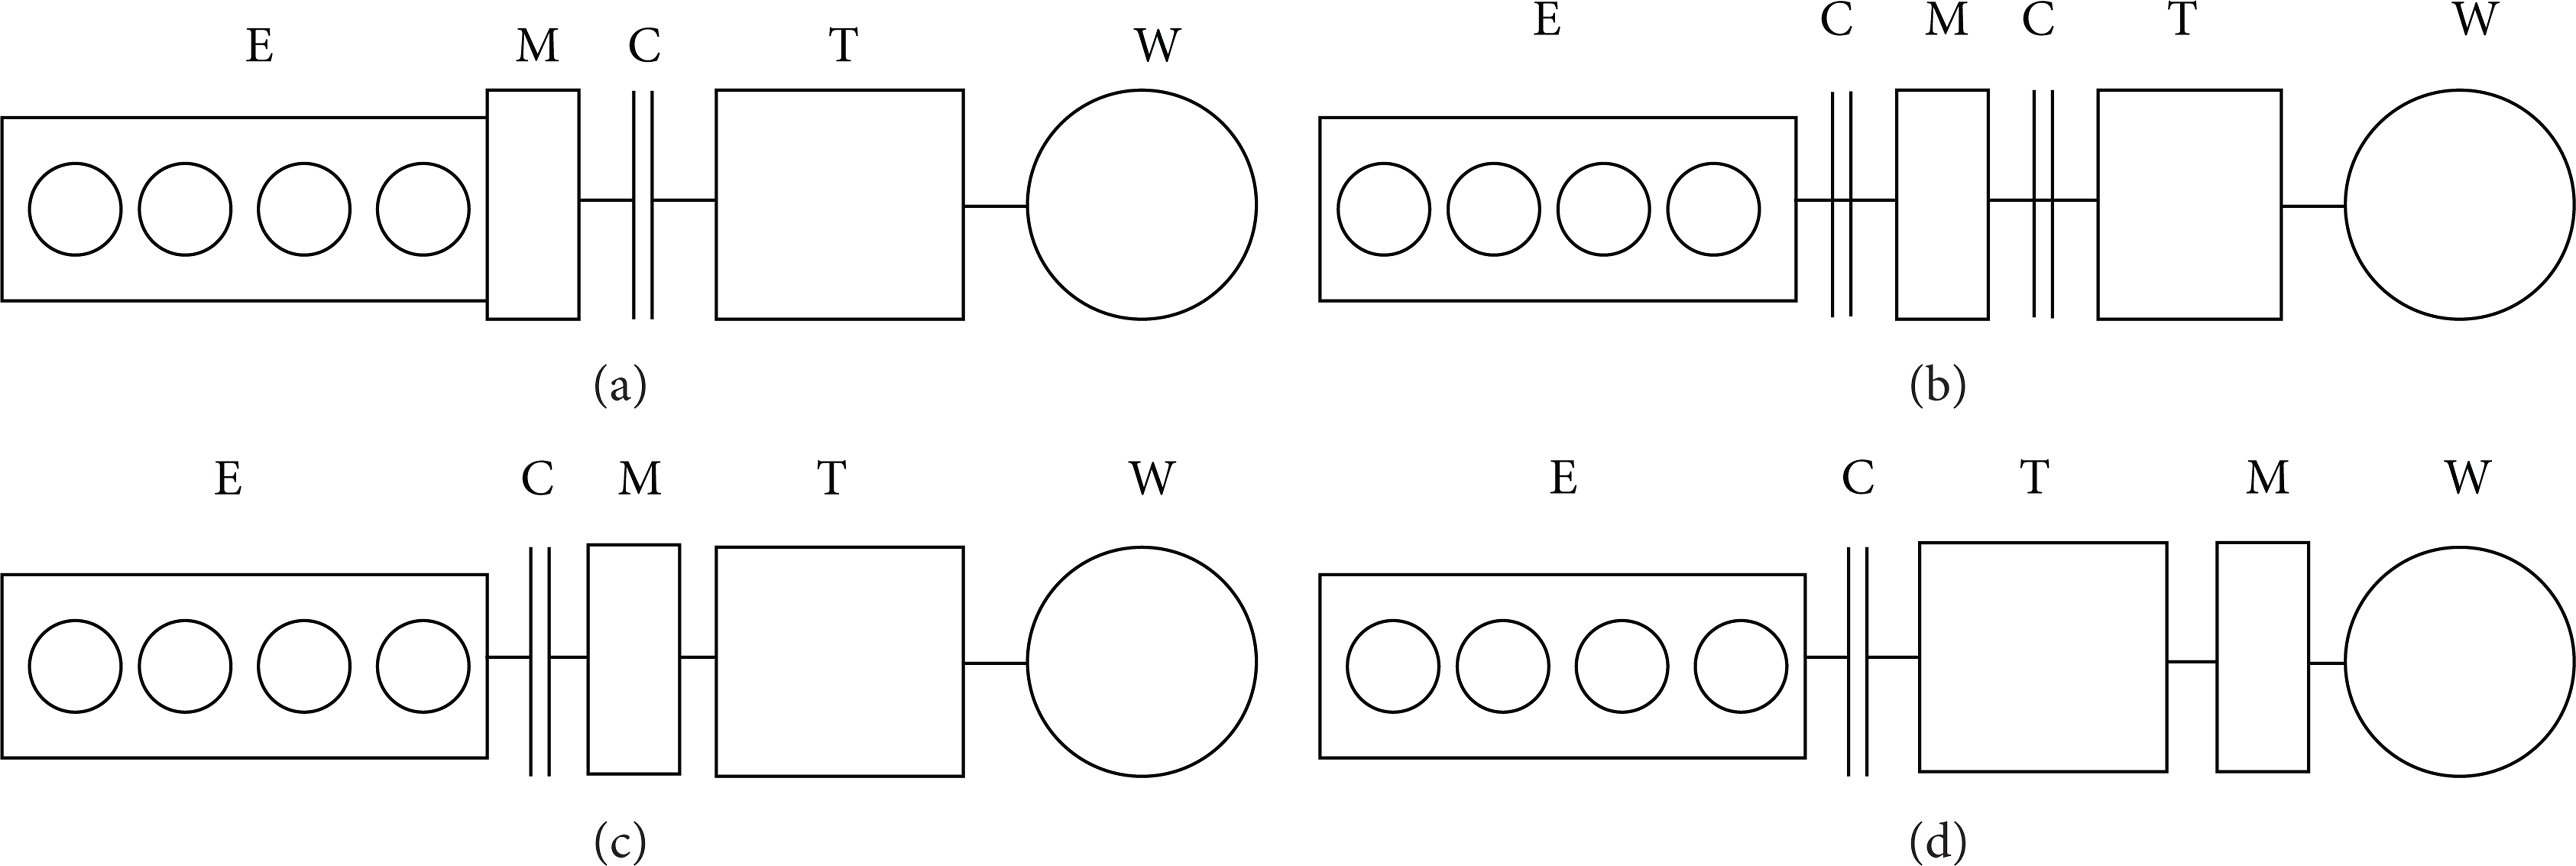
Four parallel hybrid schemes are compared as shown in Table 1. When the vehicle is braking, the motor in scheme (a) cannot recover the maximal regenerative energy because the clutch cannot be opened. In scheme (b), the mechanical construction is complex and hard to realize in buses. About the scheme (d), the motor speed and torque are lower than those of other three schemes because the speed and torque cannot be amplified by the transmission; thus in order to achieve the same drivability as the schemes (b) and (c), the maximal motor torque should be further amplified. From this analysis, the scheme (c) might be the most suitable powertrain for buses. In this paper the scheme (c) is called the postparallel hybrid system because the clutch is positioned after the clutch. There are many prototypes of this scheme like Eaton and Volvo.
Comparison of parallel configurations of hybrid system.

For the parallel-series hybrid vehicle [5, 6] as the configuration in Figure 1, the complex mechanical design has prevented its application as a main hybrid topology. As the configuration in Figure 2, the parallel-series scheme is an improvement of series hybrid which adds a clutch between the generator and the motor; thus the engine can drive the vehicle in a proper speed range, and the overall efficiency can be improved compared with the pure series hybrid because the energy conversion process is avoided when the engine drives. The parallel-series hybrid also has many applications like the hybrid system of Golden Dragon Bus Company [7].
Constructions of parallel hybrid electric vehicle.
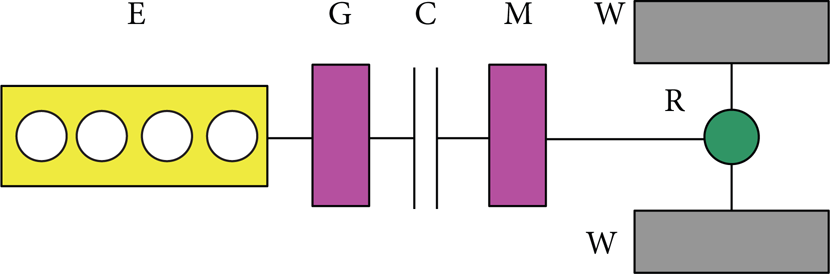
Constructions of parallel-series parallel electric vehicle (E: engine, C: clutch, G: generator, M: motor, R: final reducer, and W: wheel).
Previous work about hybrid design often concentrated on control strategy development [8, 9]. Actually the parameter design plays an important role same like the control strategy. The parameters of the hybrid powertrain do not include only the parameters about the motor and battery, like the power rating of engine and motor and the maximal torque of electric motor, but also about the gear ratio of transmission and final reducer. From the vehicle dynamics theory, the gear ratio belongs to the traditional vehicle optimal work, but it also affects the regeneration energy. The parameters about the motor and battery should be solved by the hybrid vehicle model. For example, the regeneration model is built to study the influence of the motor rating.
This paper tries to demonstrate a matching strategy or methodology which can solve the matching problem in parallel hybrid vehicle. The prototype vehicle is mainly bus because the potential users of hybrid system are city buses in China. The requirements and restrictions of city buses are introduced with a detail illustration of the hybrid vehicle models, and the parameters matching process is fully described to thoroughly analyze the influence of each parameters; also the hybrid control strategy used in this paper is briefly introduced.
2. Operation Modes of Hybrid System
The operation modes of postparallel hybrid electric vehicles are listed below:
EV: normally the conventional bus accelerates from 0 to a certain velocity using the slipping effect of the clutch or the hydraulic couple in AT, but for hybrid system the bus is only driven by the motor until the speed is above the idle speed, so the inefficient slipping process is avoided.
Boost: when the driver presses the pedal fully, the motor will assist the engine to lighten the burden of diesel engine and keep it running in low load zone to improve the fuel economy.
Pure engine drive: in middle and high velocity, the transmission often shifts to high gear and the efficient way is to drive the bus directly by the engine. In this case, the motor will not work even if batteries’ energy is high enough. However in the case that the battery energy is too low, the engine should provide additional power to charge it.
Regeneration: when the brake pedal is pressed, the motor will produce the negative torque to charge the battery. The greater of the motor power is, the more regenerative energy is recovered.
A typical drive pattern is shown in Figure 3. In actual road, the EV distance might be very long in heavy traffic condition, and the pure engine drive might be very short because the maximal speed in city cycle is often lower than 50 km/h. The battery energy is consumed in EV and boost cycles and replenished by the regeneration; however it might cause over discharge of the battery at low velocity as well as small regeneration condition. The hybrid system control strategy should avoid using the engine to charge the battery directly because of the low efficiency. It implies that the diesel engine should be downsized to avoid too much energy consumption to charge the battery in boost cycle. However if it happens, the engine would be powerful to charge the battery and to drive the bus at the both time. Thus the target of parameter matching is clarified as follows.
The drivability requirement in boosting and regeneration potential in brake are the main concern for motor design.
Engine power rating should satisfy the power demand in pure engine drive and achieve acceptable dynamics in acceleration without the assistance of the motor.

Operation modes of hybrid system.
3. Engine Matching
The diesel engine is the main power source of the hybrid bus. Normally the engine power capacity should meet the power demand in the highest velocity, and the dynamics factor should be greater than 0.04 in highest gear to overcome the uneven of the road during high speed cruise.
3.1. Engine Power Capacity
The power demand of the vehicle is calculated by

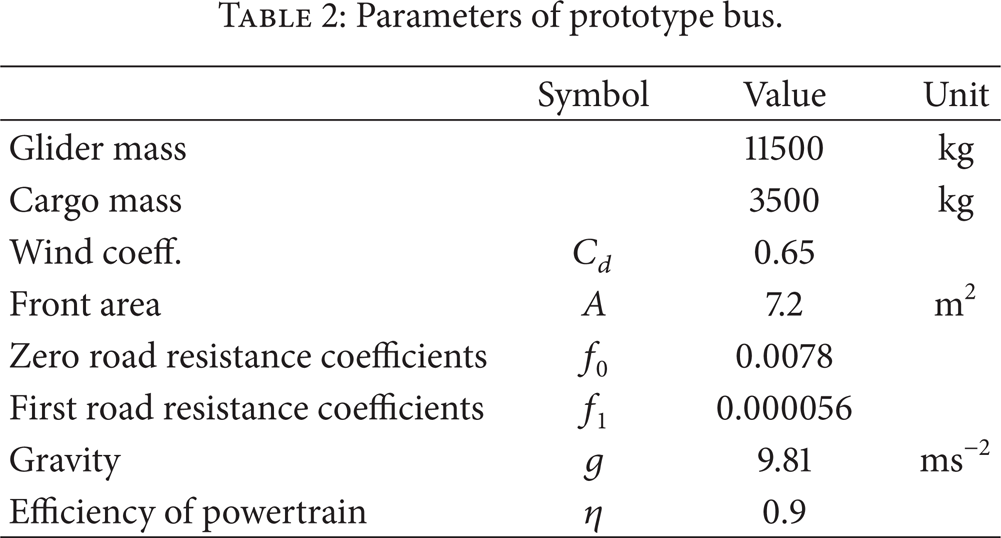
where u a is the velocity in km/h; M is the total bus mass in kg which is the sum of glider mass and cargo mass; θ is the percentage of slope; g is the gravity, 9.81 kg·m/s; A is the frontal area; C d is the wind coefficiency; f0 and f1 are the zero and first coefficients of road rolling resistance. The value of the parameters used in (1) is listed in Table 2.
Parameters of prototype bus.
The power demand versus the velocity is shown in Figure 4.

Resistance power versus velocity at constant speed.
Generally the slope of the overpass is about 4% according to the state standards in most cities. For city bus it is estimated that the maximal velocity will not exceed 50 km/h, and the constant speed to climb the overpass will be 30~40 km/h. Considering the passenger and cargo mass, the total mass of the bus would be 16000 kg and the resistance power is less than 132 kW when the speed is lower than 100 km/h, the same as the power at 44 km/h with a 5% degree slope. Usually there is about 20~25 kW accessories power, such as the air conditioner, fans, and other components. So the total power of the engine would be greater than 150 kW, which is 204 hp. The J-series engine of Yuchai Machinery Corp. has the power from 180 to 245 hp, so the 200 hp diesel engine is selected.
3.2. Average Traction Power
Another consideration is that the average traction power produced by engine will be greater or at least not smaller than the road resistance during the city cycles which has many stop & go situations. Otherwise the battery might not be charged by the regeneration and eventually the charging-drive cannot be avoided.
The average driving power can be calculated by

where σ is the equivalent factor to transform the inertia to traction and other parameters are the same as those of (1). The average power is highly associated with the average velocity, but it is much smaller than the engine power capacity as selected in former section. Thus the engine power design naturally meets the requirements of city cycles.
3.3. Engine Torque Capacity
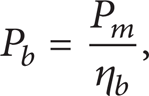
The dynamic characteristics of pure engine drive also should be considered if the battery or motor failed. The dynamics factor which indicates the acceleration ability and slop-climbing ability is shown in

in which TICE is the maximal torque of engine,TAcc is the accessories torque, as 70 N·m in this case; i g is the gear ratio of the transmission, i0 is the ratio of final reducer, and r is the wheel radius. The transmission and final reducer design will be discussed lately, but for city bus the highest gear is often set as 1, and the lowest gear is 6~7, the ratio of final reducer is often 5~6, and the wheel radius is often 0.5 meter. The maximal torque of the 200 hp diesel engine is greater than 730 N·m, and the D factor of the first gear is illustrated in Figure 5, in which i g is 6 and i0 is 5. D is greater than 20% which means that the dynamics of engine only would be acceptable.

D factor in first gear for 200 hp diesel engine.
4. Motor Matching
The major role of the motor is to propel the vehicle to a certain speed and assist the engine if the driver presses the pedal fully, and to generate electric power to charge the battery when brake is active. A typical motor characteristic is shown in Figure 6; it consists of a torque-constant range and power-constant range. Normally during EV the engine will work in the torque-constant range; thus the maximal torque is decided by the dynamic characteristic or the D factor in same meaning. The maximal power is applied when the bus is braking to recover the electricity as much as possible; thus the turning point and maximal power are decided. Finally the electric power should be balanced for the sustainable drive.

Characteristic of electric power.
4.1. Regeneration Evaluation
When the bus is braking, the electric motor will produce the maximal negative torque to recover the motive energy. The brake force distribution can be shown as

where Tbrake is the total brake force,Twheel is the brake force of the brake disc, and T m is the negative torque of motor. To achieve the maximal regenerative energy,Twheel is set to zero. Thus the equation can be rewritten as

The total electric energy is calculated by
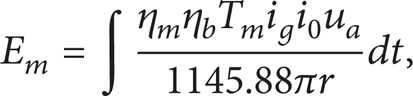
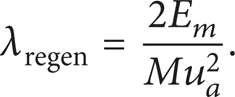
and the efficiency of motor (η m ) and battery (η b ) is set to 90%. Thus the regeneration rate λregen, which is the total regenerative energy versus the motive from a certain velocity to zero, is an indicator to value how the power and the basic point n b affect the brake recovering, derived by
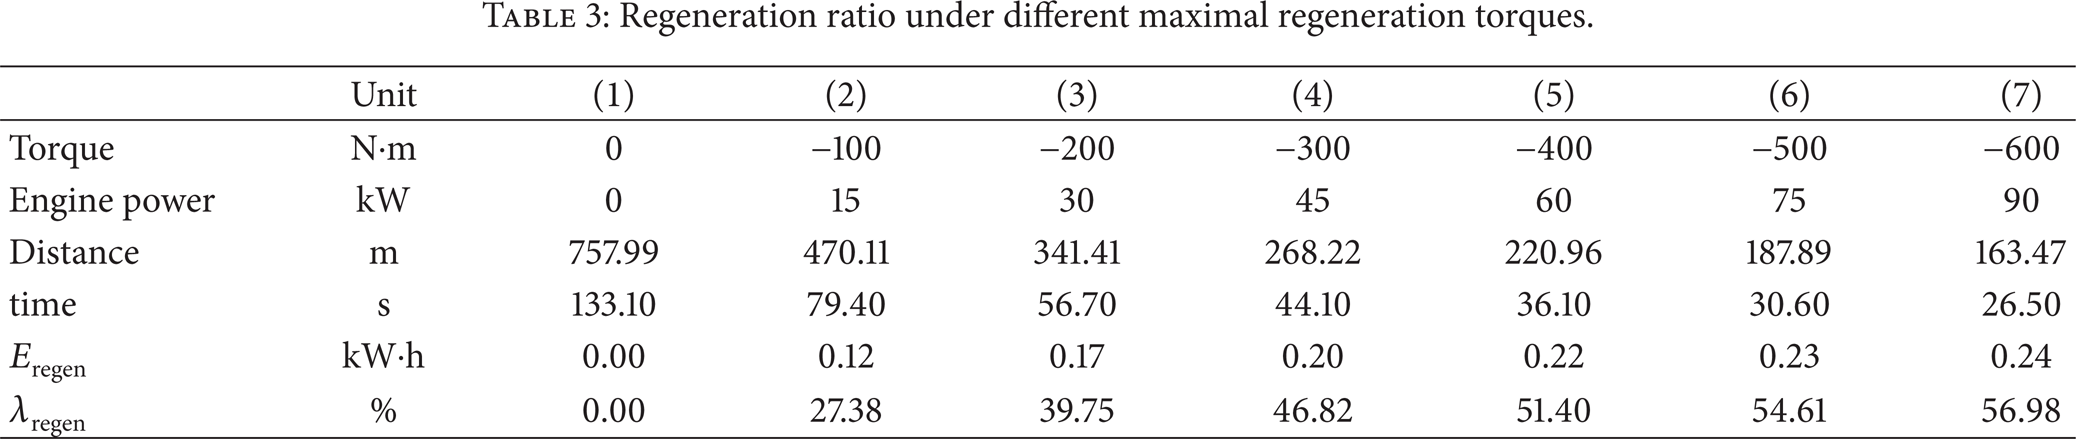
The following chart (Figure 7) is the simulation result of the regenerative brake from 45 km/h. During simulation, a fixed gear is selected, which normally is the highest or the second highest gear; the final reducer ratio is set to 5. And then the maximal motor negative torque and base speed n b have been changed to calculate the regeneration rate. Firstly the base speed of the motor is set to 1400 r/min, and the motor torque is increased by 100 N·m steps. The results are shown in Table 3. The more the negative torque is, the more energy is recovered and the shorter the brake distance and time are. However when the torque increases from 0 to −400 N·m,λregen is increased to 46.8% from 0, but when the torque continues to increase to −600 N·m, there is only 10.16% of regeneration ratio added and the total λregen is 56.98%. Thus the motor negative torque should be −400 N·m or even −600 N·m only if the motor cost allows.
Regeneration ratio under different maximal regeneration torques.

Velocity profile with different motor torque.
Then the torque is set to −400 N·m and the base speed has been changed. If the gear ratio (i g ) is 1, the motor speed is about 1200 r/min. If the second gear is selected and the ratio is 1.5, the motor speed is 1790 r/min. The simulation results of these two kinds of gear ratio are shown in Figure 8, but the different profiles are shown in it. For i g is 1.5 and the initial speed is about 1790 r/min, the higher base speed is, the larger regeneration ratio is. It is because the maximal constant negative force by the motor can be affected more widely as the base point speed is high. However if i g is 1.5, the initial speed is 1200 r/min and the regeneration ratio will not increase if the base point is larger than the initial speed. In fact the drivers of city buses are inclined to change the higher gear to lower the engine speed and lower the fuel consumption further. So in this case for city buses the larger range of the constant power is favorable for the regeneration. From this point of view, the base speed should not be higher than 1200 r/min.

Regeneration ratio under different base speeds.
4.2. Dynamics Evaluation
The motor torque design is to satisfy the pure motor drive and to help the engine when the driver presses the pedal fully. The D factor of the first and second gear should be big enough to overcome the slopes. The D factor is calculated by
where the propelling torque is the motor torque only compared with (8). The D factor of the motor is shown in Figure 9, and the minimal D during the constant torque range is 10% whose motor torque is 300 N·m.

D factor of the motor with different maximal torques.
Also as the EV mode will not be used too much in postposition parallel configuration because the motor will only drive the vehicle to a certain speed until the motor speed is greater than idle speed, the acceleration time is not mainly decided by the motor but by the motor and engine together. The total torque profile shown in Figure 10 is much larger than the D of the motor only or D of the engine only; thus the dynamics would be superior compared with the those conventional buses.

D profile and the torque profile of the powertrain.
5. Gear Ratio Design
From Figure 1, the transmission affects the dynamics and fuel economy in conventional buses, and it also affects the hybrid bus because in postposition parallel hybrid configuration the route of power is the same like the conventional bus [10]. However for hybrid powertrain as the analysis before, the dynamics would be improved greatly with the help of motor. Thus the main consideration of gear ratio design is the fuel economy only. Normally the equivalent fuel consumption, calculated by

is used to evaluate the fuel economy of different gear ratios to compare the fuel economy of different gear ratio groups. Here g e is the equivalent fuel consumption in g/(kw·h), ρ is the density of diesel fuel in g/mm3. For the same diesel engine, g e is same and Q e is influenced by i g and i0 greatly. The relationship of the speed n and u a can be explained

and the equation can be rewritten as

From (11), the first road resistance f1 is very small in buses, so in this equation it has been neglected; thus (11) is rewritten as

where C1 and C2 are constant values. From this equation it can be found that the smaller i g and i0 are, the lower Q e we get for the same velocity.
In Table 4, four groups of gear ratios are shown and final reducers and also their value of n/u a are shown in Table 5.
Combination of i g and i0.

Result of n/u a (r = 0.5).

Q e of groups A and B are shown in Figure 11 and Q e of groups A and C are shown in Figure 12. It can be seen from Figure 10 that the curves of Q e of the high gears are drifted from higher range of group B to lower range of A. Thus the smaller the i g is, the lower total fuel consumption is. In Figure 12 only curves of Q e of the gears III and IV are drifted from higher ranger of C to lower ranger of A, but the curves of Q e of the gears V and VI are almost the same. But for city bus the gears III and IV are the most used gear; thus lowering the final reducer will decrease the fuel economy further.

Fuel consumption comparison of groups A and B.

Fuel consumption comparison of groups A and C.
6. Battery Matching
6.1. Power Matching
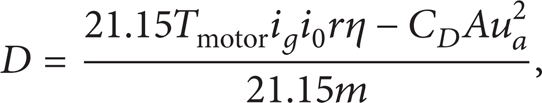
The battery's power selection is decided by the maximal electric power of motor as shown in
where η b is the charge and discharge efficiency of battery, P b is battery power, and P m is motor power. Thus if the maximal power of electric motor is 70 kW, the maximal battery power is 85 kW.
Li-ion battery is widely used in hybrid electric vehicle because of its high power density (ρ P , W/kg) [11]. Generally the charging power density ρ C and discharging power density ρ D of battery are different. Table 6 shows the power density, energy density, and other characteristics of two typical types of Li-ion battery cell used in HEV, LiFePO4 (LFP), and LiMn2O4 (LMO). In HEV application, battery pack is often a collection of many cells, and several cells are firstly paralleled together to form a cell module which has greater capacity and then the cell modules are connected in series to battery pack so as to meet the voltage and energy requirement [12].
Characteristics of different Li-ion battery cells.

The number of cell modules n s is decided by the motor maximum voltage demand Vmax, described in

where Vcell_max is the maximum voltage of battery cell. The power demand of each cell P b can be expressed as

The number of parallel cells in cell module n p is calculated by

where Ecell is the nominal energy of each cell. As the charging and discharging power densities are different, in this equation the charging power density ρ C should be used.
The maximum voltage demand of motor is about 400 V and the max cell voltage of LMO battery cell is 4.2 V; thus n s in this case is selected as 96.Pcell is about 0.885 kW; then the n p is 1.5 for LMO battery, so final results n s is 96 and n p is 2 for LMO.
6.2. Energy Matching
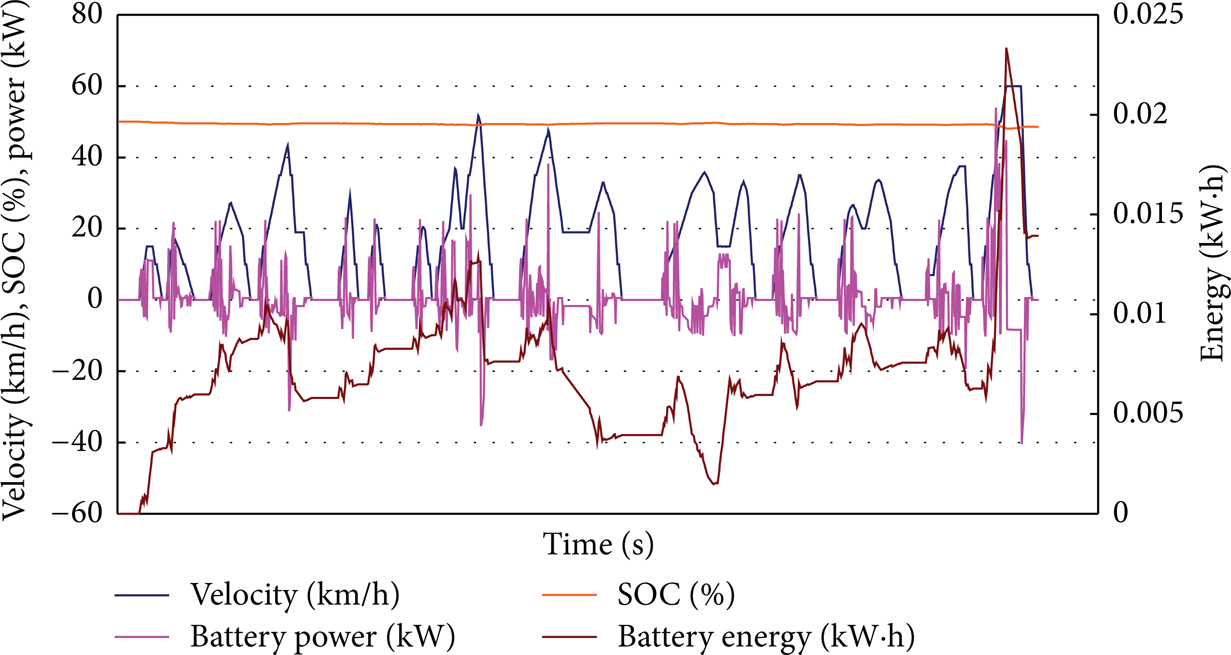
The electric energy requirement will be validated by simulation tools and real road test. The typical Chinese city cycle and EUDC + CTC are used to simulate the electric energy demand for the hybrid bus by advisor. The electric energy is consumed when the vehicle is accelerating in high speed. From Figure 13, the electric energy fluctuation is smaller than 0.12 kw·h. In real road test result shown in Figure 14 which is tested in a typical mountainous city (Chongqing City, China), the maximal electric energy consumption fluctuation is about 2.1 kw·h. From the former calculation, the total energy EBP of battery pack of LMO is calculated as

The SOC using range has been set from 30% to 70%, and the battery pack output is about 2.21 kw·h. Thus the energy of battery pack can meet the energy requirement of hybrid electric vehicle.
Electric energy fluctuation of Chinese city cycle.

Electric energy fluctuation of Chongqing typical cycle.
7. Results Comparison
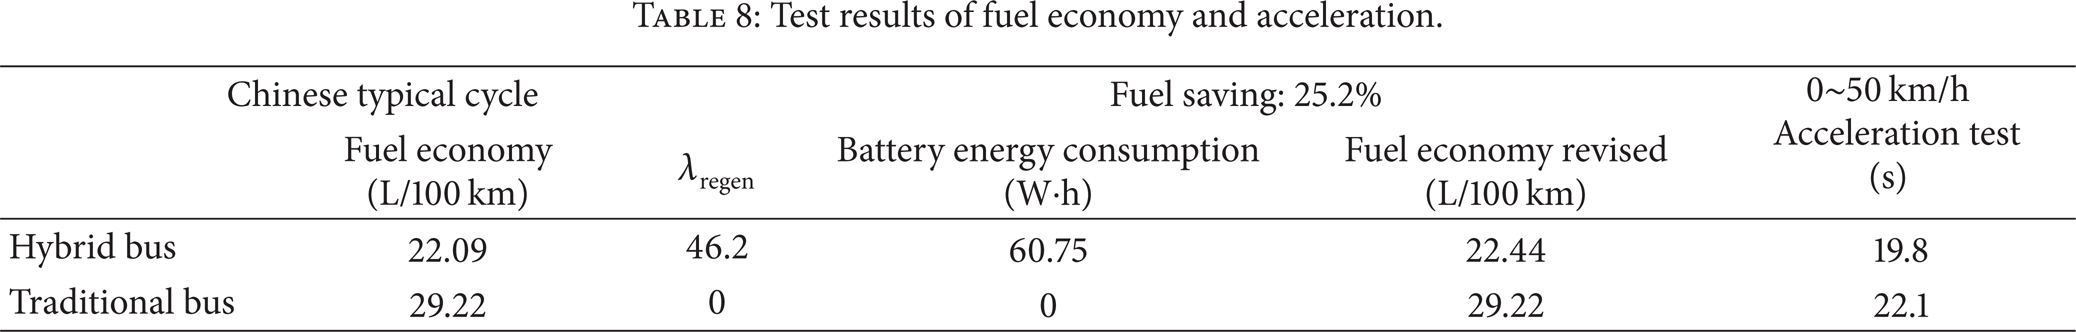
From the former calculation, the parameters of hybrid power train are summered in Table 7. A prototype bus is built and then the experiment is conducted. Test result according to the Chinese State Test Standards [13] illustrated in Figure 13 and Table 8 shows that the regenerative rate is greater than 45%, and the fuel saving is about 25.2% compared to the same size bus with the traditional diesel engine after the fuel consumption is corrected by electric energy consumption. The acceleration test result [14] shows that the 0–50 km/h acceleration time is less than 20 seconds, about 2 seconds faster than the target bus.
Summary of parameters of hybrid powertrain.

Test results of fuel economy and acceleration.
8. Conclusion
The methodology of parameter matching of postposition parallel hybrid powertrain is proven effectively. The keys to this methodology are summarized as following notes.
The engine powerrating is decided by the power demand when the bus is driving in high speed in constant road, the highest gear ratio should match the top velocity with the highest engine speed, and the lowest gear ratio should satisfy the dynamic requirement. To realize the low engine speed in city cycle, the n/V selection should be smaller.
The torque and power matching of motor are affected by the potential of regenerative brake, and a proper regenerative rate should be achieved.
The battery size should satisfy both the electric power requirement and energy requirement during specified drive cycle.
Finally this methodology of parameters matching for postpositioned parallel hybrid configuration could easily extend to other HEV types.
Conflict of Interests
The author declares that there is no conflict of interests regarding the publication of this paper.