
Abstract
Driving process is an information treating procedure going on unceasingly. It is very important for the research of traffic flow theory, to study on drivers' information processing pattern in mixed traffic environment. In this paper, bicycle is regarded as a kind of information source to vehicle drivers; the “conflict point method” is brought forward to analyze the influence of bicycles on driving behavior. The “conflict” is studied to be translated into a special kind of car-following or lane-changing process. Furthermore, the computer clocked scan step length is dropped to 0.1 s, in order to scan and analyze the dynamic (static) information which influences driving behavior in a more exact way. The driver's decision-making process is described through information fusion based on duality contrast and fuzzy optimization theory. The model test and verification show that the simulation results with the “conflict point method” and the field data are consistent basically. It is feasible to imitate driving behavior and the driver information fusion process with the proposed methods. Decision-making optimized process can be described more accurately through computer precision clocked scan strategy. The study in this paper can provide the foundation for further research of multiresource information fusion process of driving behavior.
1. Introduction
With the challenge of substantial increase of information load for its expansion and amplification, the driving behavior has been considered as one of the key factors for research and development of ITS. Driving behavior and its microsimulation study [1–7] has been becoming the front field in transportation, especially the traffic flow research. In the past years, the driving behavior and its simulation research in traffic flow theory mainly focused on that of the object car between front and back ones, considered as car-following and lane-changing process, and there were lots of achievements [6, 8–18]. Chen et al. [19] proposed a unified car-following model to simulate different driving scenarios, including traffic on highways and at intersections. The mesoscopic headway distribution model and the microscopic vehicle interaction model were considered in their study. Furthermore, Li et al. [20] proposed an asymmetric stochastic extension of Tau's theory to study the asymmetric car-following behaviours. However, the diversity, fuzziness of the factors influence driving behavior, and the driver's adaptability in traffic network, as well as the driver's multi-information fusion, task concentration, and cooperative reaction mechanism during driving process, were not considered enough synthetically in the previous study. In recent years, a kind of car-following model based on task concentration and cooperative reaction mechanism of the driver was constructed by X. Wang and L. Wang et al. [21–23]. Bayes, fuzzy integral, and other methods to fuse multi-information were used in this model. Subsequently, the research was further extended by Wang and Yang et al. [24–30], where driving behavior models based on integrated cognition and sequential activity chain were established and used to freeway lane control simulation systems, and the stimulation from different vehicles in “interest induction zones” (the same lane and adjacent lanes) to object vehicle was considered, and the lane control signal was exploited as an additional information channel perceived by the driver at the same time. The influence of multichannel information is studied with multi-information fusion and cooperative control theory [31–35].
Bicycle is an important information source that stimulates and affects driving behavior in the mixed traffic environment. Though it can be solved basically on three-slab urban road (urban roadway is divided into three slabs by two separate belts: in the center is a motorway and nonmotor vehicle lane lies on both sides of motorway), the problem of mixed traffic still exists in most cities of China for lacking of such kind of the road [36–43]. The study of the problem caused by mixed traffic of vehicles and bicycles is not sufficient in developed countries, because their traffic is fundamentally made up of vehicles but not bicycles or two mixed. About the mixed traffic, Wang and Nihan [44] studied the characteristics of motor vehicle-bicycle conflict at signal intersection. Jia et al. [37, 45] researched the friction interference of bicycles on motor vehicles driving on the sections of typical road and quantitatively analyzed the velocity changing tendency of vehicles under different bicycle interference, velocity distribution frequency, and critical transformation of different interference state. Lu et al. [46] established the bicycle density-velocity relationship model for mixed traffic conditions; the suitable condition is only for uncongested and stable bicycle traffic flows. Liang et al. [47] established a travel time model of the right-turn motor-vehicle and described the behavior of the nonmotor-vehicle on the analysis of the conflict between the right-turn motor-vehicle and the straight-going bicycle at 4-phase signal intersections. Chen et al. [39] analyzed the speed characters under mixed traffic conditions; it is found that a linear trend exists in the evolvement of motor vehicle speed because of bicycles influence. Liu et al. [40] described the releasing characteristics of pedestrians and bicycles in urban signalized intersection of green time and analyzed the variation of the inner structure of the conglomeration. Shen et al. [48] developed a conflict probability model to quantify the conflict of motor and nonmotor mixed traffic at urban intersections; the results indicate that the conflict probability increases with the volume of non-motor increasing through an actual example. Liang et al. [41] analyzed conflicting pedestrian and nonmotor volumes' impact on capacity under mixed traffic conditions using the equivalent first discharge headway model. Prasetijo et al. [49] developed a new method of capacity analysis at unsignalized intersections under mixed traffic which is based on the interactions between conflict streams (six streams and six conflict points) having the average speed and flow of each stream. Li and Wang [50] studied the vehicle gap distribution of the mixed traffic flow under the different delay probability and the different mixing rate for given vehicle density using the cellular automaton traffic flow model. About the mixed traffic simulation study, some researches have been carried out but not detailed enough to apply in engineering. Yang et al. [51] introduced a preliminary study on mixed and disordered traffic microscopic simulation, with the emphasis on traffic participant modeling, especially the decision-making part. Li et al. [52] gave a scheme for the validation of the mixed traffic microsimulation prototype system. Li et al. [53] analyzed the microscopic behaviors of the motor vehicles passing through the bicycle flow at a two-phased signalized intersection and described the motor vehicles' passing decision by BP neural network model. Vasic and Ruskin [54] studied a novel technique to simulate combined car and bicycle traffic for two elemental scenarios, based on one-dimensional cellular automata components, for modeling network infrastructure and its occupancy by vehicles. From the history of the mixed traffic study we can see that most of the existing researches are related to macroscopic characteristics analysis of the mixed traffic and are not deep enough. As for the microscopic simulation modeling and analysis methods, few works have been concerned. So, there is an important theoretical and practical significance to developing driving behavior simulation models that adapt to the mixed traffic environment in developing countries such as China through studying the modeling theory and methods which consider the influence of bicycles. In this paper, bicycle is considered as a kind of information source to vehicle drivers. The influence of bicycle on driving behavior is calibrated into a critical region of a round: the friction interference and the block one [55] of bicycles to vehicle in the intersection and road section are analyzed in mixed traffic environment through a new established “conflict point method” in this paper. “Conflict” is studied and translated into a special kind of car-following or lane-changing process. Thereby, modeling and simulation of driving behavior in mix-traffic environment are carried out. On the other hand, precision double clocked scan is applied during the simulations in this paper, to keep the accuracy of models. In the process, the influence of decision-making reaction time is considered; the weight vector and relative subordinate degree matrix of influencing factors for driving decision are decided based on duality contrast. The fuzzy optimal theory is used in information fusion, the driver's decision-making is obtained, and the action of driver to complex information can be reflected more exactly.
2. Emerging of the “Conflict”
In China, the influence of nonmotorized vehicles on vehicles is divided into friction interference and block interference, which are considered as vehicle-bicycle conflict in this paper. Friction interference is when the object vehicle is laterally closed to a nonmotorized vehicle, the situation in which the vehicle speed will be reduced by the driver to ensure safety. Block interference is that the vehicle is forced to be slowed down or stopped because it is obstructed by nonmotorized vehicle. Under such situation, delay is caused. The different state of “conflict” in intersection and road section is introduced as follows.
2.1. Emerging of the “Conflict” in Intersection
In mixed traffic environment, there are large numbers of “conflicts” among vehicles, bicycles and pedestrians from different directions in intersection. The “conflicts” between vehicles and bicycles in China are caused by the following: the “conflict” between straight-through vehicles and left-turn bicycles in the same and opposite directions; the “conflict” between right-turn vehicles and straight-through bicycles; and the “conflict” between left-turn vehicles and straight-through bicycles in opposite direction. They all belong to block interference basically. Moreover, the more the bicycles (moving as bicycle group) entering the influence area are, the less the critical gap for vehicles will be, the greater the influence on drivers will be, and the more heavy the delay will be.
The bicycles in intersection are usually not as scattered as that in road section. Due to the influence of signal lights, as well as people's mass-following psychology, a large number of bicycles get across the intersection in group. There are some differences about the characteristics between single bicycle and bicycles group. The influence of a bicycle group on drivers is greater than that of a single bicycle. Through the study of the relationship between the influence of bicycles on drivers and the number of bicycles in China, the critical number of bicycles to cause the vehicle shut down is 8 [56]. When the number of bicycles is over 8, vehicle will slowed down till it stops and will not travel through until the bicycles have gotten across generally. When the number of bicycles is under 8, drivers do not stop but travel through the critical gap.
2.2. Emerging of the “Conflict” in Road Section
Bicycle is a kind of a flexible, economic, and nonpolluting means of transportation with two states of movement: go and stop. When moving, the track of bicycles is waved and quite different from that of the vehicles, and the swing range to left or right is 0.2 m separately [57]. On the other hand, when the traffic of bicycle is large enough, vehicle lane is always used by riders in order to surpass other bicycles or sheer off the pit, trench, and so forth, in the front of the road. In addition, when meeting acquaintances or being interested in something on the other side of the road, riders often disobey traffic rules and get across the road because of the freedom degree of bicycles in China. The “conflict” between vehicles and bicycles in section is caused by and includes both friction interference and block interference.
On the roadside if the lane width is 4.27 m or more, there is not any influence for bicycles on driving behavior. On the road that the traffic of bicycles is less than 50 bicycles/h, the influence of bicycles can be ignored, unless the lane is very narrow (≤3.35 m) [58]. But, the above two points are not in accord with the situations of most cities in China. The influence of bicycle on driving behavior should be considered in most situations, because the width of urban road is general between 3.50 to 3.75 m and the traffic of bicycles is far more than 50 bicycles/h. The closer the vehicle is to the bicycle lane, the greater is the influence.
3. Conflict Point Method
The idea of the “conflict point method” is shown with the “conflict” between vehicles as an example.
3.1. Basic Idea of the “Conflict Point Method”
The basic idea of the “conflict point method” is that the “conflict” is studied as a special car-following, and the two objects included in “conflict” are analyzed within the “conflict round” whose center is conflict point and the radius is a certain length.
3.2. Introduction of the “Conflict Point Method”
The “conflict point method” is introduced by citing the “conflict” between left-turn vehicles and straight-through ones in the opposite direction in an intersection. The conflict point is the point that vehicles meet with each other after traveling some distance. In intersection, the conflict point is generally considered as the point of intersection of two perfect tracks when driving under rules. The speed of vehicles is assumed identical basically for simplification. The round in which the center is the assumed conflict point C and the radius is the mutual influence critical distance L is called conflict round (such as the left one in Figure 1). In the figure, V-straight stands for straight-through vehicle, and V-left stands for left-turn vehicle.

Conflict round.
The analysis of “conflict point method” is as follows.
Such as the left one in Figure 1, when the left-turn vehicle just comes into the conflict round C without any vehicles in opposite direction, the vehicle will go across the conflict point freely. In other words, the vehicle is treated as the leading-car of the car-following model.
Such as the middle one in Figure 1, when the left-turn vehicle just comes into the conflict round C with a straight-through vehicle that has not gone across the conflict point in opposite direction, according to the principle of straight-through vehicle first, the vehicle in opposite direction will go across the conflict point freely and is treated as the leading-car of the car-following model, while the left-turn vehicle is treated as the following-car (in the figure, d2 stands for the distance from the head of the left-turn vehicle to the centre of the round; d1 stands for the distance from the head of the straight-through vehicle to the centre of the round). Therefore, the vehicle distance (the distance from the head of object vehicle to the nearest point of the leading-car) is d2 + d1.
When the left-turn vehicle just comes into the conflict round C with a straight-through vehicle that has gone across the conflict point while the second one has not gone into the conflict round in opposite direction, both the two vehicles will go across the conflict point freely (such as the right one in Figure 1). If the second one has gone into the conflict round, according to the principle of straight-through vehicle first, the second vehicle will go across the conflict point freely and is treated as the leading-car of the car-following model, while the left-turn vehicle is treated as the following-car, just as process (2).
4. Modeling of Driving Behavior Based on the Conflict Point Method
Based on the different characteristics between vehicles and bicycles, the “conflict point method” can be improved and the “conflict” is studied as a special car-following or lane-changing.
Making a round with the conflict point as the centre, choosing the radius based on different situations, and putting the two objects included in “conflict” into the mutual influence region, the driving-behavior model regarding the influence of bicycle is established. The key point of this method is the determination of the influence radius. The influence radius is different for different situations, which is mainly determined by the speeds and characteristics of the two objects included in “conflict.” The conflict point is generally considered as the point of intersection of two perfect tracks. In fact, the conflict point is a moving point, because the bicycles are unstable and the tracks are unfixed.
The traffic characteristics of vehicles [59–65] are as follows.
They include high speed, excellent braking capability, and stability.
The reaction time of driver is between 1 s and 2 s and is usually 1.5 s.
When running on road, the basic characteristics include four states: free traveling, following, lane-changing, and overtaking.
The vehicles generally run on vehicle lane, because it takes up large area and the flexibility is poor.
In the running process, the characteristics about different types of vehicles and drivers are different.
The traffic characteristics of bicycles [59, 66] are as follows.
Generally speaking, the length of a bicycle is 1.9 m and the width is 0.6 m. The width of bicycle lane is 1.5 m and a safe space of 0.25 m is designed on each side. So, the practical width of bicycle lane is (B + 0.5) m (B stands for the number of bicycle lanes).
The swing range to left or right is 0.2 m.
The average reaction time of riders is about 1 s.
The features of sway, grouping, polytropy, flexibility, and compressibility are the characteristics of bicycles.
The operation practice in China shows that bicycles possess much more road right than vehicles.
When running, the speed of riders is different because of the differences of sex, physical force, age, and character.
The “conflict” between vehicles and bicycles in intersection and the situation when bicycle get across the road in section generally belong to blocking interference. The influence between vehicles and bicycles in the same direction belongs to friction interference. The above two conditions are analyzed, respectively, by “conflict point method” in this paper.
4.1. “Conflict Point Method” in Block Interference
There is a great speed difference between bicycles and vehicles, so the critical distances of mutual influence are different. Therefore, their influenced region should be represented as two concentric rounds but not one circle.
Once the directions of the bicycles and vehicles are fixed on, the location of the conflict point can be sure basically. Rounds C1 and C2 are made with the conflict point as center and the critical mutual influence distances L1 and L2 between bicycle and vehicle as radius, shown as the left top one in Figure 2, where V-vehicle stands for right-turn vehicle, and V-bicycle stands for straight-through bicycle. Because of the differences of sex, physical force, age, character, and so forth, the speeds among bicycles are different and so are vehicles. In order to ensure safety, the distance at which drivers and riders must make their decision is regarded as the critical distance in this paper. The distance is defined by [59]

where a stands for acceleration; t stands for reaction time; V stands for vehicle speed; and L0 stands for the safety distance between vehicle and bicycle, which will always be 1 meter in this paper. The average reaction time of riders and drivers are about 1 s and 1.5 s, respectively. The acceleration of vehicle is 2.5 m/s2 under normal situation and 7.3 m/s2 under urgent situation. The average acceleration of bicycle is generally between 4 m/s2 and 8 m/s2 [67].
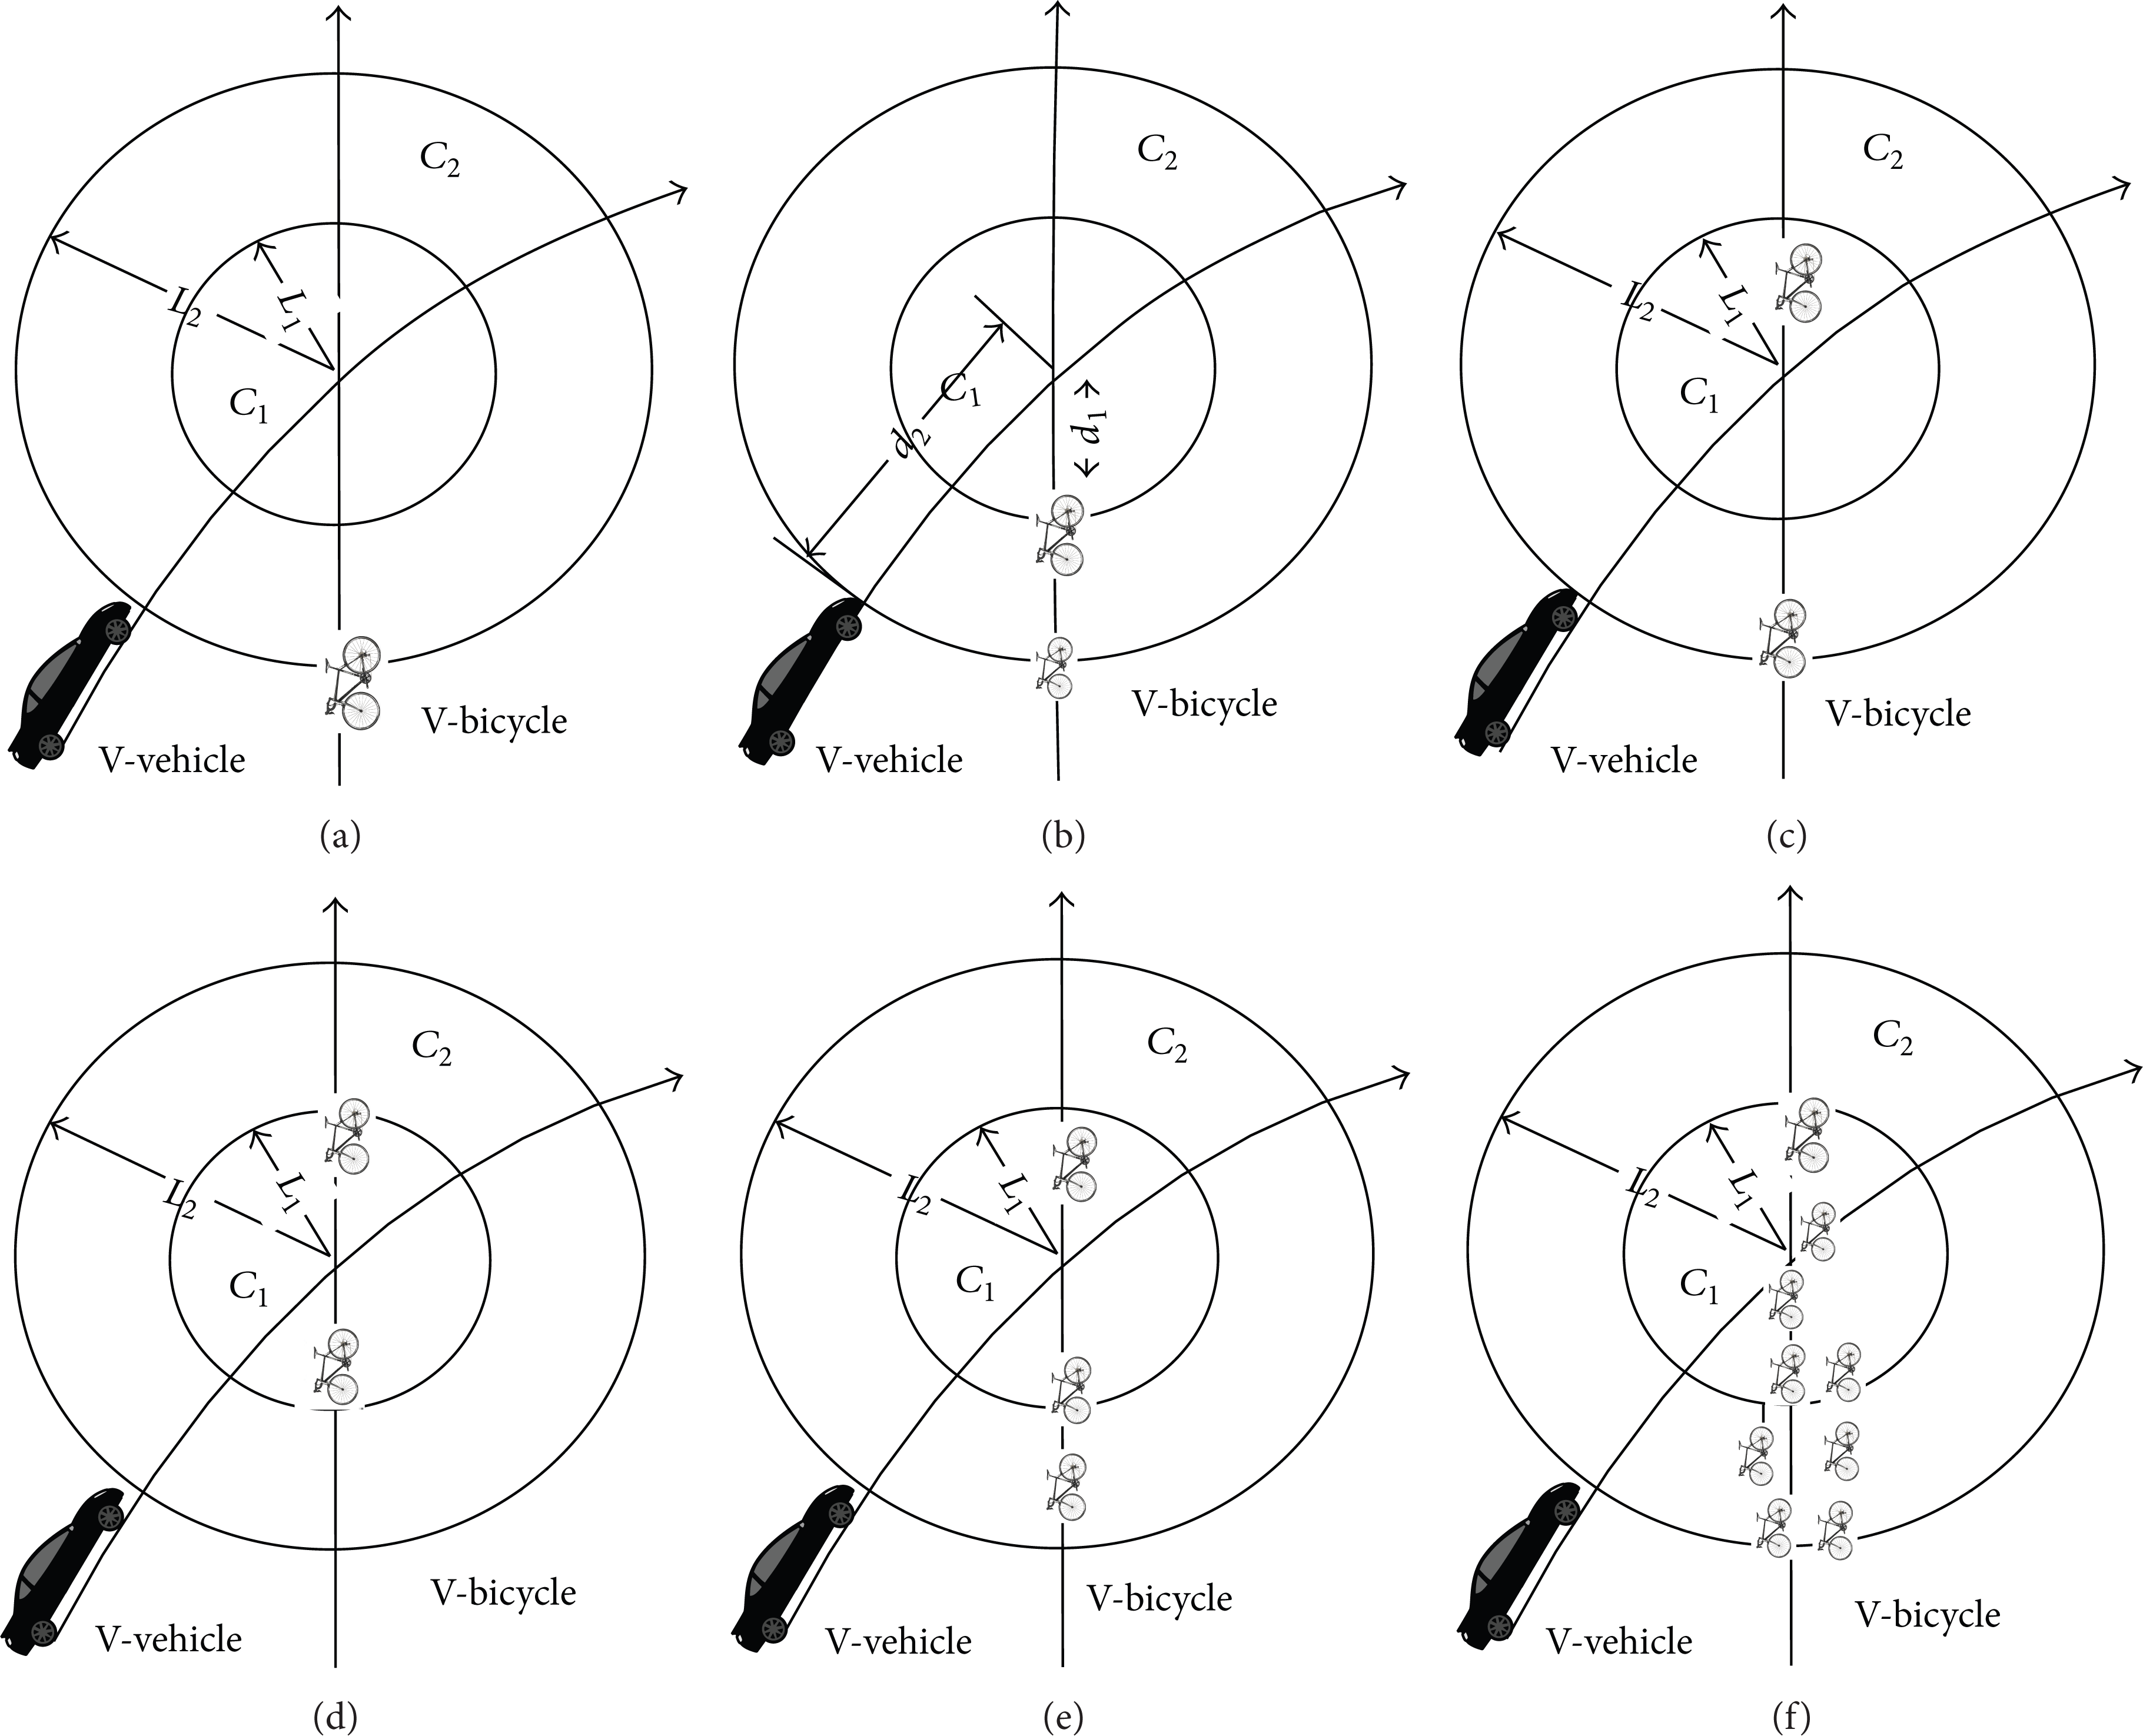
Conflict round in block interference.
Analysis of block interference is as follows.
Shown as the left top one in Figure 2, when the vehicle just comes into the conflict round C2 and there are no any bicycles in the conflict round C1, the vehicle will get across the conflict point freely. In other words, the vehicle is treated as the leading-car of the car-following model.
Shown as the top middle one in Figure 2, when the vehicle just comes into the conflict round C2 and there is one bicycle which has not gotten across the conflict point but has come into the conflict round C1, according to the principle that bicycles possess much more road right than vehicles in China, the bicycle will go across the conflict point freely and is treated as the “leading-car” of the car-following model, while the vehicle is treated as the following-car (in the figure, d2 stands for the distance from the head of the vehicle to the centre of the round; d1 stands for the distance from the head of the bicycle to the centre of the round). Therefore, the vehicle headway is d2 + d1.
Shown as the top right one in Figure 2, when the vehicle just comes into the conflict round C2 and there is one bicycle which has come into the conflict round C1 and gone across the conflict point while the second one has not come into it, both the vehicle and bicycle will go across the conflict point freely. If the second one has come into the conflict round C1 (shown as the lower left one in Figure 2), according to the principle of bicycle first, the second bicycle will get across the conflict point freely and is treated as the “leading-car” of the car-following model, while the vehicle is treated as the following-car, just as process (2).
Shown as the lower middle one in Figure 2, when the vehicle just comes into the conflict round C2 and the bicycles have come into the conflict round C1 with group, if the number of bicycles is not more than 8, the situation is just as process (3); if the number of bicycles is more than 8 (shown as the lower right one in Figure 2), drivers will slow down to a stop generally and will not travel through until the bicycles have gotten across the conflict point.
4.2. “Conflict Point Method” in Frication Interference
Because of the instability, the track of bicycle is waved with a swing on each side. At the same time, the vehicle also has a small swing. So, a minimal side distance must be satisfied between vehicles and bicycles. On the other hand, when the traffic of bicycles is large enough, riders may make use of vehicle lane in order to surpass the anterior bicycles and bear off the vehicle lane after surpassing the anterior ones. When the driver finds that there are some objects in front or at roadside and the distance is less than the minimal safety spacing, the driver must make a decision whether to slow down or to change lane at a certain distance (L m). In order to ensure safety, the distance at which drivers must make their decision or the minimal side spacing between bicycle and vehicle are regarded as the critical distance. The distance (L m) is defined by (1) and the minimal side distance is always 1 m [59] in this paper.
For friction interference, vehicles and bicycles are in the same direction, which is different from that of block interference. The conflict point is supposed as the point of intersection of the vehicle track and the bicycle transverse swing track. Rounds C1 and C2 are made with the conflict point as center, the minimal side distance L1 (1 m), and the distance that drivers must make their decision L2 as radius. Shown as the left one in Figure 3, V-vehicle stands for vehicle, and V-bicycle stands for bicycle.

Conflict round in friction interference.
Analysis of friction interference is as follows.
Shown as the left one in Figure 3, when the vehicle just comes into the conflict round C2 and there is not any bicycles in the conflict round C1, the vehicle will get across the conflict point freely. In other words, the vehicle is treated as the leading-car of the car-following model.
Shown as the middle one in Figure 3, when the vehicle just comes into the conflict round C2 and there is one bicycle that has come into the conflict round C1, the bicycle is treated as the “leading-car” of the car-following model or lane-changing model, while the vehicle follows or changes the lane. The vehicle will not accelerate until getting across the conflict point or bearing off the influencing distance of bicycle (the minimal side distance 1 m. In the figure, d2 stands for the distance from the head of the vehicle to the centre of a circle; d1 stands for the distance from the bicycle to the centre of a circle). Therefore, the vehicle headway is d2 + d1.
Shown as the right one in Figure 3, when the traffic of bicycles is large enough and riders make use of vehicle lane in order to surpass the other bicycles, the bicycle is treated as the “leading-car” of the car-following model or lane-changing model, while the vehicle follows or changes lane. If following the bicycle, the speed of vehicle is fluctuated with the speed of bicycle (in the figure, d2 stands for the distance from the head of the vehicle to the tail of bicycle; d1 is considered as 0). Therefore, the vehicle headway is d2.
5. Driving Behavior Model Validation
5.1. Experiment Design
In order to verify the driving behavior model which is influenced by bicycles, the place which is chosen for experiment should have no special geographical complication, have fine weather, have no too heavy traffic, have sidewalks, and be convenient for filming. This condition is adapted to analyzing the influence of bicycles on vehicle, because the influence between the bicycle and vehicle is quite obvious while the influence of pedestrian is less. The information which is obtained at the nonrush hours is studied.
5.1.1. Experiment Design in Section
The east people road section between the east second road and the third one in Zhangdian district, Zibo city of China is chosen, shown as Figure 4. In microcosmic aspect, 1000 samples of “conflict” between vehicles and bicycles from west to east are observed. In macroscopic aspect, vehicle average speed, traffic volume, and lane occupancy are observed.
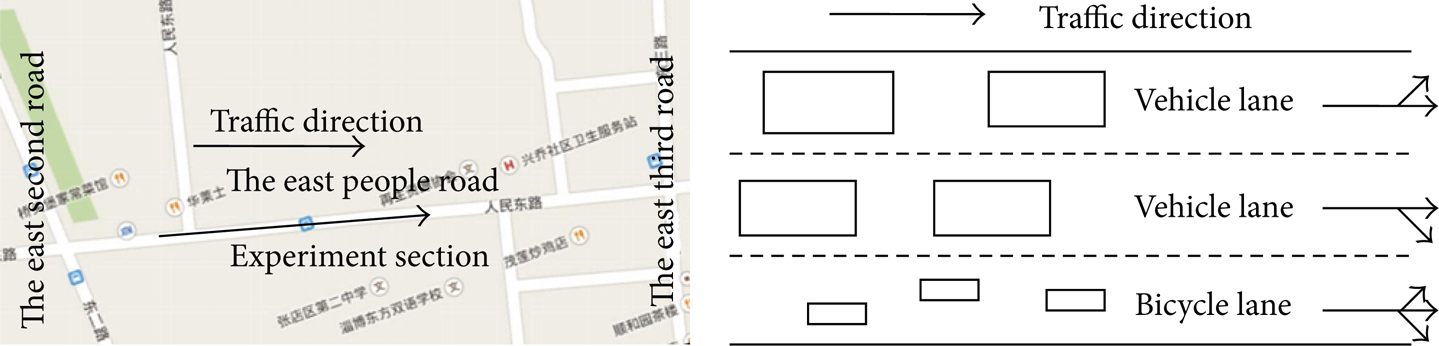
Road sketch with vehicles from west to east.
The experiment scheme is as follows: (1) microcosmic experiment: the GPS experiment systems are, respectively, installed to five taxis to measure point speed, and the wheel speed velometers are, respectively, installed to one hundred bicycles to measure point speed. The wide angle camera is installed on a big building of experiment section to screen the traffic in order to make sure of the conflict point and analyze the conflict. (2) Macroscopic experiment: vehicle's number and travel time are noted down to measure the vehicle average speed. The traffic volume and lane occupancy are measured by camera method.
The information will be obtained as follows: (1) microcosmic information: times of bicycle to traverse road at distance of L m in front of taxi and taxi to follow, times of bicycle to come into conflict round C1 at distance of L m in front of taxi and taxi to follow or change lane, and times of bicycles to make use of vehicle lane (can be considered as bicycle coming into conflict round C1 and observed as preceding one) at distance of L m in front of taxi and taxi to follow or change lane. (2) Macroscopic information includes vehicle average speed from west to east, unidirectional traffic, and lane occupancy.
5.1.2. Experiment Design in Intersection
The intersection of east people road and the east third road in Zhangdian district, Zibo city of China is chosen, shown as Figure 5. In microcosmic aspect, 1000 samples of “conflict” between straight-through vehicles and left-turn bicycles are observed. In macroscopic aspect, average delay of each entrance, the longest queue lengths of each lane, and average delay of each lane are observed.

Sketch of the intersection.
The experiment scheme is as follows. (1) Microcosmic experiment: the experiment vehicles and experiment instruments are the same as those in the experiments designed in section, shown as Figure 6. The routes of straight-through vehicle and left-turn bicycle to be observed are drawn with vivid color, in order to make sure of the place of conflict point and organize the circulatory experiments. (2) Macroscopic experiment: vehicle's number and travel time are noted down to measure the average delay of each entrance and the average delay of each lane. The longest queue length of each lane is measured by camera method.

Sketch of the straight-through vehicles and left-turn bicycles.
The information obtained is as follows: (1) microcosmic information: times the vehicle came into conflict round C2 while bicycle did not get across the conflict point and taxi to follow and times the vehicle came into conflict round C2 while bicycles have gotten across the conflict point and taxi not to follow. (2) Macroscopic information includes average delay of each entrance, the longest queue length of each lane, and average delay of each lane.
5.2. Simulation and Result Analysis
5.2.1. Program Flow
Figures 7 and 8 are separately the submodule program flow figures about the influence of bicycle on driver in driving behavior simulation module of road section and intersection.

Simulation program for road section.

Simulation program for intersection.
5.2.2. Result Analysis
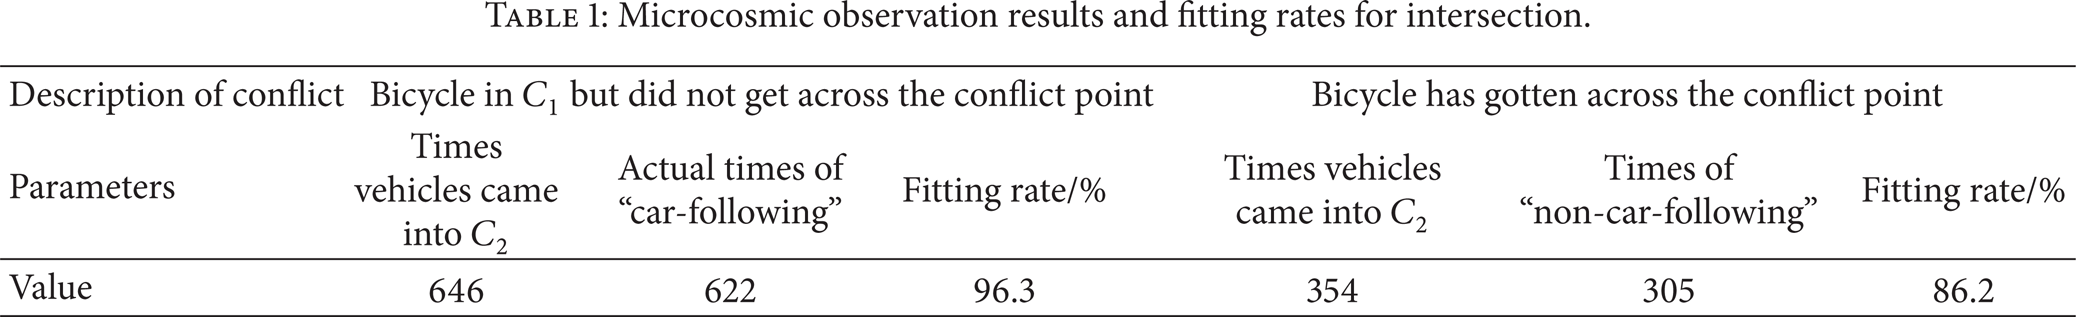
The observation and simulation results are shown in Tables 1, 2, 3, and 4.
Microcosmic observation results and fitting rates for intersection.
Microcosmic observation results and fitting rates for road section.

Macroscopical observation results and simulation results for road section.

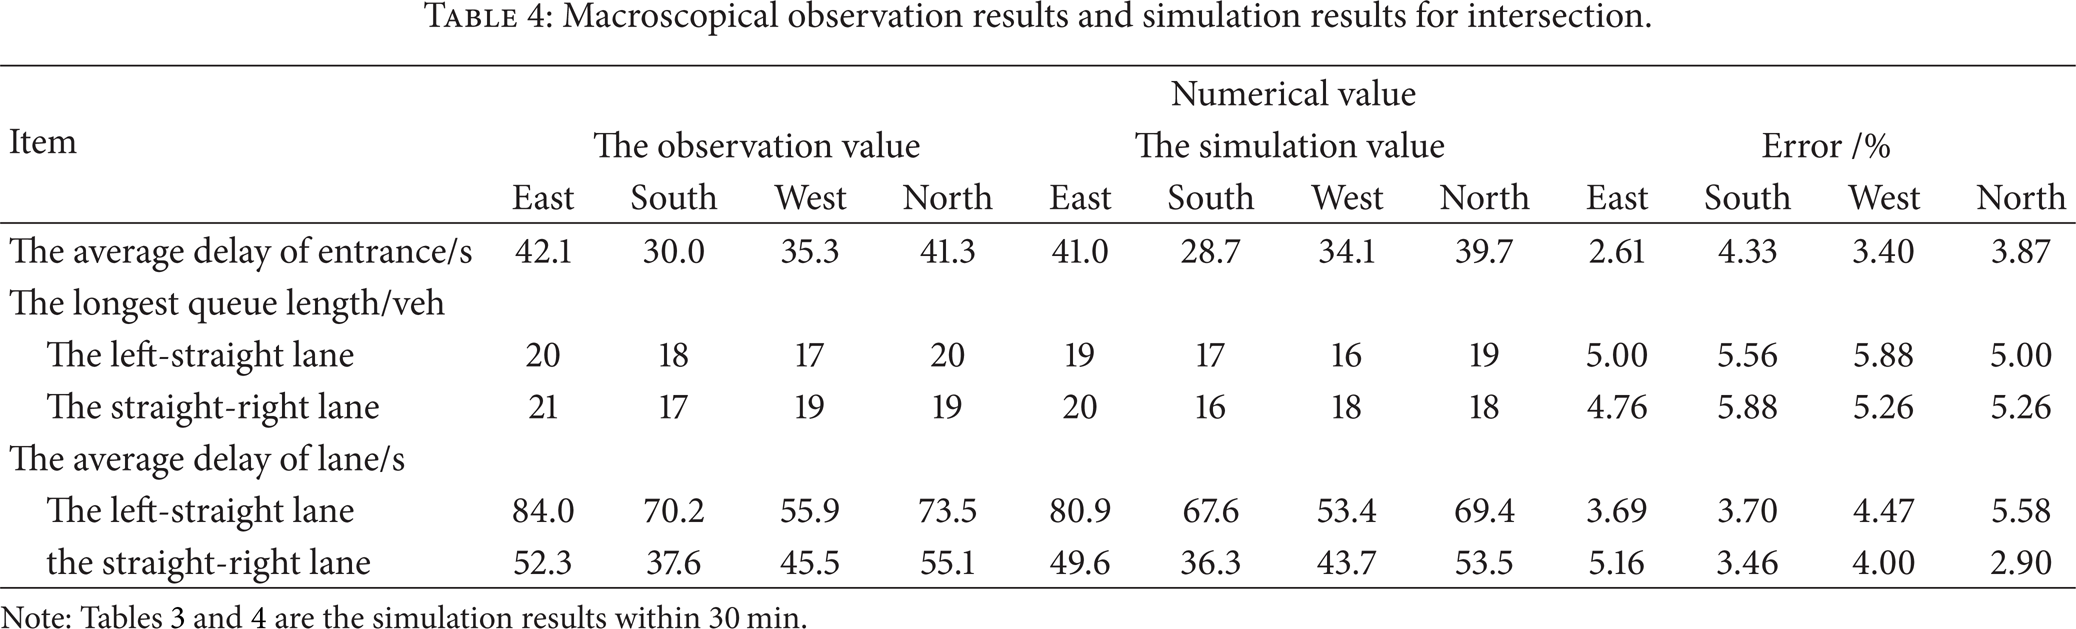
Macroscopical observation results and simulation results for intersection.
The influence of bicycle on driving behavior is studied by the “conflict point method”; the simulation result and the field data are consistent basically. It is feasible to study the “conflict” as a special car-following or lane-changing. The research of driving behavior with the “conflict point method” can accord with actual condition well, and the simulation accuracy is well. This method is applied to the low traffic. When the traffic is heavy and the conflicts exist everywhere, further study is needed.
It can be discovered from the validation process that some taxis have been slowed down before coming into the conflict round. Because of the complexity of intersection, even if the bicycle has gotten across the conflict point, the taxi may still be slowed down. This is because the taxis and bicycles are influenced by many factors and some factors such as the mutual influence distance is still needed to be further studied.
6. Driver Decision-Making Process
6.1. Decision-Making Process
Driver's decision-making process in complicated mixed traffic environments is in fact the driver's analysis course and the corresponding results on the outside multisource information, such as the external environment information, vehicle and driver's own information (including speed, driver's temperamental characteristics, driving characteristic, and driving task), and the compound spatial information inside the vehicle. The decision-making process is quite complex and is divided into four stages: perception stage, cognition stage, judgment stage, and execution stage. The process can be described roughly as follows: during driving, the driver obtains multisource information about person, vehicle, road, and environment through receptor (vision, sense of hearing, sense of touch mainly, and so on) from the nature or traffic environment outside the vehicle, the complex information spaces inside the vehicle, and transmits these information to the information processing center, central nervous system. So the information has been transmitted, selected, extracted, fused, and saved. Then it was compared with the established driving pattern in the memory, decision about the behavior pattern, and vehicle operation pattern is made after many times of thinking, judgment, and evaluation and eventually transmitted to the effectors (motion organs such as the hand and the foot), and then automobile starts to be operated [24–30]. Obviously, reaction cannot be sent out exactly by the organism while receiving the stimulation information, for the driver will pass through a short period of reaction time, during which there also will be other stimulation information appearing. So the multisource information should be fused by the driver, and the mistake and redundant information need to be modified and filtrated, and so forth.
Reaction time refers to the time from appearance of stimulation to reaction of organisms. Reaction time relates to driving proficiency and driving fatigue [55]. Decision-making reaction time in this paper is the process from appearance of stimulation to decision-making of the driver, that is, the process of perception, cognition, and judgment.
The observation of driver to environment is real-time and continuous. It is known from the biology that human's reaction capacity is different. Generally, the decision-making reaction time is about 0.1 s [68, 69]. The average reaction time of the foot is 0.9996 s, and the hand is 0.9589 s [70]. The execution reaction time takes 1 s generally.
In the former research on driving behavior simulation, the clocked scan step size mostly is taken as the execution reaction time as 1 s, and the execution is given straight at the end of the 1 s, and the vehicle running distance for 1 s is considered for security purpose at best. After decreasing the simulation step size to less than 0.1 s, it is found more clearly that the driver's decision is the result of the information fusion process, and, furthermore, the decision made by the driver at the end of 1 s is not the direct fusion of stimulation information during the corresponding 1 s due to the decision-making reaction time considered. Obviously, taking the length of stimulation step as 1 s is under the condition that the driver's certain slighter behavior information is not considered. If the length of stimulation step is reduced to 0.1 s, the driving behavior can be described more meticulously and actually according to the research on decision-making reaction time, and it looks like that there is a special necessity for the simulation of the complicated mixed traffic environments.
6.2. Driver Decision-Making Process Based on Precision Double Clocked Scan
For the complexity of the environment, multiple stimulation information may be received and fused by the driver in a short time during the driving process. The double clock scanning is used in this paper: first, the simulation step size is 0.1 s, and the influencing information is scanned. Second, the simulation step size is 1 s, and the driver's decision-making behavior is scanned. The simulation starts from 0 s and carries on the synchronous scanning.
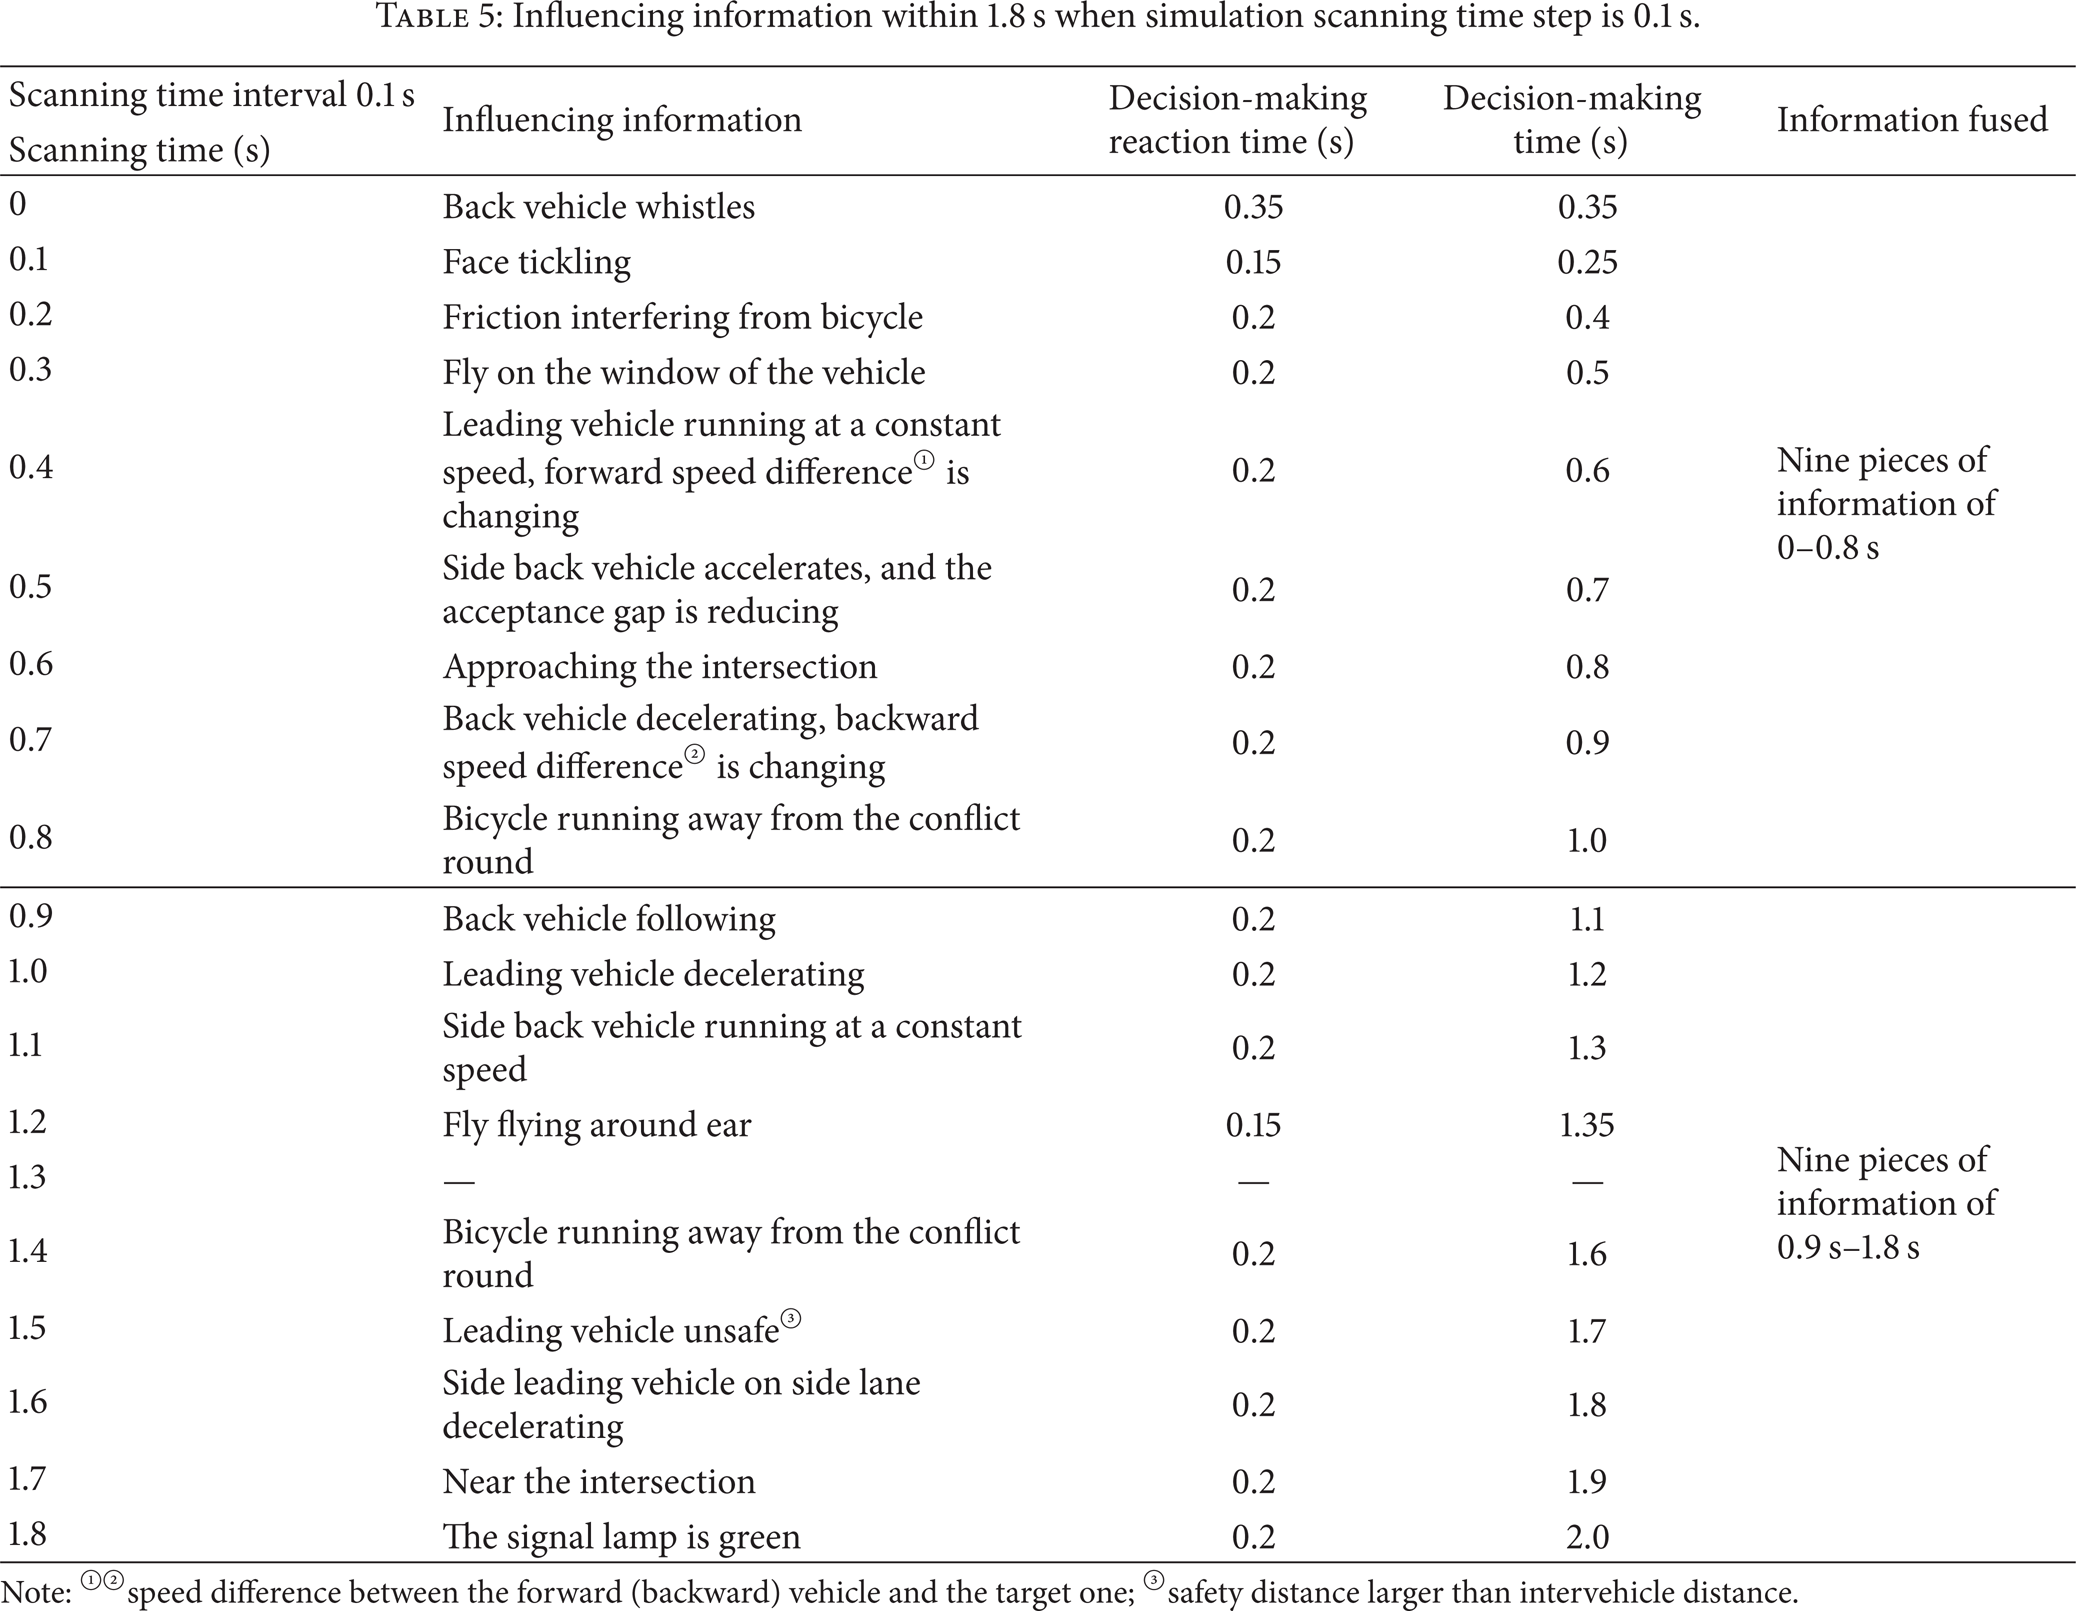
Generally, the vision reaction time is 0.15~0.2 s, the sense of hearing reaction time is 0.12~0.16 s, and the sense of touch reaction time is 0.11~0.16 s [71–75]. They are taken as 0.2 s, 0.15 s, and 0.15 s separately in the paper for convenient study. As the simulation step size is 0.1 s, influencing information and decision-making reaction time received by the driver within 1.8 s are shown in Table 5 as an example. The “influencing information” is the information scanned and filtered for every 0.1 s, without those not affecting decision-making (analysis of the scanning information, removing the information on which the target vehicle had no change or changed but outside the influencing range).
Influencing information within 1.8 s when simulation scanning time step is 0.1 s.
Note: ①②speed difference between the forward (backward) vehicle and the target one;
safety distance larger than intervehicle distance.
It is concretely described in Table 5 that, at 0 s, the back-vehicle is whistling, and the driver must look at the reflector first after hearing the whistle and then make decision. The reaction time of auditory is 0.15 s, the reaction time of vision is 0.2 s, and altogether it is 0.35 s, so the decision-making time is 0.35 s; when it is 0.1 s, the driver wants to scratch an itch, and the tactile reaction time is 0.15 s, and the decision-making time is 0.25 s; at 0.2 s, the driver finds the bicycle running in the conflict circle (when bicycle and vehicle are conflicted, the round is drawn with imaginary conflict point as the center of round and interactional distance as the radius), and then they produce friction disturbance, and the vision reaction time is 0.2 s, the decision-making time is 0.4 s; at 0.3 s, there is a fly on the window and the vision reaction time is 0.2 s, and the decision-making time is 0.5 s; at 0.8 s, the driver finds the bicycle running away from the conflict round, and the influence reduces relatively, vision reaction time is 0.2 s, and the decision-making time is 1.0 s; at 0.9 s and 1.0 s, decision-making time of influencing information is 1.1 s and 1.2 s, respectively. Obviously, the decision-making time of influencing information in 0.9 s and 1.0 s is outside 1.0 s when the double clock scanning is carried on. Therefore, they cannot be included when carrying on information fusion. The information between 0 s and 0.8 s is fused at the end of 1 s. The influencing information on decision-making time at 2.0 s is between 0.9 s and 1.8 s and to be fused in next scanning interval. Obviously, the problem cannot be solved as the simulation step size is 1 s.
7. Decision Optimization Model
Let D = {d1, d2, …, d n } be n candidate decisions of driving decision system and U = {u1, u2, …, u m }m influencing factors of decision-making. The essence of driver behavior decision system and fuzzy optimization [76] is determining the relative subordinate degree vector of the decision; the decision with the largest relative subordinate degree is the optimum decision-making about the driver information fusion [77, 78].
7.1. Qualitative Sequencing of Each Decision
The n candidate decisions are made paired contrast about those influencing factors u i (i = 1,2, …, m) by the decision-maker, and then the candidate decision superiority duality contrast matrix E i (i = 1,2, …, m) is obtained:
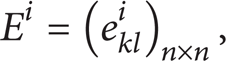
where e kl i is the qualitative sequencing scale of the decision-maker (for influencing factors u i ) contrasting the superiorities of candidate decision d k and d l : if d k is more superior to d l , take e kl i = 1; if d l is more superior to d k , take e kl i = 0; if d k is as well as d l , take e kl i = e lk i = 0.5. If the superiority duality contrast matrix meets
if e jk i > e jl i , then e kl i = 0,
if e jk i < e jl i , then e kl i = 1,
if e jk i = e jt i = 0.5, then e kl i = 0.5,
if e jk i = e jt i = 0 or e jk i = e jt i = 1, then e kl i can take 1, 0.5, or 0.
Then
If
7.2. Determination of Relative Subordinate Degree of Candidate Decisions
The corresponding relationship between mood operator and quantitative scale is built according to Chinese language habit on the basis of superiority qualitative sequencing of each candidate decision (Table 6), and the relative subordinate degree of candidate decision (for influencing factor u i ) can be searched out from Table 6:

Relative subordinate degree of mood operator and quantitative scale.

Relative subordinate degree matrix

7.3. Determination of the Weights of Influencing Factors
Similarly, m influencing factors are compared by duality contrast according to importance, and then the importance sequencing consistency scale matrix is obtained. As the rows can be arranged in the order of the sum size of each row, the important qualitative sequencing of influencing factors is obtained [79]. On this basis, also according to the relative relationship between mood operator and quantitative scale shown in Table 6, the relative subordinate degree vector of the importance of driver's influencing factors can be found. The weight vector is obtained after normalization:

7.4. Fuzzy Optimization of Candidate Decisions
For the relative subordinate degree matrix and the weight vector of influencing factors determined, the relative subordinate degree vector v = (v1, v2, …, v n ) of the candidate decision set D about m influencing factors can be obtained by fuzzy optimization model [80]. Consider
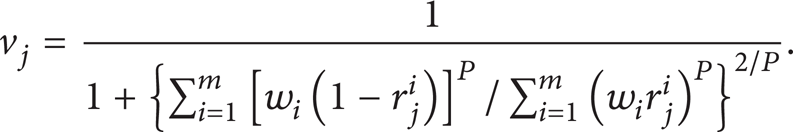
The superiority sequencing of each candidate decision based on the size of each component of the vector. The largest component is the optimum decisions; the second largest one is the suboptimal, and so forth.
8. Experiment Designing for the Decision Optimization Model
Camera method is used to test the effectiveness of driving decision-making optimization model based on fuzzy optimization. Camera method can continuously display a process in the form of pictures, on which the surveyors can give intuitive judgment.
Experimental conditions are as follows. (1) Equipment: four digital cameras with photography function, a tripod, and measuring tape (measuring the distance between the markers). (2) Weather conditions are clear and no high wind days are chosen to avoid the effects on drivers or bicycle riders and their psychology for abnormal weather such as rain, snow, hail, and gale. (3) Place: choose the typical section with big buildings but no special geography factors and convenient for camera shooting. (4) Markers: before shooting, investigate the place in advance. After determining the place for cameras, choose some markers and measure some required distance for data analysis later.
Experimental design: one of the four cameras is posted on the big building of the roadside, one is put in the vehicle shooting the driver and comparing to the exterior through vehicle window, and another two are used separately to shoot the action of driver's hands and feet as steering, braking, and so forth.
9. Model Calibration and Verification for Decision Optimization
9.1. Model Calibration
Video data is sorted and extracted after experiments, and some data in continuous 128 s is chosen. The relative subordinate degree matrix and weight vectors are obtained through asking the driver about influencing factors and their corresponding importance in pace with the images every 0.1 s. By this way the quantitative scale of duality contrast given by drivers will accord with the practical traffic condition as far as possible, and the simulation results will be more real. But, different quantitative scales are given by different drivers with different age, sex, character, experiences, and so forth, and further study is needed. According to the video data, the times of accelerated following, stable following, decelerated following, lane-changing, and free driving of the driver are decided. The vehicle plate number and travel time should be recorded. And the average speed of driving vehicle is measured from west to east with plate number method. Traffic volume of single direction and lane occupancy is available according to video data.
The experiment place is some mixed traffic road section with two-vehicle lane for single direction and bicycle lane without isolation strip between them in Zhang Zhou road, Zhang Dian district, Zibo city of China.
The driver's decision scheme is as in the following:

Decision-making set D = {d1, d2, d3, d4, d5} = [accelerated following, stable following, decelerated following, lane-changing, free driving] is formed with driver's decision-making scheme. The influencing factors set U = {u1, u2, …, u9} = [back-vehicle whistling, itches on face, interfering friction produced by bicycle, a flying on the vehicle window, leading-vehicle running at a constant speed, backward vehicle accelerating on side lane, approaching the intersection, back-vehicle decelerating, bicycle running away from the conflict round] have nine pieces stimulation information in 0 s~0.8 s in the first scanning interval, and the decision-making modeling process is as in the following.
Step 1. Superiority qualitative sequencing of five candidate decisions about the back-vehicle whistling factors (u1) is determined.
As for the back-vehicle whistling factors (u1), five candidate decisions' superiority duality contrast matrix E1 is given by decision-maker according to the judgment of drivers:

Step 2. Determining relative subordinate degree of five candidate decisions (about the whistle factors (u1) of back-vehicle).
According to the drivers' experience asked, candidate decision d1 takes the first place in superiority sequencing, which is superior to d4 between “slightly” and “appreciably,” superior to d5 between “appreciably” and “relatively,” superior to d2 between “relatively” and “obviously,” and superior to d3 between “significantly” and “quite.” According to Table 6

Repeating the above steps, superiority duality contrast matrix and relative subordinate degree vector of five schemes are obtained by the other eight influencing factors:

The relative subordinate degree matrix

Step 3. Determination of the optimal candidate decision.
Similarly, duality contrast matrix and weight vector of nine influencing factors are obtained:
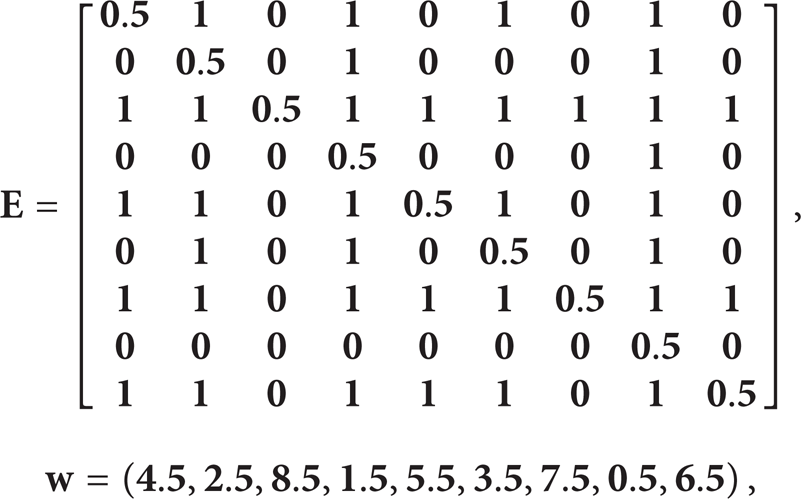
normalized as

Relevant data of relative subordinate degree matrix
Superiority sequencing of five candidate decisions is gained: d3 > d2 > d4 > d5 > d1. Therefore, the driver's optimum decision in the example is the decelerated following. Similarly, the optimum decision in the following scanning interval within 1 s is decelerated following (where the influencing information within 0.9 s–1.8 s is fused).
9.2. Model Verification
9.2.1. Program Flow Chart
In simulation process, the events such as vehicles, bicycles, flies, and itches on face are generated according to the following method: for the randomness of the traffic systems, the stochastic characteristic of the vehicle flow should be considered when generating it. The speed submits to normal distribution [81, 82] generally, and the shifted negative exponential model can well describe the headway distribution of noncrowded traffic flow [83, 84]. The bicycle enters the road section of simulation with random fashion, and the arrival quantities submit to negative binomial distribution [85]. Flies and itches on face are generated in random as small probability events. Random number is produced with identical linear method and recursive equation to obtain a series of random integers [84, 86].
When the simulation step is 0.1 s and 1 s separately, the driver's decision-making optimization module program flow chart of double clocked scan is shown as in Figure 9.

Program flow chart of driving decision-making optimization module.
9.2.2. Analysis of Results
With driving decision-making optimization model, the language description of the driving decision-making influencing factors is optimized in Table 7. The simulation results are contrasted with practical driving decisions and the efficiency of the model is validated.
Language description of the driving decision-making influencing factors in simulation.
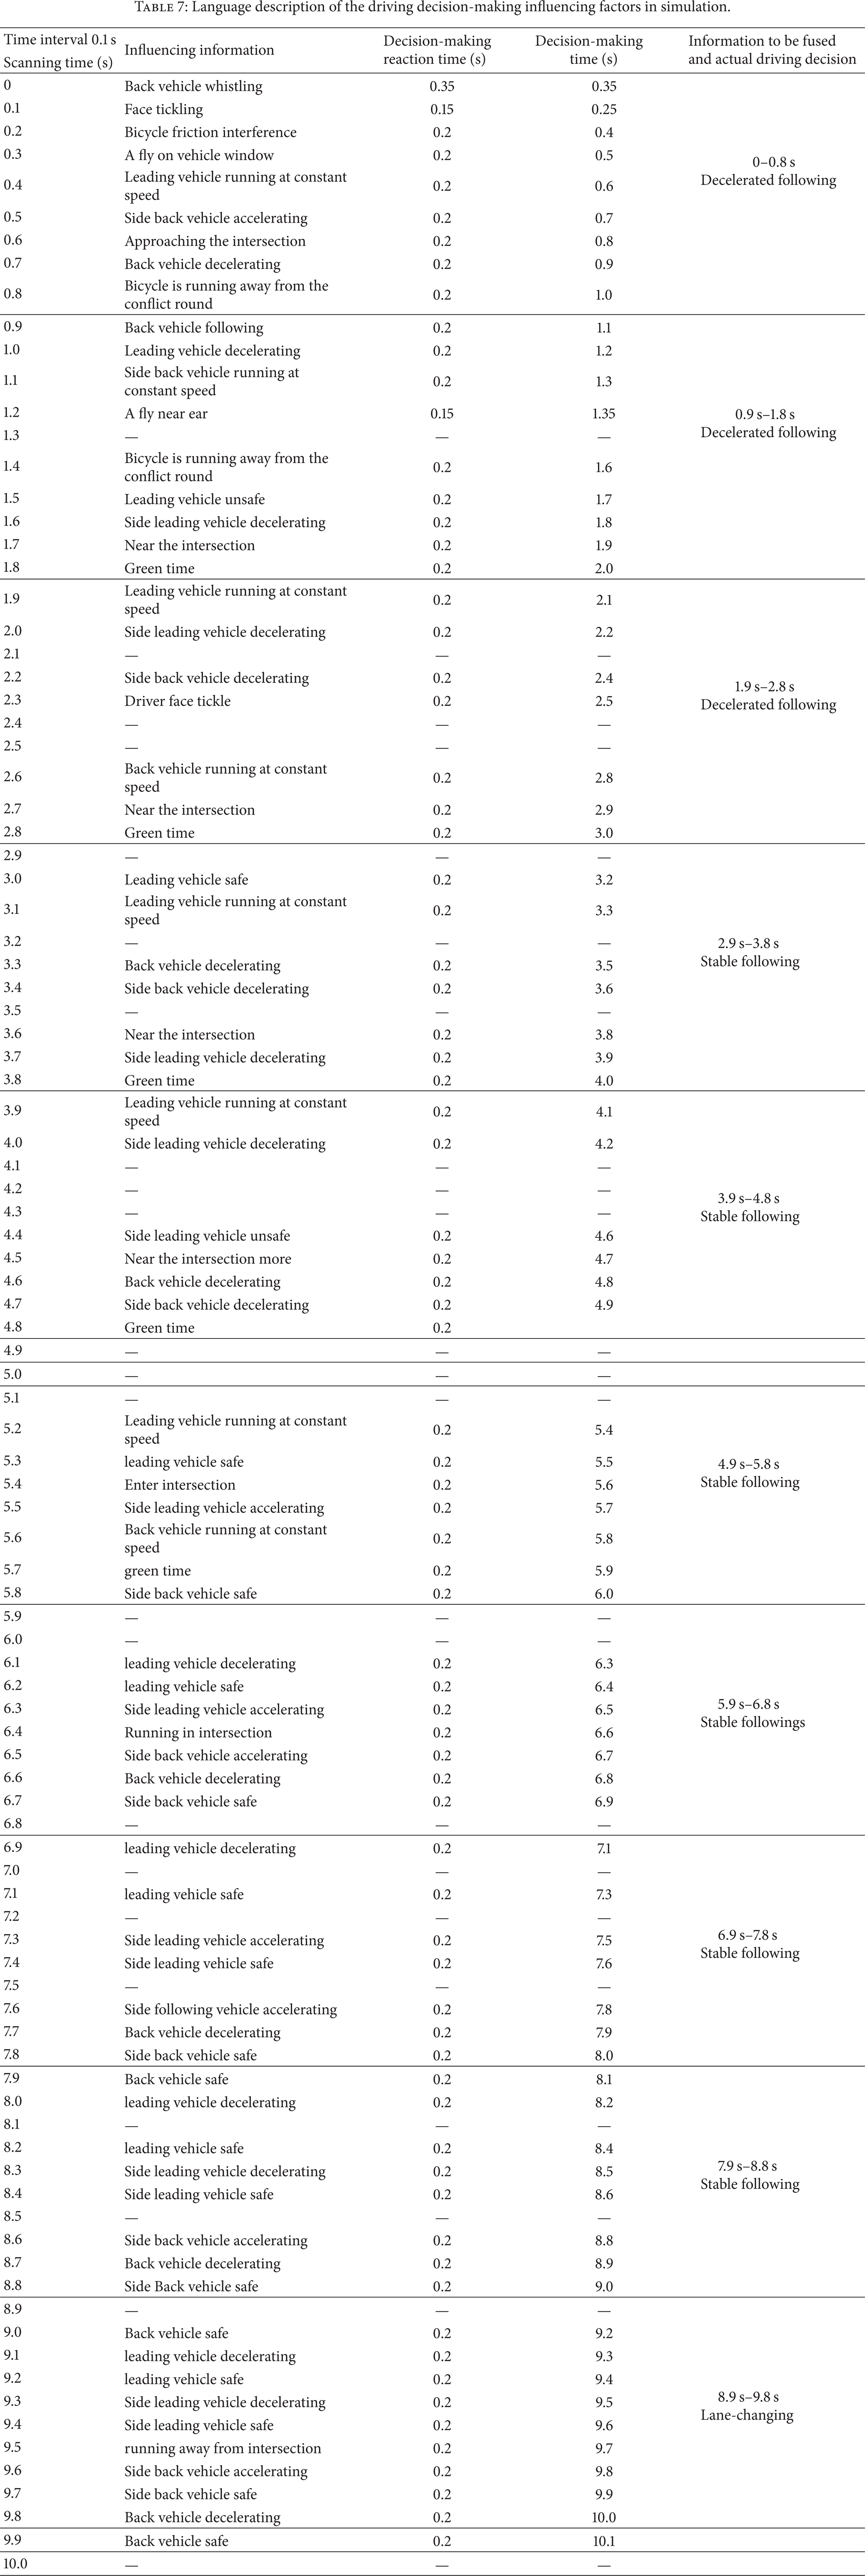
With driving decision-making optimization model, the simulation results are [decelerated following, decelerated following, decelerated following, stable following, stable following, stable following, stable following, stable following, stable following, lane-changing], the results are identical with the practical driving decisions, and the optimal selection process is efficient.
In order to verify that the simulation results under scanning step 0.1 s are more exact than that under 1 s, experiments with different scanning method are carried out separately for 128 s, and the comparisons of the observed results and the different simulation results are shown in Tables 8 and 9.
Observed results of driving behavior and simulated ones in 128 s.

Observed results of the road section and the simulation results.

From the simulation results, the error under the scanning step 0.1 s is smaller. But, there exist certain errors between the observation and the simulation results of the driver decisions. The reason is that the distance obtained from video image exist errors, which leads to deviation of the weight of influencing factors given by drivers. The simulation results of the road section vehicles are basically the same as the actual observed ones, which indicate that the way that the simulation step reduced to 0.1 s can describe the driver's behavior better. The driving decision-making optimization model based on fuzzy optimization is feasible.
10. Conclusions
The “conflict” between vehicles and bicycles in mixed traffic is introduced, and the “conflict point method” is studied and used to analyze the influence of bicycle on driving behavior in this paper. At the same time, “conflict” is studied as a special car-following or lane-changing. Thereby, modeling and simulation of driving behavior in mix-traffic environment is carried out. The simulation flow charts are given and the models are validated from the microscopic and macroscopic perspective. The theory base can be provided for further study of the cooperative driving behavior under the stimulation of multiresource information. Moreover, for simulating the complicated mixed traffic in China, double clocked scan is used in this paper, and the simulation step length is reduced to 0.1 s. Considering the lag caused by driver's decision-making reaction time, the information which needs to be fused in the scanning time 1 s is analyzed in a more exquisite way and the precision of the simulation is improved with more accurate description of driver's response. Driving decision-making model based on fuzzy nonstructural system optimization theory is introduced, with which the knowledge and experience of the decision-maker are applied to the quantification process of the influencing factors. The simulation flow chart is given in the paper, and the models are verified to indicate the effectiveness and feasibility.
In this paper, what is studied only and primarily is the influence of bicycles on driving behavior and the driver decision-making optimization model in mixed traffic when the simulation step reduced to 0.1 s, and many problems are still left and need to be researched further. For examples such as driving behavior modeling based on conflict point method in mixed traffic environment, the vehicles and bicycles are affected by many factors, and the mutual influence distances are required to be deeply studied. The car-following model between vehicles and bicycles is quite different from that between both vehicles. In the experiment, only the influence between taxis and bicycles is considered, and the influence between other types of vehicles and bicycles need to be further considered. Besides, for the different grips of the different riders and also the invalid brake for long time use, the braking force is different and so the deceleration is different. The conflict point is generally considered as the point of intersection of two perfect tracks. But, in fact, the conflict point between vehicles and bicycles is sometimes within one region and is not a complete certain point, because the bicycle is unstable and the track is unfixed. The division of the block interference and friction one is different under different situations in road section. For instance, on the smooth road, the swing angle of bicycle is frequently within the range of 6° [87], and when in this range, it is regarded as the friction interference, otherwise, as block interference. In addition, problems as the definition and the criterion for judgment of bicycle group, the safety distance and minimal side distance between vehicle and bicycle, the swing range of bicycle and the speed difference of different sex, physical force, age, and character of riders need to be deeply studied. With respect to driving decision-making optimization model, relative subordinate degree optimization matrix and weight vectors are obtained through information sorting and extraction of the video data, and each influencing factor as well as its importance perceived by the driver is enquired and obtained before the image every 0.1 s. The quantitative scale of duality contrast given by drivers is more coincident with practical traffic situation and the simulation results are more realistic. However, different quantitative scales are given by different drivers for different age, sex, character, experiences, and so forth, which needs to be studied further. Besides the influence of some psychological factors, driving experience, and age, the external random factors should be considered simultaneously. To ensure driving operation safety, drivers must adapt to the fast changing influencing factors under high vehicle speed conditions and variable complex road situations. When the simulation step length is dropped to 0.1 s, the computer memory and storage must be enough and need to be adjusted in real time and the computer management strategy should be studied further.
Conflict of Interests
The authors declare that there is no conflict of interests regarding the publication of this paper.
Footnotes
Acknowledgments
This study was supported by the National Natural Science Foundation of China (61074140), the Natural Science Foundation of Shandong Province (ZR2010FM007 and ZR2011EEM034), the Key Disciplines (Lab) Excellent Skeleton Teachers International Exchange Visitor Program of Shandong Province, and the Young Teacher Development Support Project of Shandong University of Technology.