
Abstract
The nonexistence of an end-to-end path poses great challenges in directly adapting the traditional routing algorithms for ad hoc or mobile ad hoc networks (MANETs) to delay tolerant networks (DTNs). In this paper, an adaptive routing protocol that makes use of both self-aware and destination-aware utility metrics to evaluate the potential throughput between every pair of nodes is proposed. We theoretically analyze the nodes’ spraying process and discover the relationship between the initial number of copies and the latency of the message distribution process, by which we can further control the expected latency under a certain level. Compared with Epidemic, Spray And Wait Spray, And Focus and Encounter-based routing, our proposed algorithm is the only one that achieves comparable performance under both Helsinki City Scenario and Cambridge-iMote Scenario.
1. Introduction
Delay/disruption tolerant networks are networks of self-organizing wireless nodes, where end-to-end connectivity is intermittent [1]. The communication model of the Internet is based on some inherent networking assumptions, for example, the existence of a continuous end-to-end path between two nodes, the relatively short round-trip delays, the symmetric data rates, and the low error rates [2]. However, in DTNs these assumptions usually fail, which leads to the fact that the TCP/IP protocol does not work [3]. Hence, many application protocols designed for the Internet architecture cannot operate well in the DTN scenarios such as InterPlanetary interNet (IPN) [4]. In [5], Khabbaz et al. pointed out that we need a new kind of network model when modeling existing and recently emerging wireless networks, especially those deployed in extreme environments (e.g., battlefields, volcanic regions, deep oceans, deep space, developing regions, etc.) where they suffer challenging conditions (e.g., military wars and conflicts, terrorist attacks, earthquakes, volcanic eruptions, floods, storms, hurricanes, severe electromagnetic interferences, congested usage, etc.) resulting in excessive delays, severe bandwidth restrictions, remarkable node mobility, frequent power outages, and recurring communication obstructions. Based on the observation that quite a few terrestrial networks exhibit delay-tolerant properties, albeit different nature: from sparse mobile ad hoc to sensor networks to mobile Internet access, it is found that delay tolerance exists as an important element to describe communication behavior and to design protocols suitable for operation in the corresponding challenged networking environment [6].
Most research achievements on DTNs focus on the design of routing protocols. Since there are some common characteristics between most terrestrial DTNs and mobile ad hoc networks (MANETs), for example, nodes mobility and “store-carry-forward” paradigm, many researches work on routing in DTNs aiming to solve the newly arisen difficulties in MANETs that address the “delay-tolerant” property. Epidemic protocol [7] makes use of naive replication strategy letting each node replicate the message to all encountered nodes, so as to try to achieve the maximum message delivery ratio. However, the buffer size and energy of nodes are limited thus constraining its practical performance. Spray And Wait [8] takes the cost into consideration and confined the maximum number of copies and hop counts of each message. On the foundations of these two classic routing algorithms, many multicopy routing schemes focusing on evaluating contacts opportunities among nodes have been proposed [9–13]. All these research achievements are devoted to efficient utilizing of the possible contacts between pair of nodes, thus making messages delivered through multiple hops between nodes in a “store-carry-forward” paradigm. All of these algorithms essentially utilize various utility metrics to replicate or to forward the message in a gradient way to the destination. In DTNs, the utility metrics can be categorized as follows:
destination-aware utility, which evaluates how well-suited a device is for routing towards a specific destination device,
self-aware utility, which evaluates the applicability of a device as forwarder in general, irrespective of the message's destination,
unaware utility, which is a per-message utility of (controlled) flooding, irrespective of any node.
However, as far as our information goes, only [14] takes both self-aware and destination-aware factors into consideration. We denote self-aware utility as the “general utility” and destination-aware utility as the “specific utility”, respectively. Starting from this point, we design a routing protocol capturing both generic and specific utilities (GSUs) of nodes. Based on this principle, we implement an asymmetric message replicas distribution approach “GSU-Spray” to boost the messages dissemination towards their destinations. The primary motivation is to replicate more copies to candidate nodes as quickly as possible. Besides, since network resources in DTNs are highly constrained, we take the buffer resource issues into consideration. Furthermore, the number of replicas for each message is adjusted between nodes in each transmission by referring to the dynamically updated utility metrics. From this perspective, GSU-Spray has the ability to adaptively cater to the various DTN environments. Our contributions are listed as follows.
General and Specific Utility Metrics for Nodes and Messages. We propose general and specific utilities that take the node buffer issue into consideration. On one hand, we utilize each node's contact frequency to all other nodes over a time period to design the general utility. On the other hand, for which a longer connection duration between two nodes usually indicates a higher message transmission throughput, we use both contact frequency and contact duration time between each pair of nodes to define the specific utility which evaluates each node's fitness of being a relay node to the destination node.
Utility-Based Adaptive Asymmetrical Spray Approach. We design a utility-based spray routing algorithm. We asymmetrically spray the copies of each message by referring to the utility metric. This method dynamically reallocates the network resource for each message, thus adaptively balancing the number of copies between each pair of nodes according to the utility metric.
Combining Specific Utility and Delegation Scheme to Implement Forwarding. In delegation forwarding (DF) [15], each message updates a threshold value with the maximum value of all encountered node(s)’ utility metrics for the destination. Different from the traditional controlled-flooding strategies, DF only replicates the message if the encountered node has a better utility value than the threshold value cached in this message. This approach is employed in our routing algorithm by letting each message record the maximum specific utility value encountered before, thus lowering the total costs of routing.
Adjustable Sensitivity of the Contact Duration Time. Rather than simply accumulating every contact duration time for each node, we design a function that integrates an exponential function
Using Markov Chain to Guarantee a Desirable Latency. The distribution process for a certain message can be modeled as a discrete Markov Chain, where each state is denoted by the number of message replicas. We theoretically analyze the replication process of spraying stage in GSU-Spray by building a Markov Chain. Then we discover the relationship between the initial number of copies of a message and the desired latency. By dynamically adjusting the preassigned number of copies of each message, we can keep the expected latency under a certain level.
The paper is organized as follows. Section 2 introduces the network model and describes the routing problem. In Section 3 we put forward details of routing design. Section 4 analyses the spraying process by using a Markov Chain Model. In Section 5 we show the simulation results. In Section 6 we report on previous works in the field of DTNs. Section 7 eventually concludes this paper.
2. Preliminary
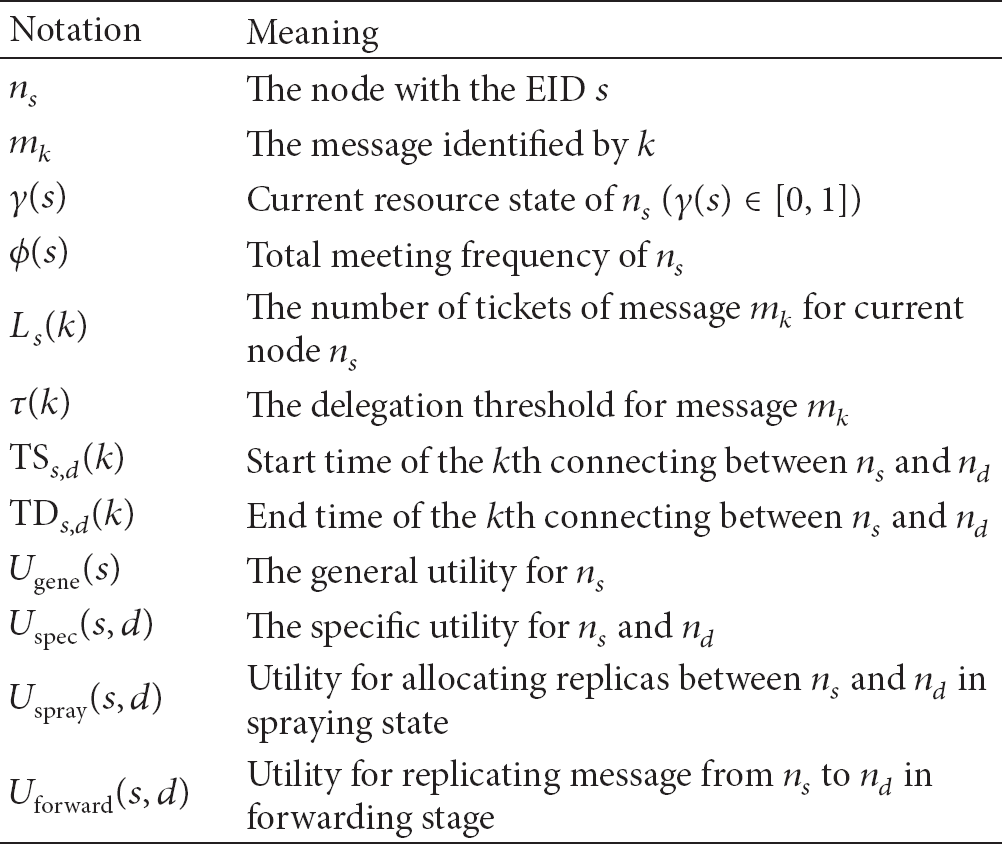
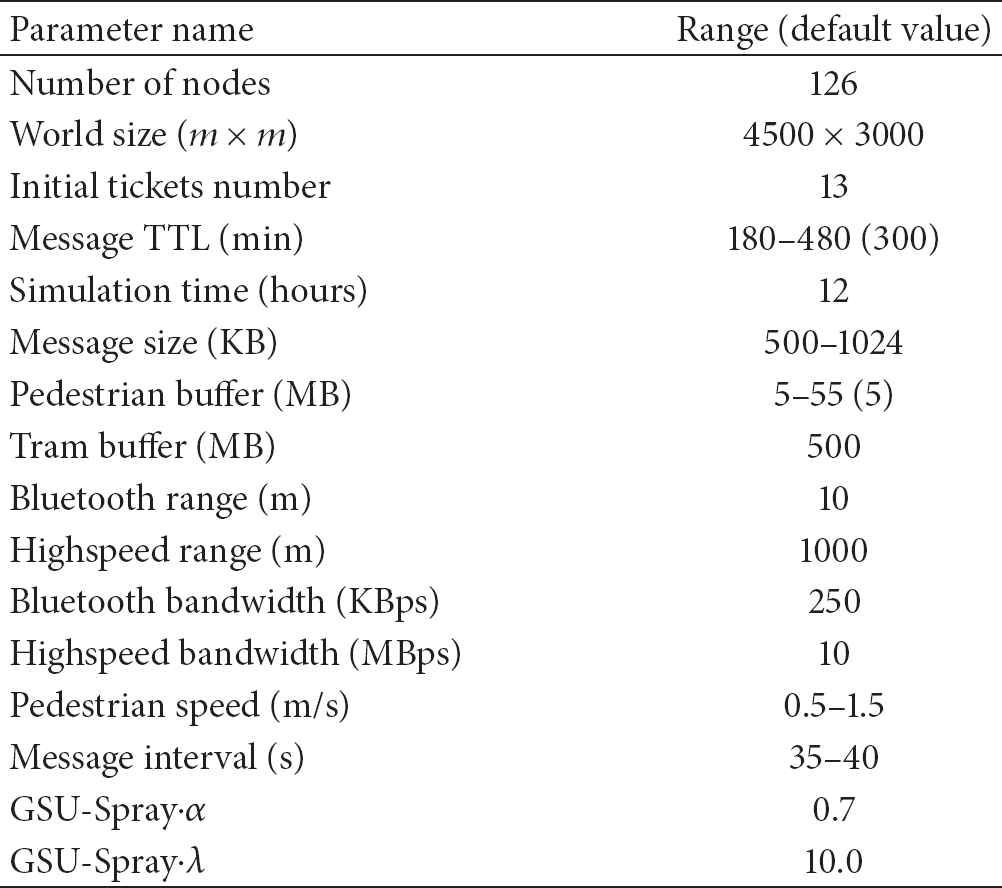
The notations relative to our network model are listed in Table 1. To illustrate the general picture of our routing in the network, we use the following model. As stated in the Introduction, we focus on mobile opportunistic networking scenarios where nodes communicate using the DTN bundle protocol [16]. All nodes are willing to cooperate and to assist other nodes in forwarding bundles to their destinations. Moreover, we assume that node
Mathematical notations for network model.
As illustrated in Figure 1, the source Spray And Wait routing shows up a little stiffly, since it only makes use of the contacts between the source node and others to distribute message copies. Binary Spray And Wait is not the optimal choice either, since the source node always equally sprays the message copies with unawareness of each node's capability. Though [8] proves that binary Spray And Wait is optimal when node movement is independent identically distributed (IID), in most cases we do not have such a strict IID movement that the binary distribution method fails to get the optimal choice, as shown in Figure 1.
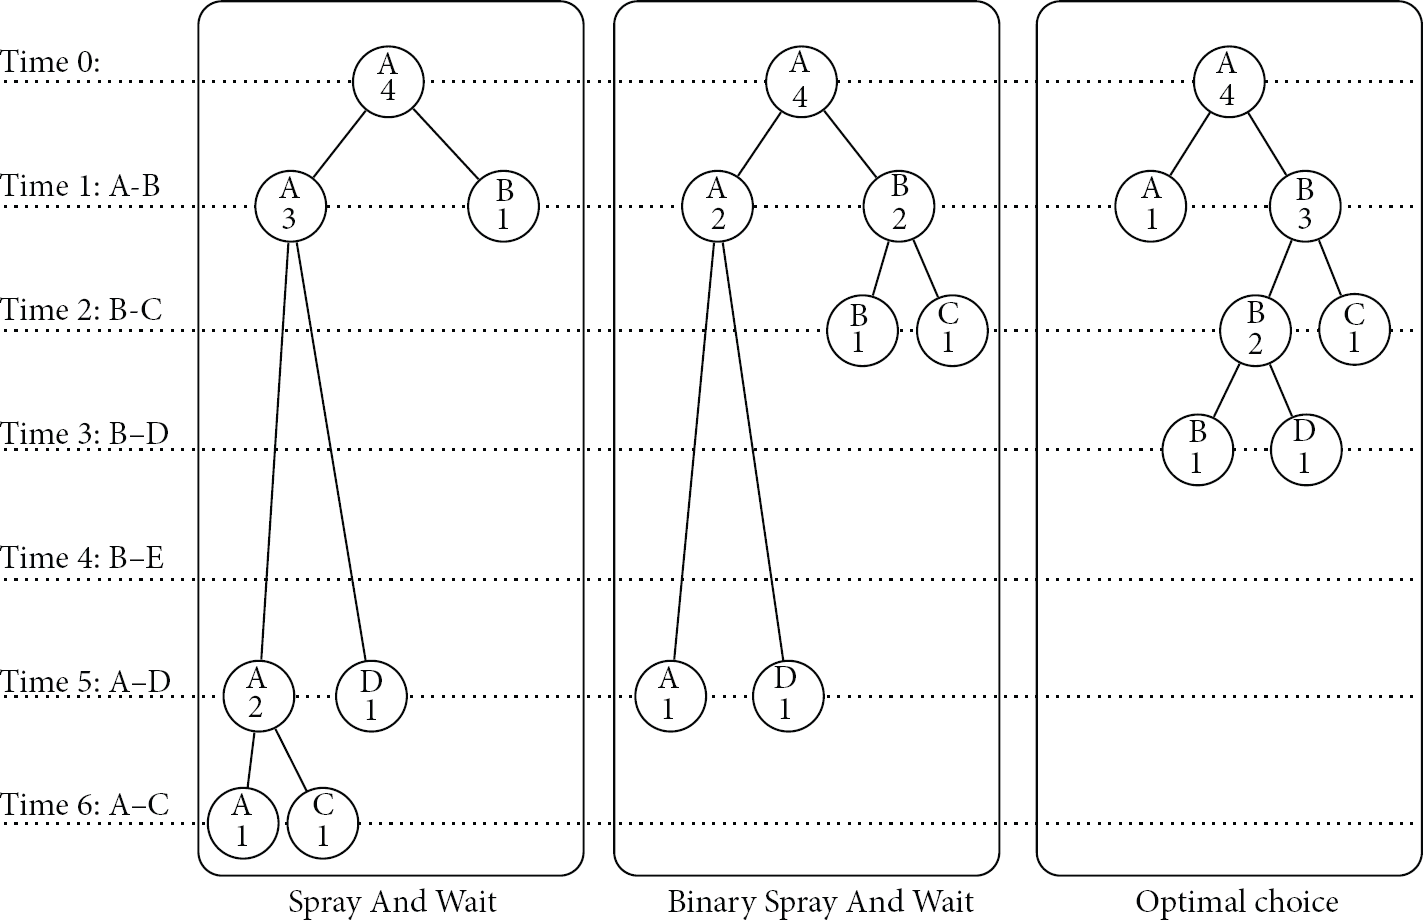
Message duplication tree formed by spray operations.
In this paper, we propose an adaptive routing scheme to satisfy the various DTNs. Based on the Spray And Wait routing, we adaptively adjust the number of tickets between each pair of nodes during the whole spraying process, so as to efficiently allocate network resources. In addition, since spray-based routing algorithms can only generate limited number of message copies, in forwarding stage, we employ delegation forwarding scheme to further replicate messages to other nodes in order to keep sufficient copies, thus achieving the purpose of improving the delivery performance.
3. Routing Details
In DTN routing, the utility of a node is a measure of its contribution to improve a routing metric such as throughput or delay [17]. Let us briefly review the objectives of DTN routing algorithms. Firstly we should maximize the message delivery ratio. Then the average latency and the overhead ratio should be controlled under an acceptable level. There are two stages in our proposed routing. In the spraying stage, GSU-Spray sprays message copies to others. Different from traditional spray-based routing, our scheme adaptively adjusts the number of message copies between each pair of contacting nodes. For each message, when there is only one copy held by a node, the node then enters the delegation forwarding stage where nodes only replicate the message to other nodes with a higher utility metric value than the delegation threshold. In this stage, when a message is successfully relayed to
In this section, we firstly give the definition of both general metric and specific metric. We then describe how to adaptively spray the message copies to nodes by using both general and specific utility metrics. Finally we combine the specific utility metric with the node state variable γ to implement delegation forwarding. Either stage takes the node buffer space issues into consideration. The relationship of utility metrics dependency is illustrated in Figure 2.

The relationship of utility metrics dependency.
3.1. Utility-Based Asymmetrical Spraying Stage
One way to increase the performance of routing is to spray message copies to other nodes in the network, so as to raise the parallelism of the message [18]. The first stage of GSU-Spray is to asymmetrically adjust message copies between every pair of nodes. As addressed before that both general and specific utilities should be taken into consideration, we calculate the generic utility and specific utility for node

Equation (1) evaluates a node's capability of being the relay node in a “self-aware” perspective, of which
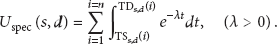
Equation (2) is used to calculate the specific utility for each pair of nodes in a “destination-aware” perspective. Different from general utility that reflects the state of a node itself, a specific utility metric measures the qualification of prospective forwarding throughput between a pair of nodes. In (2),

The relationship between
Table 2 shows the exact function values we obtain by setting different λ and
Effects of

The details of the utility-based spraying stage are depicted in Algorithm 1, where our primary goal is to spray message copies to the network as efficiently as possible. We achieve this target by adaptively allocating or reallocating the number of copies for each message when a pair of nodes get into connection. Algorithm 1 takes the information of each pair of nodes (in our case,
when (1) local variables declaration: (2) (3) (4) (5) (6) (7) (8) (9) (10) (11) (12) (13)
Different from the generic utility metric that is only relative to one node, the specific utility metric
3.2. Utility-Based Forwarding Stage
After the spraying operation, the node enters the forwarding stage, at which the primary goal is to effectively deliver messages to their respective destinations. At this stage, the task of each node shifts from reasonably distributing replicas to quickly seeking for the destination node. The corresponding utility is calculated by

As shown in (3), we only take
Delegation forwarding (DF) [15] caught significant attention in the research community because of its simplicity and impressive performance. The main idea of DF is to replicate the copies of a packet only to the individual that has a higher utility value to the destination. With the increase of the utility level, a message holder's forwarding opportunity is expected to be decreased, which means that the number of copies duplicated for a message and its total number of forwarding operations are expected to be reduced, thus reducing the network cost. Reference [15] analyses that when the total number of nodes is N, delegation forwarding has the cost of
As mentioned above, since delegation forwarding can efficiently reduce the routing costs, we devise the GSU- Spray forwarding strategy by referring the delegation forwarding strategy. Algorithm 2 shows the detailed information of the utility-based delegation forwarding process. The input of the algorithm is the information of
when (1) local variables declaration: d (2) (3) (4) (5) (6) (7) (8) (9) (10) (11) (12)
4. Analysis of Message Spraying Process
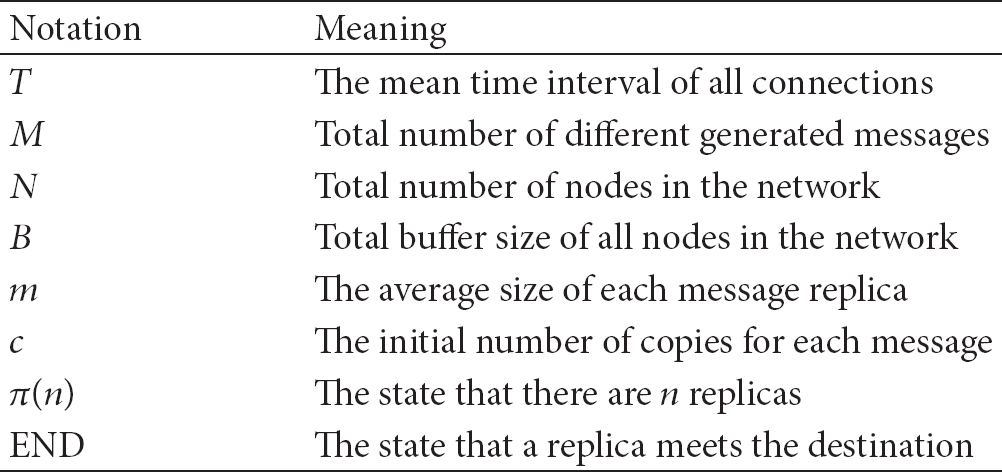
In this section, a Markov Chain Model is built to analyze the message spraying process of GSU-Spray. All the notations in this section are listed in Table 3. We assume that the mean contact time interval between any pair of nodes is T. The total time of spraying stage is split into many short time slots, each with the length T.
Mathematical notations for Markov Chain analysis.
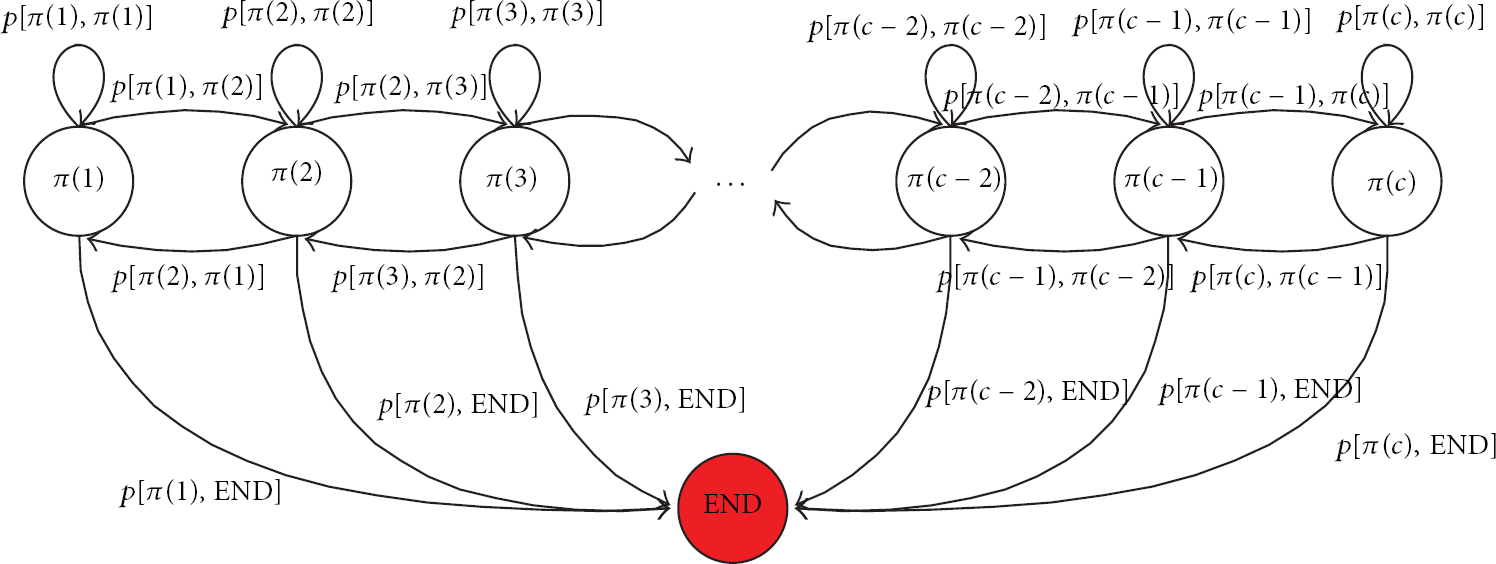
A Markov Chain that models a message replication process.
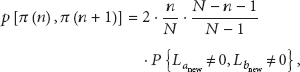
We firstly prove four lemmas, and then from these lemmas we get the transition probability of the Markov Chain. Finally we calculate
Lemma 1.
The transition probability from state
Proof.
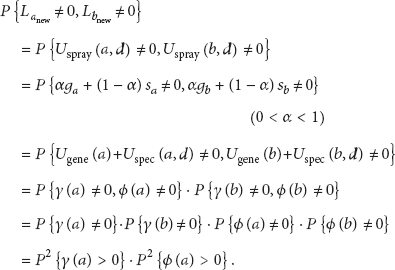
When there are n nodes with replicas of the message, the probability for some node to hold a replica is
where we have the following:
The total buffer size of all nodes is represented as B. We denote the number of different kinds of generated messages as M. Then the average buffer size for each kind of message is
Because the mean time interval between any pair of nodes contacting is T, the mean time for each node to meet any another node is

where k stands for the number of passed time slots since the starting time of spraying and

Lemma 2.
The transition probability from state
Proof.
As stated in the proof process of Lemma 1, when there are two nodes contacting, the probability that one holds a replica and the other does not is

Lemma 3.
The transition probability from the state

Proof.
When two nodes meet, the probability of either node to hold a replica is

Lemma 4.
The transition probability for the state

Proof.
Since this concludes all other cases, we can directly get it from the normative theory of probability.
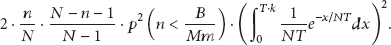
Theorem 5.
The transition probability in the Markov Chain between two states is

Proof.
The minimum latency before generating n replica of a certain message is represented as

By solving this recursive equation, we have the following:
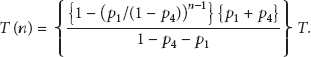
If we set the initial number of copies for each message c to be less than the constant
5. Simulation
The simulation is evaluated by the opportunistic network environment (ONE) [10]. In detail, we evaluate the Epidemic, binary Spray And Wait, Spray And Focus, and Encounter-based routing for performance comparison, using both synthetic mobility model and real trace. The simulation is grouped into the following categories: (1) varying buffer size in Helsinki City Model; (2) varying buffer size in Cambridge-iMote real trace; (3) varying message time-to-live in Helsinki City Model; (4) varying message time-to-live in Cambridge-iMote. The four comparison routing algorithms are listed as follows.
Epidemic [7]: in this routing scheme, packets received at intermediate nodes are forwarded to all the nodes neighbors (except the one who sends the packet) without employing any flooding control strategy.
Spray and Wait (S & W) [8]: spray stage: each node with more than one copy forwards half of the copies to the encountered node with no copy; Wait stage: if the destination is not found in the spray stage, the copy carriers wait for the destination. This algorithm only employs an unaware utility that assigns a maximum number of replicas for each message.
Spray and Focus (S & F) [9]: the spray stage of S & F is the same as in binary S & W that symmetrically distributes the message replicas. The difference is that S & F adopts the focus phase instead of wait phase, decreasing the delivery delay via a utility forwarding approach. The employed utility is only destination aware (specific).
Encounter-Based Routing (EBR) [10]: EBR is an asymmetrical spray-based routing protocol, which takes advantage of the observed mobility property of certain network, assuming the future rate of node encounters can be roughly predicted by historical information. The assumption behind it is that nodes experience a large number of encounters that would have a higher potential to relay the message to final destination. The employed utility for distributing the replicas is only self aware (general).
For simplification, in our simulation, the self-aware variable
Delivery Ratio: normally, the ultimate goal of routing in DTNs is to achieve great delivery performance. This criteria is the measure of delivery capability for each protocol. When the network resource is sufficient, Epidemic routing usually has the best delivery performance. This is because Epidemic routing always finds the best possible path to the destination. Therefore it represents the baseline for the best possible delivery performance.
Average Latency: end-to-end latency is another important concern in DTN routing design. Long average latency means that the message must occupy valuable buffer space for a longer time, and consequently we desire a low latency value.
Overhead Ratio: it is desirable to have a low overhead ratio, since it reflects the efficiency of message transmission. Overhead ratio is defined to be the number of relay operations (excluding the delivery action) over the number of total delivered messages.
Average Hop Count: we expected to minimize the number of hops that a message must take in order to reach the destination.
5.1. Simulation in Helsinki City Scenario
5.1.1. Performance Evaluation by Varying Buffer Size
In Helsinki City Scenario [19], the nodes are assumed to be users with mobile phones or similar devices, using Bluetooth interface at 250 KBps bandwidth and 10 m transmission range. In this case, the initial free buffer size of each node is set to be small, which ranges from 5 M to 55 M. There are six trams following predefined routes, and there is an extra high-speed interface at 10 MBps bandwidth and 1000 m transmission range for the communication between trams. Two thirds of the remaining nodes are pedestrians and one third are cars. The speed of cars is set to be 10–50 km/h and the speed of trams 25–36 km/h, with the pause time of 10–120 s and 10–30 s, respectively. Both pedestrians and cars randomly choose their destinations on the map and move along the shortest path. The parameters settings are listed in Table 4.
Simulation settings of Helsinki City Scenario.
Regarding the results in Figures 5(a), 5(b), 5(c), and 5(d), GSU-Spray achieves the highest delivery ratio and the lowest average latency. The overhead ratio of GSU-Spray protocol is almost as low as S & W and S & F and is much lower than that of Epidemic and EBR. However the average hop count is higher than Epidemic and EBR when the buffer size is more than 15 M.

Buffer size versus delivery ratio, average latency, overhead ratio, and average hop count (Helsinki City Scenario).
The result in Figure 5(a) shows that GSU-Spray significantly outperforms Epidemic and EBR but has a slightly higher delivery ratio than S & W and S & F. However, in Figure 5(b), it is obvious that the average latency of GSU-Spray is the lowest among all protocols. This is because GSU-Spray adaptively adjusts the number of message copies between each pair of nodes, thus making the message copies have a higher probability to meet the destination. Another reason is that GSU-Spray employs the delegation forwarding method to replicate the message in a gradient way to the destination, thus lowering the average latency of each message. However, from Figure 5(d), we see that the average hop count of GSU-Spray is relatively higher than S & W and is approximately equal to S & F. The reason is that, compared with S & W, our proposed routing employs delegation forwarding instead of waiting in the second stage of routing and this strategy is similar to S & F. When the buffer size is more than 15 M, the average hop count is higher than both Epidemic and EBR. Usually, there is sometimes a trade-off between latency and hop count, and our proposed algorithm tends to give priority to optimize the former criteria.
There are two stages of GSU-Spray protocol. In the spraying stage, the maximum number of replicas for each message is fixed. In the forwarding stage, the delegation forwarding method is employed to control the cost in
5.1.2. Performance Evaluation by Varying Message TTL
In the simulation of varying message time-to-live, we set the node buffer size (only for cars and pedestrians, not for trams) constant at 5 MB. The result in Figure 6(a) shows that GSU-Spray outperforms the other four routing algorithms in message delivery ratio. As same as illustrated in Figure 5(b), the average latency of GSU-Spray also keeps in the lowest level among all protocols in Figure 6(b). In addition, GSU-Spray performs well in both overhead and average hop count, as shown in Figures 6(c) and 6(d).
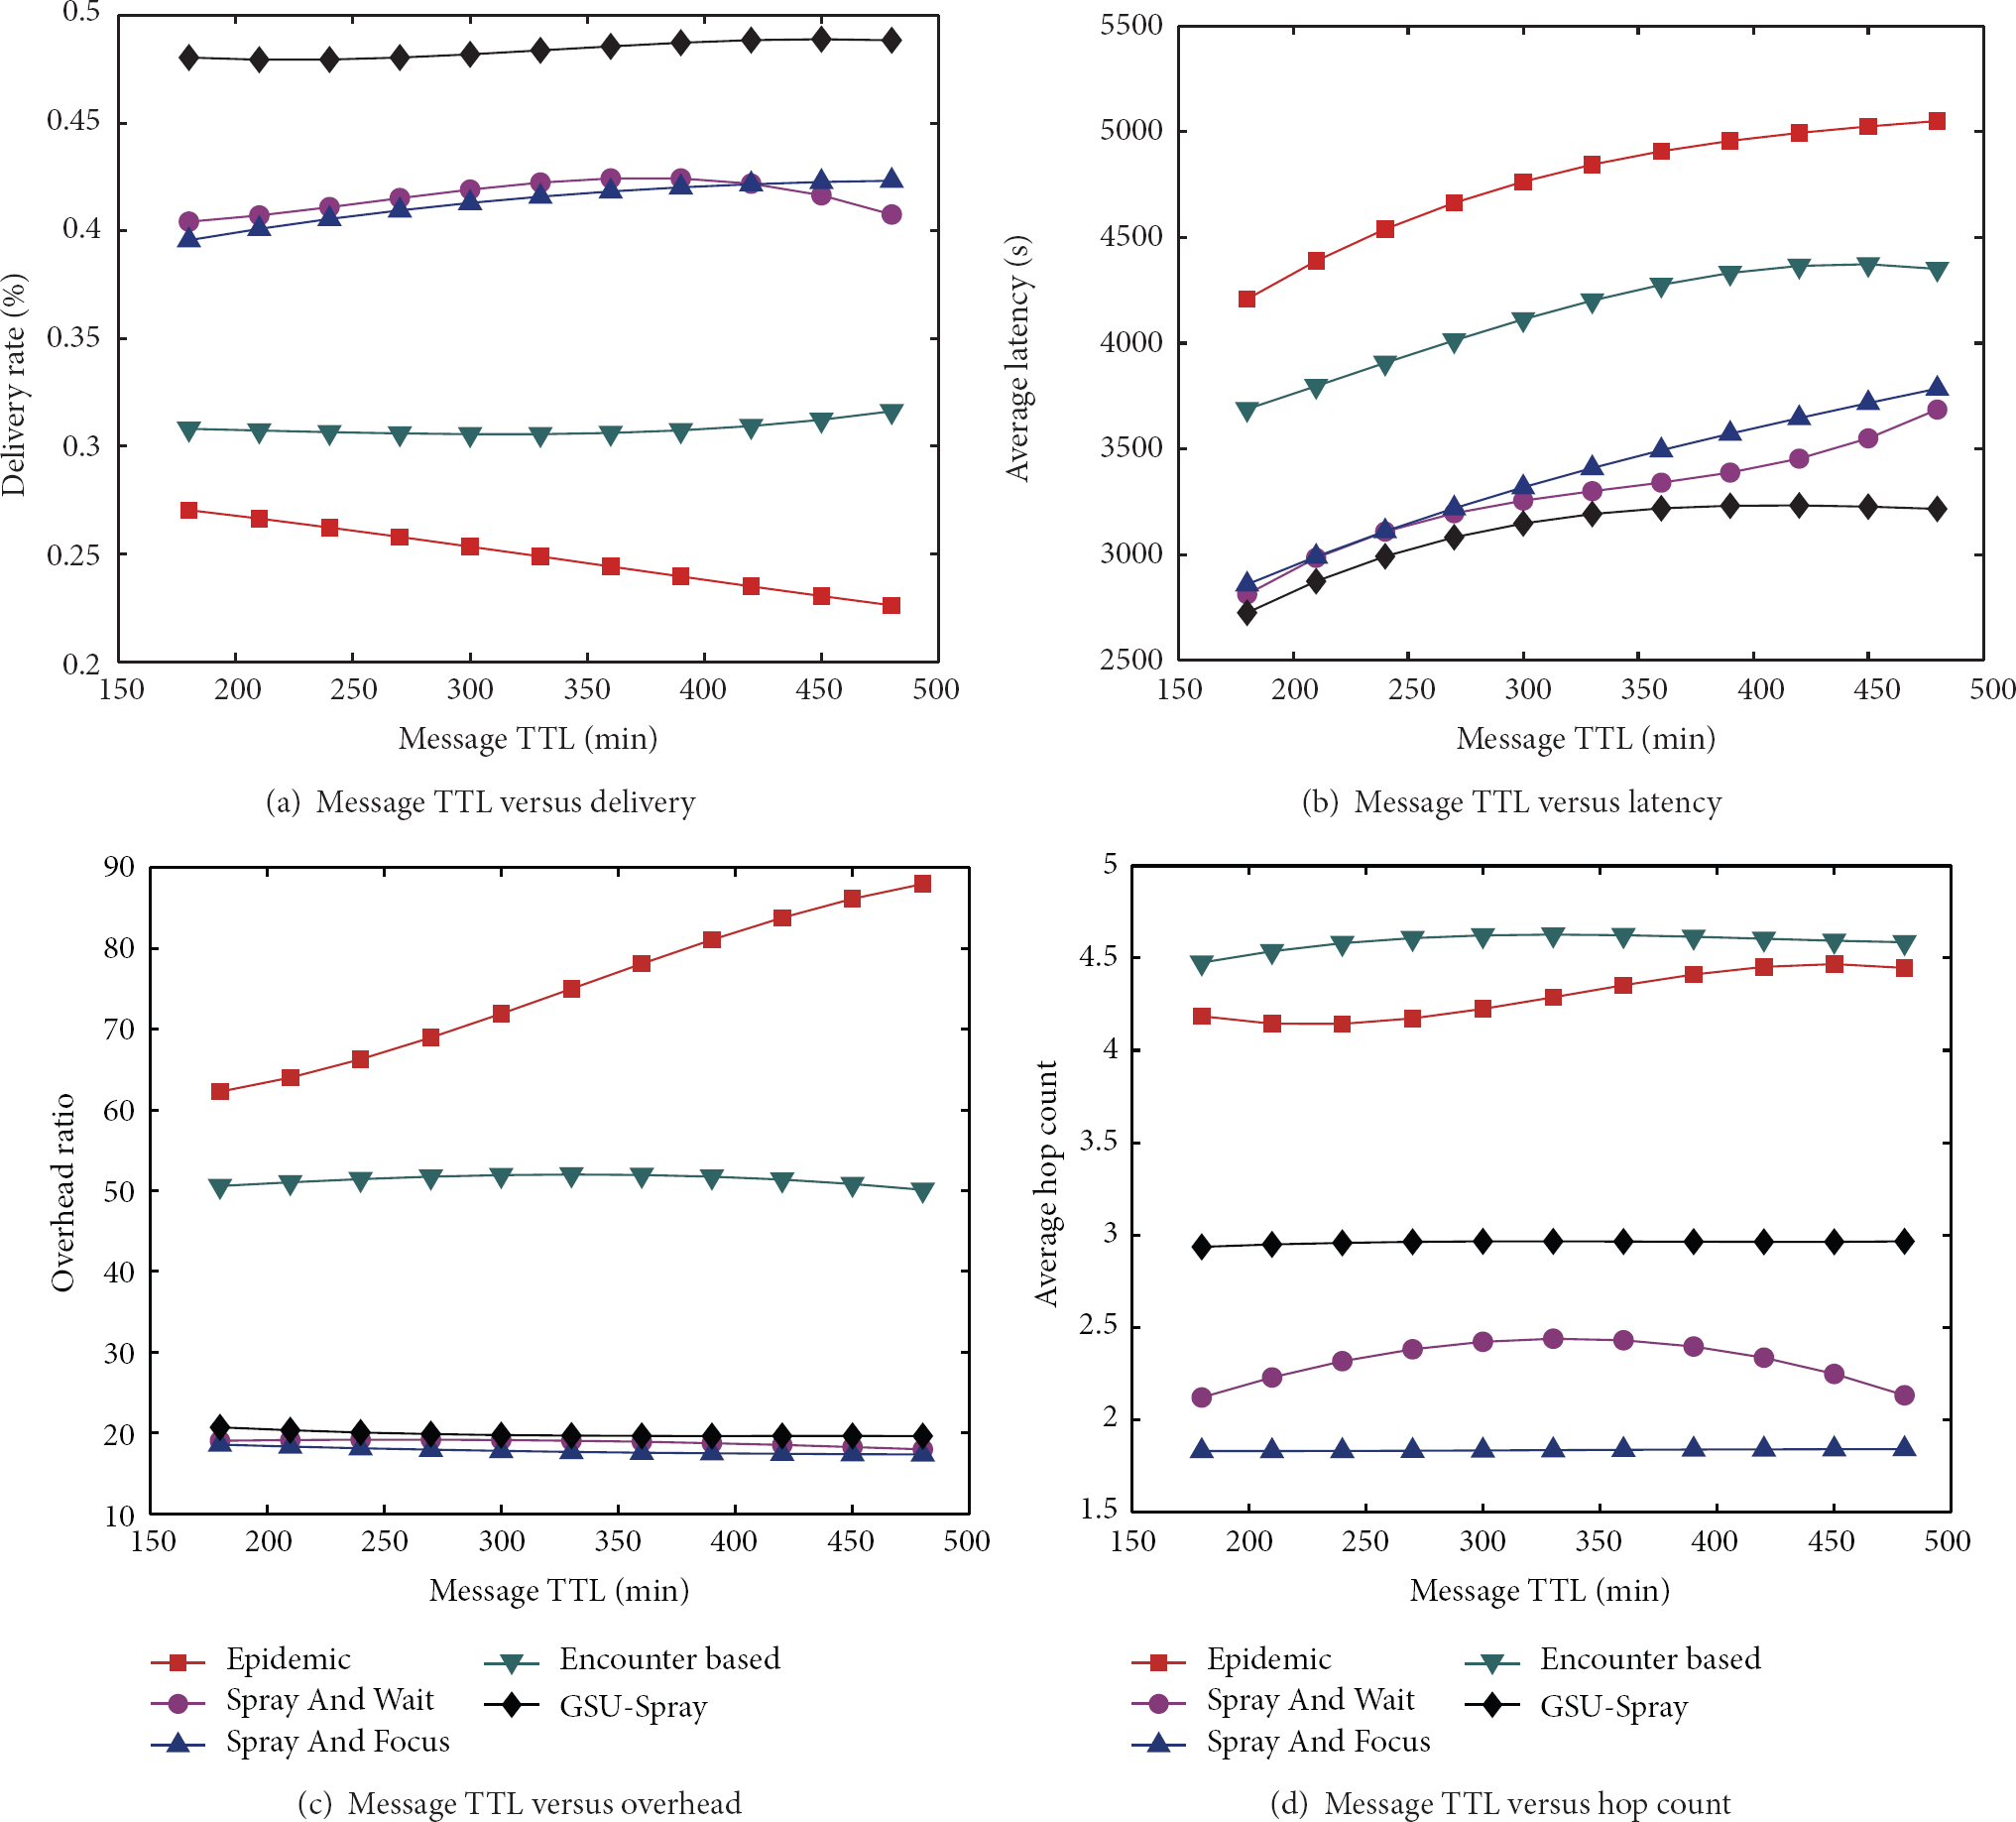
Message TTL versus delivery ratio, average latency, overhead ratio, and average hop count (Helsinki City Scenario).
The result in Figure 6(a) shows that GSU-Spray routing significantly outperforms the other protocols. The performances of S & W and S & F are approximately equal. In the forwarding stage, since we employ delegation strategy to confine the average cost of message copies, the number of generated message copies is much smaller than Epidemic, thus avoiding the buffer resource from running out quickly. As a general utility-based routing, EBR has a relatively lower delivery ratio than the others. GSU-Spray has a comparably better performance than S & W and S & F, mostly because it is an asymmetrical spray routing algorithm that utilizes both general and specific utility metrics. Besides, in the second stage of GSU-Spray, the delegation forwarding scheme is employed. And that is also the reason that the average latency of GSU-Spray is the lowest among all protocols, as illustrated in Figure 6(b).
From Figures 6(a), 6(b), 6(c), and 6(d) we know that the message time-to-live property does not have apparent influence on the routing performance. As shown in Figure 6(d), GSU-Spray performs well in average hop count. In this simulation scenario, the bottle neck factor of routing is the buffer size. The simulation result shows that GSU-Spray wins out in three criteria and has the same average hop count performance as S & F. Thus we can conclude that GSU-Spray is a good choice in the network scenario of scare buffer resource.
5.2. Simulation in Cambridge-iMote Trace
To evaluate the performance of our proposed routing algorithm in the real world scenario, we use the Cambridge Haggle trace dataset. This trace includes Bluetooth sightings by groups of users carrying small devices (iMotes) for two months in various locations that we expected many people to visit such as grocery stores, pubs, market places, and shopping centers in and around the city of Cambridge, UK. Mobile users in this experiment mainly consisted of students from Cambridge University who were asked to carry these iMotes with them at all times for the duration of the experiment. In addition to this, the experiment deployed a number of stationary nodes in various locations that we expected many people to visit such as grocery stores, pubs, market places, and shopping centers in and around the city of Cambridge, UK. A stationary iMote was also placed at the reception of the Computer Lab in Cambridge University, in which most of the experiment participants are students. The data was gathered from 36 mobile participants and 18 fixed locations. The settings of this simulation are listed in Table 5.
Simulation settings of Cambridge-iMote trace.

5.2.1. Performance Evaluation by Varying Buffer Size
In this real trace simulation, the buffer size is set to be much larger than that in Helsinki City Scenario. Figure 7(a) shows that the delivery ratio of GSU-Spray is the highest among all these protocols. When the buffer size is larger than 75 MB, GSU-Spray wins out EBR in delivery performance. The results show that in social mobile DTN scenarios the contact duration is a more accurate property that reflects the prospective throughput among nodes than contact frequency. Notice that in this real trace simulation, we set the parameter λ to be 1.0, which is nine times less than the value of 10.0 in Helsinki City Scenario, thus raising the metric's sensitivity to contact duration time of GSU-Spray.

Buffer size versus delivery ratio, average latency, overhead ratio, and average hop count (Cambridge-iMote).
Regarding the result in Figure 7(b), GSU-Spray has the highest latency. S & W stays in the lowest latency level, while its delivery performance is unacceptable. The reason is that the messages in statistics are mainly composed of those that can be delivered quickly. A number of messages that cannot be delivered in a short period are dropped during the routing process. From all the four subfigures of Figure 7, we can see that the buffer resource is not the bottle neck factor of routing performance when it is larger than 150 MB, and in this case GSU-Spray still outperforms Epidemic in delivery performance. As illustrated in Figures 7(a) and 7(b), the result data of GSU-Spray is near to that of Epidemic. Our future work in this field is to further reduce the latency of our proposed algorithm.
Now we focus on the comparison of the three algorithms, Epidemic, EBR, and our proposed GSU-Spray. If a high delivery ratio is expected with the need of an acceptable overhead cost, GSU-Spray is expected to be employed. If we want a lower end-to-end latency, it is more desirable to employ EBR, which outperforms Epidemic and GSU-Spray in average latency performance and is simpler and easier to implement.
5.2.2. Performance Evaluation by Varying Message TTL
In the simulation shown by Figure 8, we set the buffer size constant at 200 MB. As shown in Figure 8(a), with the increase of preassigned time-to-live value, the delivery performance of all these algorithms enhances. Our proposed GSU-Spray still keeps a high delivery ratio approximate to Epidemic. As shown in Figure 8(c), the overhead ratio increases more slowly than that of Epidemic. When there is no need for keeping low average hop count, GSU-Spray has an overall good performance in this real trace scenario.

Message TTL versus delivery ratio, average latency, overhead ratio, and average hop count (Cambridge-iMote).
Figure 8(b) depicts that all four algorithms have slight differences in the performance of average latency. Besides, the growth trend of latency keeps the same. When the message TTL is set to be larger, all these algorithms have a relatively higher average latency. Nevertheless the delivery ratio also rises. However, by comparing Figures 8(a) and 8(b), the latency rises much quicker than delivery ratio with the increase of message TTL. Thus we can infer that there are some messages that are hard to be delivered in a short period. Even so, this can be alleviated by using the Markov Model to adaptively adjust the initial number of copies c, as stated in Section 4. In Figure 8(d), GSU-Spray has the highest average hop count value, which is however slightly higher than Epidemic.
In conclusion, by referring to the Helsinki City Scenario, we know that our proposed GSU-Spray has relatively better performance when the buffer resource is scarce. As illustrated in the simulation result of Cambridge-iMote, since the buffer resource is no longer the bottle neck of routing performance, Epidemic and EBR also have good performance. However, when there is no need for keeping low average latency, if we want to promote the delivery performance to a higher level, GSU-Spray is a better choice. What is important is that GSU-Spray is the only routing algorithm that has overall good performance in the two different scenarios.
6. Related Work
Reference [20] presents two multicopy forwarding protocols called optimal opportunistic forwarding (OOF) and OOF-, which maximize the expected delivery rate and minimize the expected delay, respectively, while requiring that the number of forwarding operations per message does not exceed a certain threshold. Reference [21] applies the evolutionary games to noncooperative forwarding control in MDTNs, of which the main focus is on mechanisms to rule the participation of the relays to the delivery of messages in DTNs. Reference [12] provides a reliable data delivery scheme for mobile sensor networks with an enhanced delaying technique. Nodes estimate connectivity and expect interencounter time with sink nodes. Connectivity is estimated based on ratio of past and present connections. When the connectivity is unreliable, nodes delay the transmission for the remaining interencounter duration or per-hop lifetime. Reference [22] theoretically proves that considering both factors leads to higher throughput than considering only contact frequency. To fully exploit a social network for high throughput and low routing delay, the authors propose a social network oriented and duration utility-based distributed multicopy routing protocol for DTNs. In [11], the authors find that it is wise to wait till much better opportunities arise to minimize the communication cost without degrading the delivery ratio and latency. Consequently a universal scheme, named E-Scheme, is proposed to improve routing on the delivery probability metric. In [23], the authors propose a distributed optimal community-aware opportunistic routing (CAOR) algorithm that computes the minimum expected delivery delays of nodes through a reverse Dijkstra algorithm and achieves the optimal opportunistic routing performance. By proposing a home-aware community model, whereby turning an MON into a network that only includes community homes, the computational cost and maintenance cost of contact information are greatly reduced.
7. Conclusion
In this paper, we propose a general and specific utility-based adaptive routing algorithm GSU-Spray for mobile DTNs. Different from the current stochastic routing protocols that forward messages according to a contact frequency-based utility, our proposed algorithm utilizes the contact duration time as the criterion to evaluate the relationship between nodes. Consequently by combining the self-aware and destination-aware utility metric, we design two synthetical metrics to indicate the suitability of a node to be the relay for a certain message, which are employed in the spraying stage and forwarding stage, respectively. When calculating the destination-aware utility, rather than simply accumulating every contact duration time for each node, we design a function by integrating an exponential function
Footnotes
Conflict of Interests
All authors do not have any possible conflict of interests.
Acknowledgments
This research was supported in part by Foundation Research Project of Qingdao Science and Technology Plan under Grant no. 12-1-4-2-(14)-jch and Natural Science Foundation of Shandong Province under Grant no. ZR2013FQ022.