
Abstract
Additive manufacturing by laser beam melting is predestined for complex component geometry like integrated cooling channels without enormous posttreatment processing. To investigate the influence of build-up direction in terms of later tooth excitation of gear-wheels, first fundamental material analyses were accomplished in this publication. Therefore, additively produced specimens were used to determine the build-up direction dependent elastic properties of the material in all three spatial directions based on tensile and torsion tests. The anisotropies of elastic limits and breaking points of previous studies were confirmed in this paper. Furthermore, torsion values were also determined depending on build-up direction. Laser beam melted X3NiCoMoTi18-9-5 (hot-work tool steel) was shown to exhibit extremely high performance under shear loading in comparison to conventionally processed steel. The influence of build-up direction on torsional strength was also shown.
1. Introduction
In recent years, additive manufacturing has become a reliable tool for custom small-batch production or for prototyping and has accelerated the conversion of CAD designs into reality. The process is dependable, reduces design lead times, and offers new geometric possibilities, which is why, in addition to its use in prototyping applications, it could also be considered for use in traditional mechanical engineering if the respective boundary conditions are favourable. With additive manufacturing, limits of producibility of conventional manufacturing are no longer valid, especially for the generation of geometries with undercuts and internal free-form cavities, opening up new possibilities for the production of gears. Researchers are currently working on increasing the efficiency of tooth contact, which they hope to achieve by integrating coolant channels into tooth flanks [1], see Figure 1.

Additive manufactured gear with integrated coolant channels [1].
Another possible application is the production of acoustically optimised wheel bodies, which require complex geometric shapes according to [2].
However, the material properties of additively manufactured components are not directly comparable to those of conventionally produced parts. In detail, this paper describes the mechanical analysis of the properties of additively processed, laser beam melted hot-work tool steel X3NiCoMoTi18-9-5 (material number 1.2709) which is not suitable for an application in gears but shows equal effects between different build-up directions. Qualification of the gear material 16MnCr5 for the laser beam melting process is current state of research and will be ready for industrial use in the medium term.
2. State of Research into the Material Properties of Laser-Fused Components
The additive manufacturing process of laser beam melting in use at the Fraunhofer Institute for Machine Tools and Forming Technology (IWU) applies a thin layer of powder and then melts it selectively with a laser. The microstructure of this fused material has a substantial influence on the material's mechanical properties. According to [3], rapid cooling of the fused material produces a very fine-grained microstructure, which in turn leads to high hardness values and brittle material behaviour. Slow cooling, in contrast, favours the formation of large grains, which reduces hardness values and has a negative impact on ductility. Elastic properties, however, are not determined by grain size but rather by interactions between lattice atoms. Thus, according to [3], the characteristic values for elasticity are not influenced by the parameters of the manufacturing process. Contrast this with [4], where it was published that the modulus of elasticity is dependent on the laser energy used. It was demonstrated concretely that the use of a 1,000 Watt laser system led to the formation of a strong alignment parallel to the build-up direction.
As a result, an increase in the modulus of elasticity was detectable. This leads to the conjecture that the high energy input from the laser causes a directional solidification of the crystallites and thus a kind of growth structure. However, no further description is given of the process parameters, and so only a limited assessment of the conclusions is possible. Reference [5] offers another possible explanation for the general dependence of the modulus of elasticity on the laser energy. The density and modulus of elasticity of test specimens are shown to be related to the laser scanning speed. Since all other process parameters were held constant for the tests, the input energy can be extrapolated directly from the scanning speed. As the scanning speed increases and thus the energy input drops, the density clearly decreases and the modulus of elasticity falls. This is consistent with the reasoning of [3], which states that the modulus of elasticity is dependent on the interatomic distance and not on the microstructure. Therefore, the elastic properties can be influenced by the selection of parameters for the manufacturing process.
Aside from the influence of process parameters on material properties, a relationship between build-up direction, stress direction, and respective strength values was demonstrated in several papers (e.g., [3, 4, 6–8]). From this it can be assumed that the bonds between two successive layers differ from those within one layer, thus resulting in different properties.
Furthermore, [8] determined that powder from different manufacturers can lead to different moduli of elasticity and strength values in manufactured specimen. The dependences cited has been demonstrated several times, but the influencing variables are so numerous and varied that only a few characteristic values of additively manufactured steels are currently included, for example, in technical guideline VDI 3405 (part 2).
Moreover, the process parameters are adapted individually to each application and therefore hardly comparable. The load capacities of components cannot be calculated reliably without knowing the exact material characteristics, meaning that these values must be determined individually for the respective process parameters. Based on the assumption that the microstructure within one layer forms homogeneously, it can be assumed that the characteristic values of the material within that layer are directionally independent. This tendency has already been demonstrated in [7] for hardness values. If this can also be confirmed for the elastic properties, it will be possible to fully describe the elastic behaviour of additively manufactured components using a transversely isotropic material model. This will require determination of five independent material parameters, consisting of the modulus of elasticity, the shear modulus, and Poisson's ratio (E1, E3, G13, ν12, and ν13 if the additive layer corresponds to layer 12; see Figure 8), for the respective additive manufacturing process.
In this paper, tensile and torsion tests are used to demonstrate the validity of the material model and to reveal the necessary characteristic values of the tested hot-work tool steel X3NiCoMoTi18-9-5. The measured material properties are also related to each other in accordance with the assumptions of a transversely isotropic material model. The following gives an explanation of the tests as well as a presentation of the results obtained. The current state of laser beam melting technology does not yet offer a quenched and tempered steel for gear tooth applications, such as 16MnCr5 which would be processable with laser beam melting on commercially available laser beam melting machines. Therefore, these tests will first be applied to material X3NiCoMoTi18-9-5, even though it is known that this material is not suitable for gear teeth. Nevertheless, the results that are obtained will be translatable to future additive processing of a material like 16MnCr5.
3. Experimental Tests
Tensile and torsion tests were performed to determine the five independent material parameters. The test specimens that were required for this were all produced with an angle of 0° or 90° between the build-up direction and the longitudinal axis of the specimen. As such, they are also referred to as having a vertical or horizontal build orientation. Five specimens were produced for each test and each build orientation. The time needed to fuse one material layer during the laser beam melting process depends in large part on the size of the regions to be fused. The smaller the area to be fused in one layer, the faster the next powder layer can be applied and fused. This shortens the intervals between laser energy inputs into the component, thus increasing the base temperature in the built-up (fused and solidified) regions of the specimen. This is believed to be the reason for the differently coloured material regions (annealing colour) of the vertical blanks in Figure 2(a). The individual specimen locations were measured and documented for later comparison with actual location of fracture in order to determine what level of influence these areas have on location of fracture. The manufacturing of the specimens was performed on a “Concept Laser M2 cusing” laser beam melting machine with a random chessboard scanning strategy (5 × 5 mm2 chessboard subfield size), an diode-pumped fibre laser with 400 W nominal power, continuous wave, and the following build-up parameters:
laser power: 187 W
scan speed: 600 mm s−1
hatching: 0.105 mm
layer thickness: 0.03 mm.

Additive manufacturing process samples with different build-up directions (a) and numbering of specimens (b).
3.1. Tensile Tests
Uniaxial tensile tests were used to determine the moduli of elasticity and Poisson's ratios for the different spatial orientations of the additive manufacturing process. The geometry of the test specimens was based on DIN 50125 for these tests. Additional conventional machining steps such as turning and grinding were necessary based on the tolerances and surface roughness required for tensile specimens. Tensile specimen strain was measured via the optical method of grey value correlation using an ARAMIS-12 M measuring system of Gesellschaft für Optische Messsysteme (GOM mbH, Braunschweig/Germany). This reduced the impact of the rigidity of the tensile testing machine on the measurements and made it possible for the longitudinal and transverse strain to be determined at each point in time during testing. In order to minimise the measurement uncertainty resulting from this method, it was necessary to select a large enough stochastic sample or number of measurement facets on the specimen surface (according to photooptical aspects). Thus, an appropriate specimen cross section was required. In the end, preference was given to a square specimen cross section with a side length of 5 mm and a parallel initial length of 25 mm. This cross section was confirmed with the measuring system in pretests (Figure 3).

Laser beam melted workpiece (a) and machined specimen (b) geometry for tensile test.
The tensile tests were carried out on an Inspekt universal testing machine made by Hegewald & Peschke MPT GmbH, Nossen/Germany (Figure 3(a)). The longitudinal and transverse strains of two mutually perpendicular specimen sides had to be analysed, and so both sides had to be recorded by the optical measuring system during the entire test. The test setup was thus arranged to allow each camera of the ARAMIS system to record both sides of the specimens. A sample camera image is shown in Figure 4(b). This made it possible to record the deformation of both sides of the specimens and to determine elastic material characteristics for the entire test duration. The force signal of the tensile testing machine was fed to the ARAMIS system to allow strain values to be linked to the associated specimen stress. As recommended in DIN EN ISO 6892-1, the crosshead speed was set to 0.8 mm/min for the elastic region and 5.0 mm/min for the plastic region.

Test setup (a) and ARAMIS system camera image of the clamped specimen (b).
The stress-strain curves for all tensile test specimens are shown in Figure 5. Specimen number assignments can be found in Figure 2(b). There is a noticeable difference between the curves of vertically oriented (specimens 11 to 15) and horizontally oriented (specimens 1 to 10) tensile specimens. Once the ultimate tensile strength is exceeded, any further increase in stress results in a proportionately larger drop in strain followed quickly by material failure.

Stress-strain curves for specimens 5, 7 (horizontal build-up direction) and 12, 15 (vertical build-up direction) subjected to tensile testing.
Different material behaviour depending on specimen orientation in manufacturing cannot be explained solely by the grain size of the material's microstructure. It is conjectured that grain size is different for the two build-up directions, since, as previously explained, the processing time per layer of the vertically oriented specimens is shorter and the energy input occurs in shorter intervals. This results in a slower cooling of the material, which thus tends to have a larger grain size.
The horizontally oriented specimens exhibit high tensile strength and ductility, whereas the vertically oriented specimens tend to exhibit lower strength and rather brittle behaviour. The sharply divergent ductility can be regarded as an indicator for small grains in the horizontally oriented specimens and large grains in the vertically oriented specimens. The high strength and ductility exhibited by the horizontally oriented specimens and the lower strength and rather brittle behaviour of the vertically oriented specimens lead to the conjecture that the formation of a fine-grained or coarse-grained microstructure depends on the specimens’ orientation in the build job. This means that the higher base temperature of the vertically oriented specimens, in addition to causing the differently coloured regions, also influences microstructure formation.
In order to minimise the impact of different grain sizes and to enable a targeted investigation of any further effects, the process parameters should be selected so that the energy input is independent of the specimens’ orientation in the build job and the component geometry. This will ensure comparable heat influence and microstructure formation in all cases. Otherwise, the material relationships will be very complex, making it difficult to assess the load capacity of additively manufactured components. It must also be noted that the stress-strain curves of all horizontally oriented specimens exhibit a small spread. The specimen position on the build platform during the manufacturing process was not observed to have an influence on strength values. However, the ultimate tensile strengths that were determined for the vertically oriented specimens exhibit relatively large differences. It seems that individual local failure sites within a layer have a much larger effect in the case of small cross-sectional areas built up per layer.
The ultimate tensile strength of a specimen corresponds to the maximum stress occurring during the test. The largest stress value was determined for each specimen, and a mean value was calculated for all the specimens with a given orientation in the build job. The resulting value corresponds to the ultimate tensile strength of the respective angular orientation. Furthermore, the modulus of elasticity and the 0.2% yield strength can be determined directly from the stress-strain diagram.
The modulus of elasticity corresponds to the slope of the linear elastic region. Thus, a regression line was determined for each specimen at a sufficient distance from the beginning and end of the elastic region. The slope of this regression line corresponds to the modulus of elasticity. The mean value for each angular orientation in the build job was in turn derived from these determined values.
It can be seen in the stress-strain curve that the tested material has no pronounced yield strength, and so the transition from the elastic region to the plastic region is defined with a constant strain of 0.2% [9]. In order to determine the associated yield stress Rp0.2, a line was plotted through ε = 0.2% parallel to the linear elastic region, and its point of intersection with the stress-strain curve was determined. The stress value obtained by this method corresponds to the yield strength of the specimen. A detailed list of the test results can be found in Table 1. An ultimate tensile strength of 1100 MPa is indicated for conventionally produced, untreated X3NiCoMoTi18-9-5. Additively manufactured steel parts thus exhibit the same performance as with conventional manufacturing.
Results of tensile tests.

As in previous studies, these tests demonstrated the dependence of strength values on the specimens’ angular orientation in manufacturing. Vertically oriented components have an approximately 20% lower yield strength and an approximately 12% lower ultimate tensile strength under application of the selected production parameters. The expected anisotropy of the moduli of elasticity could not be precisely demonstrated, however. Nevertheless, the directional dependence must be acknowledged based on the measurements of all specimens and cannot be attributed to measurement uncertainty. However, the relationship between the anisotropic material parameters was shown and can be trusted. Solely, the exact values are uncertain. The extent to which this small difference has an impact on the design of components and whether it needs to be taken into consideration at all will have to be decided on a case-by-case basis.
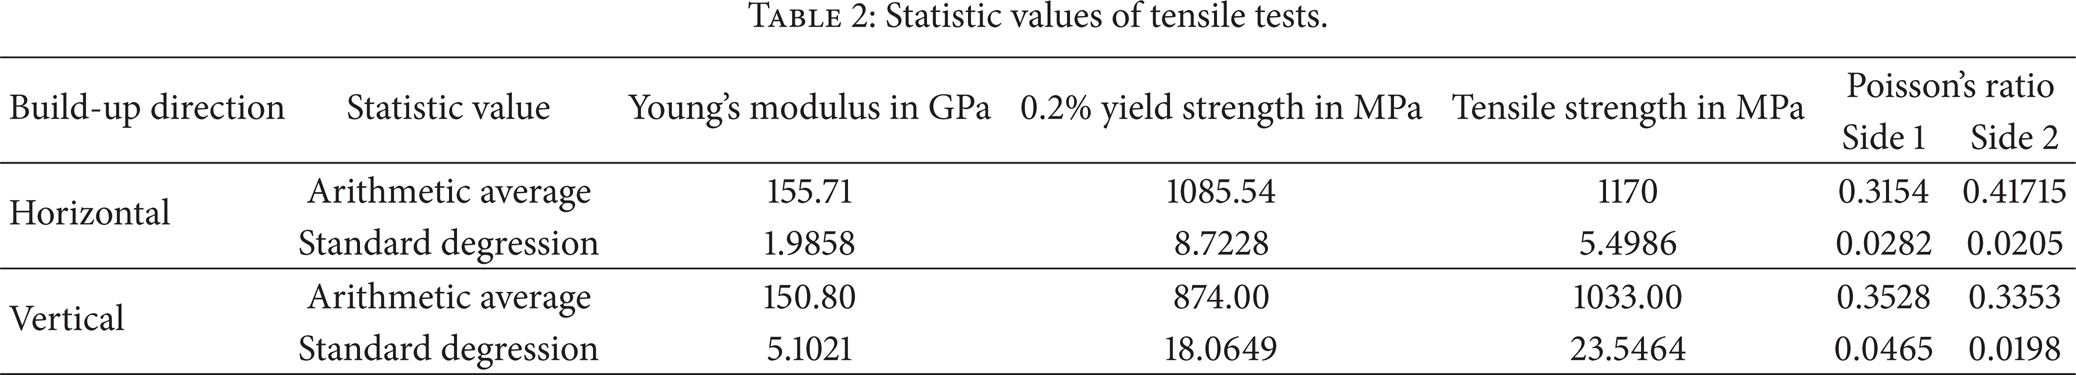
In addition to Table 1 the following Table 2 presents the relevant statistic values of all specimen. Because of the small quantity of tested specimens, there is no usual statistical coverage. Otherwise, the available space was fully exploited as shown in Figure 2.
Statistic values of tensile tests.
Poisson's ratio ν corresponds to the negative ratio of transverse strain to longitudinal strain. The Poisson's ratio for each specimen and specimen side was determined by creating a diagram with transverse strain over longitudinal strain and then plotting the regression line in the elastic region. The slope of these lines thus corresponds to the negative of Poisson's ratio. The mean values were then determined for each build-up direction and specimen side, and all the values were summarised in Figure 6.

Poisson's ratios ν determined for two adjacent perpendicular specimen sides of each specimen and the resultant mean values, horizontal build-up direction (a) and vertical build-up direction (b).
Clearly, the Poisson's ratios of the two sides differ in the case of the horizontally oriented specimens. The values from specimen side 1 represent the transverse contraction within an additive layer when the load is acting on that layer. Based on the results, it can be seen that this contraction is smaller than the contraction of layers lying on top of one another at the same point in time. The directional dependence of the Poisson's ratio for horizontally oriented specimens was thus demonstrated. The results are less clear for the vertically oriented specimens. The transverse contractions of side 1 and side 2 both indicate the deformations within the levels when the load is acting perpendicular to them. Therefore, identical results were expected for both sides. Based on the measured values, however, this conformity could not be precisely demonstrated. Even so, the deviations are considered to be relatively small, such that the transverse contraction within an additive layer is characterised as virtually direction independent.
3.2. Torsion Tests
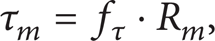
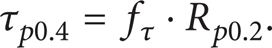
Torsion tests were used to determine the torsion-specific elastic properties and strength values and to check the assumption of the following equation:

A precise determination of the shear modulus requires that only shear stresses occur during the test and that no axial stress components be superimposed on them. A circular cross section is used for the specimens to avoid the occurrence of bulging and the accompanying axial stresses (St. Venant torsion) in the specimen cross section. The torsion tests were carried out in accordance with DIN EN ISO 6892-1 and the tensile test with DIN 50125. The means of clamping the specimen to the test machine was adapted to the features of the machine being used, and so a square cross section was implemented on the ends of the specimens. The largest possible transition radius was chosen in order to avoid notch effects and the accompanying impact on the stress state in the transition from the round cross section to the square cross section. According to [10], relationship between the diameter d of the circular cross section and the parallel specimen length L should be expressed by L = 10d. The selected specimen geometry fulfills this requirement and is shown in Figure 7.
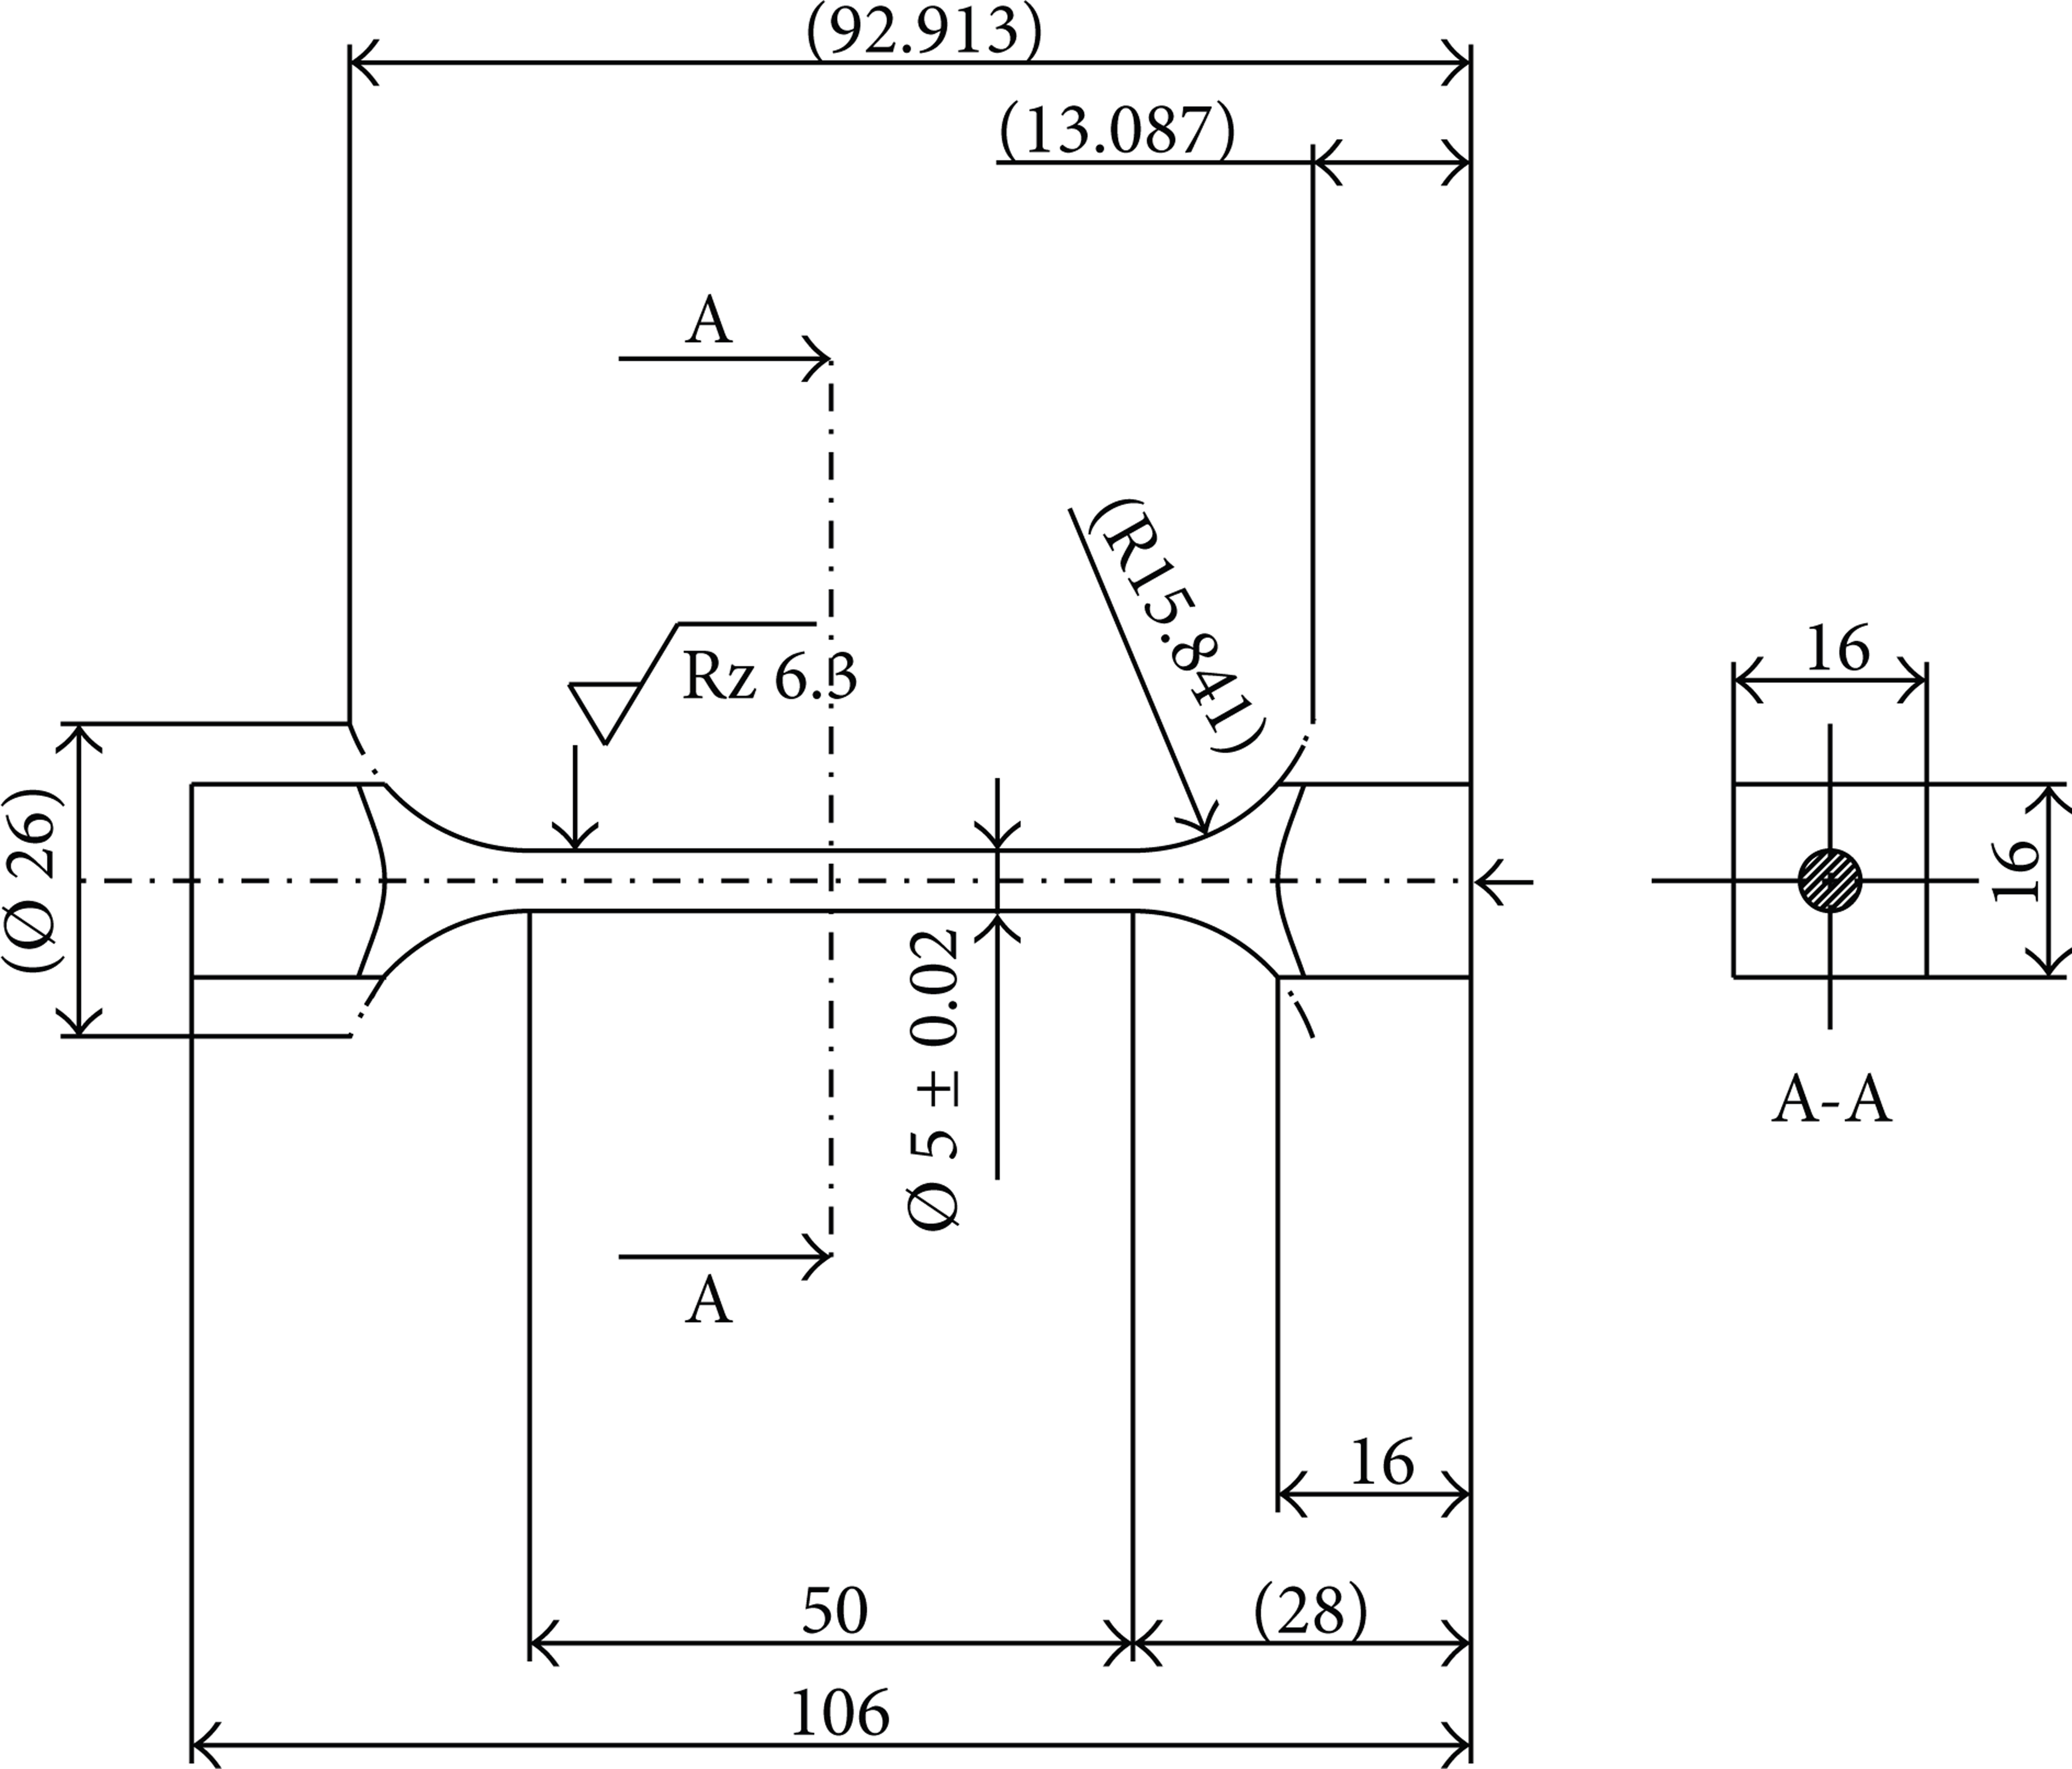
Specimen geometry for torsion tests.
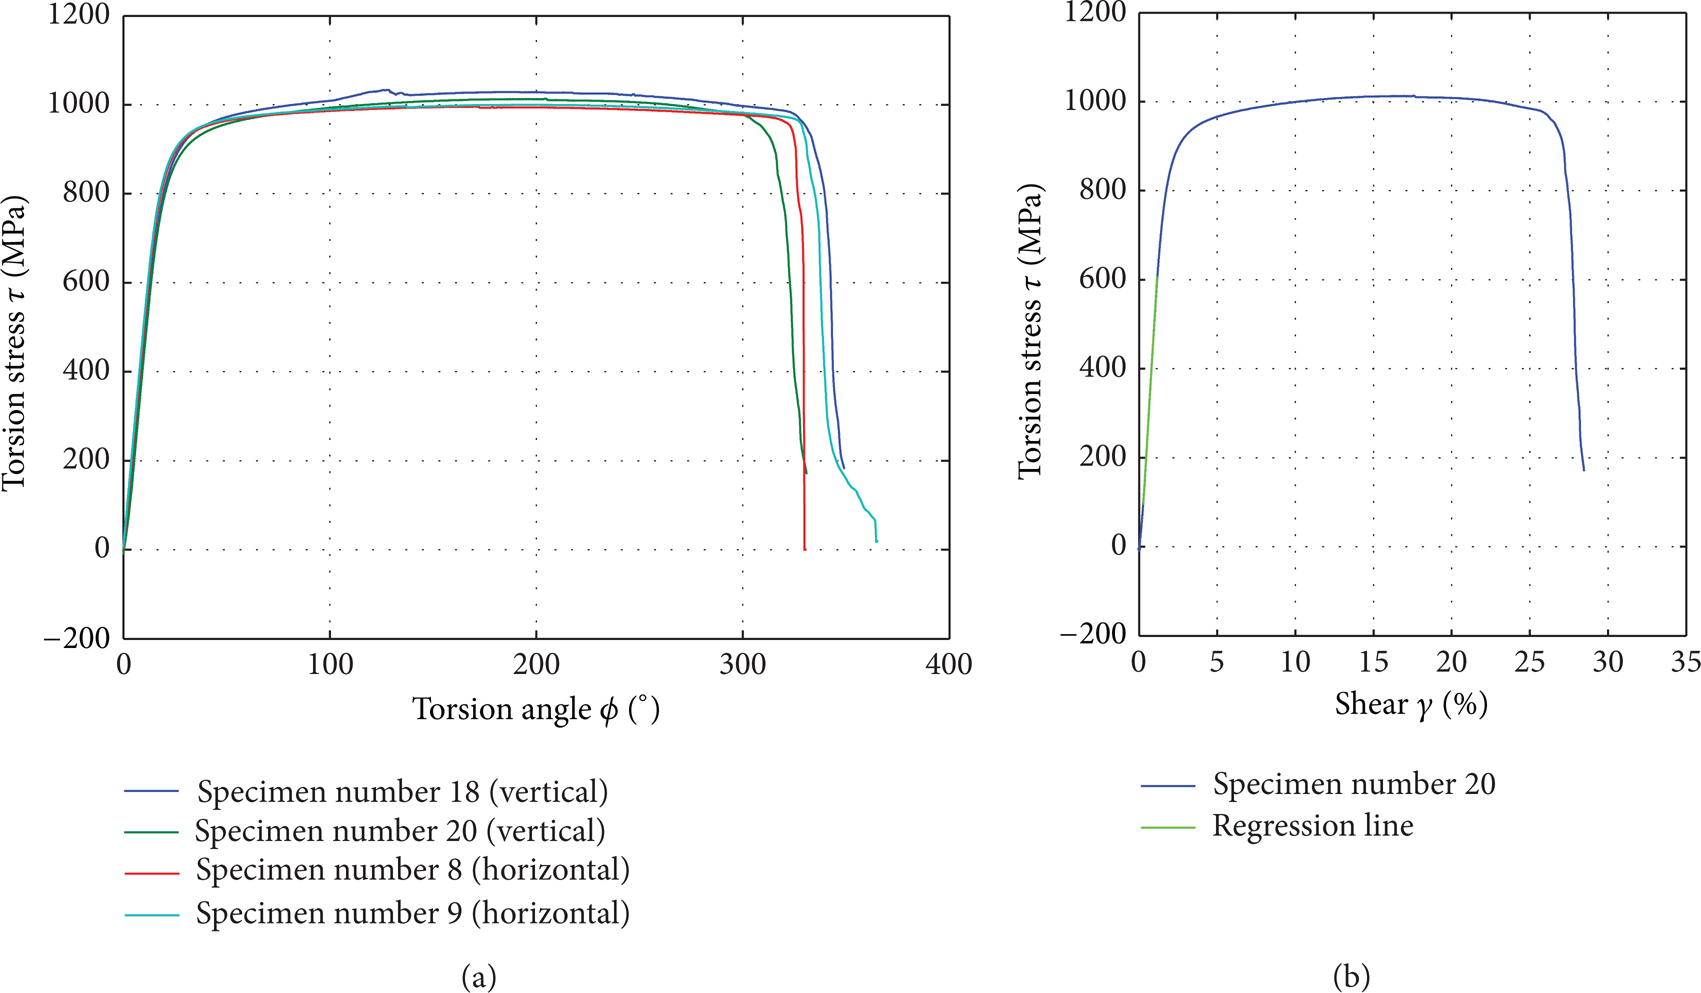
Curve of torsional stress over angle of rotation for all specimens ((a) specimens 8, 9: horizontal build-up direction and specimens 18, 20: vertical build-up direction) and curve of torsional stress over shear ((b) specimen 20).
The stress rates recommended in DIN EN ISO 6892-1 for tensile testing were converted for torsion stresses in order to define the test speeds. This DIN standard gives different stress rates in the elastic region based on the magnitude of the modulus of elasticity and makes recommendations for the stress rate in each case. However, the physical variable that can impact material behaviour is not the rate of stress increase but rather the rate of strain increase. The classification according to moduli of elasticity takes this fact into account and specifies mostly constant strain rates. This was likewise taken into account when making the conversions for the torsion test, by equating the strain and shear rates. When the stress rate, modulus of elasticity, and shear modulus are inserted, the result is

If
The tests were carried out on a Zwick Roell Z050 material-testing machine with torsion module. Figure 8(a) shows the resulting curve of torsional stress over angle of rotation for all specimens. Unlike in the tensile test, there are no significant differences to be seen here between the individual curves or, consequently, between the build-up directions of the specimens. Moreover, the very large maximum twist angle at break of 260° to 360° is notable. Accordingly, components produced additively via laser beam melting exhibit an extremely high torsional ductility regardless of build-up direction. The characteristic values in the stress-shear diagram were determined as in the tensile test. The following equation can be used to convert the measured torsion angle ϕ to the shear γ on the specimen surface, where r represents the specimen radius and L the parallel initial length:

This results in the stress-shear curve, as shown in Figure 8(b) for specimen 20. As with the modulus of elasticity, the shear modulus corresponds to the slope of the regression lines in the elastic region. However, the transition to plastic behaviour is defined as a constant shear of 0.4% [11]. The mean values of the characteristics for both build-up directions were likewise determined and are summarised in Table 3.
Characteristic values derived from the stress-shear diagram (mean values, in MPa).

The torsional values are also seen to exhibit a dependence on the specimen orientation. However, this dependence is smaller than that seen in the tensile test. The yield strength of the vertical orientation is 3% lower than that of the horizontally orientated, whereas their torsional strength is 3% higher. No clear anisotropy is detectable for the shear modulus.
4. Results and Discussion
The following equations, according to [12], can be used for converting elastic limit and yield strength to torsion or shear values for conventionally produced steel under normal stress:
For (5), the shear strength factor fτ = 0.577 appears in the literature for case-hardened steel, stainless steel, forged steel, and other steels. Thus, the bearable stresses under shear loading are 42.3% lower than under tensile loading. This comparison can also be made for the laser beam melted material based on the characteristic values determined in the tests. This results in

The torsional and shear capacities of additively processed steel are thus considerably higher than those of conventional steel. The strength values that were determined for the vertically orientated specimens were virtually the same whether under tensile or shear loading.
To determine how closely the behaviour of laser beam melted components corresponds to the transversely isotropic material model, the measurements are inserted into the required relationships between material constants. The label of the elastic material properties for the different spatial directions is based on the definition of Figure 8. The shear modulus G12, with a value of G12 = 57.11 GPa corresponds to the value determined in the test for vertically structured specimens. The calculated shear modulus value based on the required relationship and the measured Poisson's ratio of side 1 of the specimen with horizontal build-up direction (see Figure 6(a)) comes to

Furthermore, from the measured transverse contractions of the vertically orientated specimens’ results (Figure 6(b)),

This follows in

The result of (7) is not the same as the measured value (G12 = 57.11 GPa). Furthermore, (9) do not meet the requirements of the transversely isotropic material model ν13/E3 = ν31/E1. Therefore, the expected material behaviour with respect to the assumed model could not be precisely confirmed on the basis of the measured values. Values for G12 and ν31 are also necessary for a complete description of the elastic behaviour. Nevertheless, the differences between the actual properties in the tests and the transversely isotropic model are marginal that transversal isotropy can be assumed for approximate calculations. The resulting errors are comparatively small.
Additional detailed materials testing is required to confirm the demonstrated relationships. Apart from the current literature's confirmation of strength value dependences, this paper was also able to demonstrate the extremely high torsion strength of laser beam melted components with vertical as well as horizontal build-up direction. As previously justified, additional calculations are carried out using the transversely isotropic material model. The elastic constants of this model are summarised and illustrated in what follows for the case where direction 3 corresponds to the build-up direction (Figure 9).
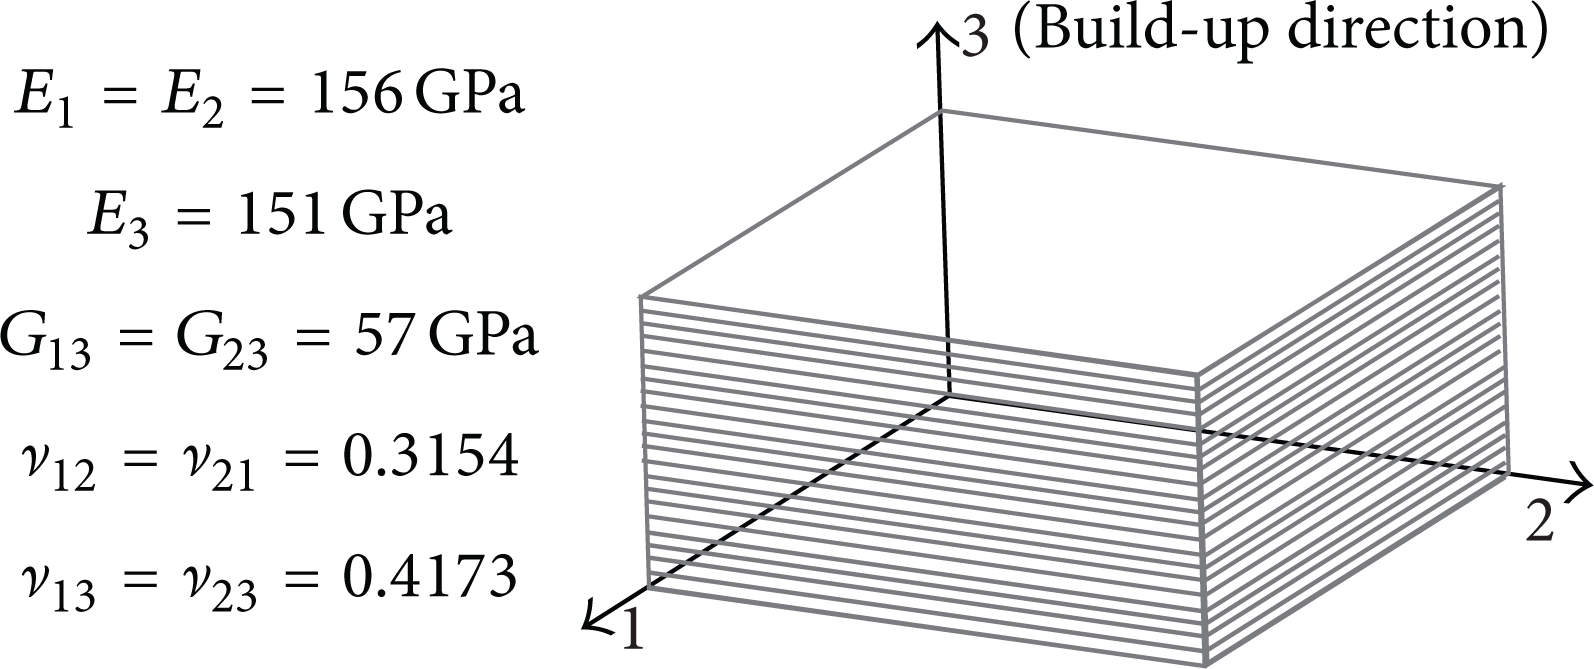
Elastic values for laser beam melted X3NiCoMoTi18-9-5 and definition of the spatial directions.
The differently coloured regions (annealing colour, shown in Figure 2) resulting from the production process were not shown to have any influence on the sites of fracture in the tensile or torsional specimens. Despite colour variations in the vertically orientated specimens, the fractures occurred, as expected, in the parallel part of the specimen, right in the middle.
5. Summary and Future Prospects
Specimens that were produced additively via laser beam melting were used to determine the build-up direction dependent elastic properties of the material in all three spatial directions based on tensile and torsion tests, and the transversely isotropic material model was validated for initial approximate calculations. Furthermore, the anisotropies of elastic limits and breaking points as demonstrated in previous studies were confirmed. Torsion values were also determined depending on build-up direction. Laser beam melted X3NiCoMoTi18-9-5 (hot-work tool steel) was shown to exhibit extremely high performance under shear loading in comparison to conventionally processed steel. The influence of build-up direction on torsional strength was also shown to be negligible. A first view with a scanning electron microscope shows no significant difference between vertical and horizontal build-up direction of dendritic solidified structures (Figure 10). In addition, detailed investigations in microstructure and grain size are planned to prove the theory depending on the orientations under these build-up boundary conditions.
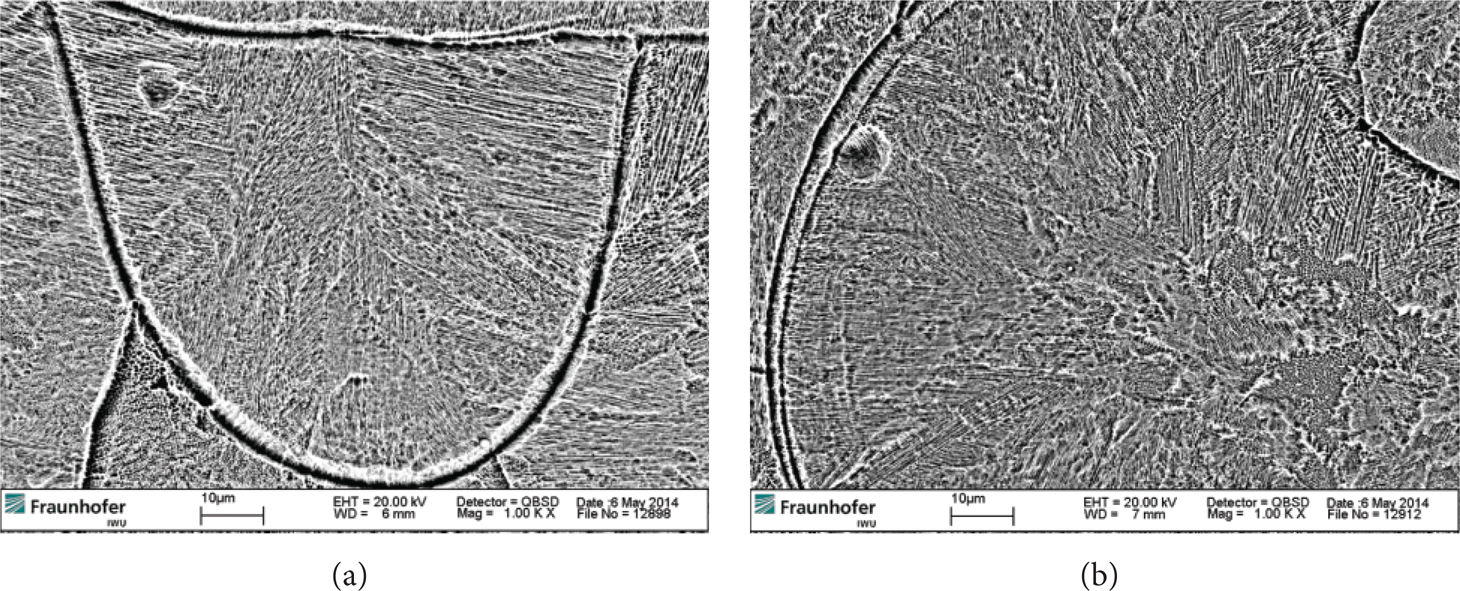
Micrograph horizontal viewing ((a) vertical axis corresponding to build-up direction) and downwards viewing ((b) horizontal layer).
Following these tests, FE (finite-element) mesh models of spur and helical gear teeth will be generated. The background is to send on the stiffness data for these numeric mesh models and consider variable transmission errors dependent on the angle of rotation, respectively, on the build-up orientations. Furthermore, tests using a gear test rig are scheduled. Reconciling the test results with reality will also require a study of whether the material-removal processes used to increase gear tooth quality, for example, profile grinding, reveal directionally dependent properties as part of the material-removal behaviour. At the same time, attempts will be made to qualify typical gear-tooth materials for laser beam melting.
Conflict of Interests
The authors declare that there is no conflict of interests regarding the publishing of this paper.