
Abstract
During a journey, motor vehicles are subjected to different types of irregularities in the pavement. Some of these irregularities are introduced for a specific purpose over a stretch of road to slow down the vehicle at certain road points. However, the influence of installed speed bumps reveals certain additional effects which must be deeply analyzed to ensure vehicle and pedestrian safety. In some cases, it has been found that even when driving over transverse bands at a speed below the legal limit, the vehicle is damaged or tires lose grip with the pavement, precluding any kind of braking or turning maneuvers. Such phenomena indicate that either this element is not properly sized or the location is not appropriate, becoming counterproductive for traffic safety. In order to analyze the influence of these irregularities on the different components of the vehicle and its occupants, a simulation program with MatlabTM has been developed. The validated developed tool takes into account several aspects of the vehicle dynamics, bump geometry, and vehicle speed. The proposed tool provides the best possible information to establish a set of guidelines for the proper design and installation of speed bumps in different roads.
1. Introduction
During daily traffic automobiles overcome different types of road irregularities. These can be random or built for a specific purpose [1, 2], such as transverse ridges or speed bumps. In order to analyze the effects generated by the overcoming of these irregularities on several systems of the vehicle and its occupants, a simulation computer tool has been developed. The development of this tool allows analyzing speed bumps, comparing the results with experimental data, and establishing a set of guidelines for correct speed bump design.
To predict the behavior of the vehicle when it overcomes speed bumps, it is necessary to study several parameters. The main variables to be analyzed are dimensions and geometry of the speed bump and speed and suspension of the vehicle.
Urban traffic speed has been controlled during the last years by means of the design of the streets to ensure compliance with the limits. This strategy for urban planning is defined as pacification of vehicular traffic and has two main aims: reducing the number and severity of traffic accidents and improving the local environment for people who live, work, or visit any area. The main objective is to decrease traffic flow, thus, reducing vehicle speed. Nowadays, to pacify or calm traffic a set of techniques, such as speed bumps, are currently being used.
If speed bumps are not correctly built or dimensioned damage of vehicle components, such as vehicle dampers, can greatly influence vehicle safety. However, this process of deterioration will depend on the speed at which the speed bumps are overcome. It is also a fact that, given the abuse of these devices and the need to repeatedly go over them, the rate of deterioration of these elements is very high, which poses a safety risk [3, 4]. Moreover, it should be noted that the steering and suspension are vehicle components that affect the stability and, ultimately, the vehicle active safety, thus, not being designed for the repetitive input of forces imposed by the speed bumps. Both the suspension and the steering are directly responsible for the comfort and driving safety. The road elements, in this case the speed bumps, may adversely affect the comfort, however, should not, in any way, affect traffic safety [5].
Despite the growing number of traffic retarder elements, and their apparent impact on vehicle dynamics, very little studies analyze their influence on road safety, passenger comfort, or deterioration of vehicles [6–13]. It must also be kept in mind that the number of vehicles with high center of gravity, such as vans, SUV, or off-road vehicles is particularly sensitive to speed bumps. It is therefore of great interest to characterize different types of speed bumps at different speeds and with different types of vehicles, analyzing its influence on the stability, comfort, and safety [14, 15].
On the other hand, there are many different solutions and technologies to achieve traffic calming by means of speed bumps. Active and passive bump devices can be found with different functions [16–19], but reliability and cost are important drawbacks in order to install them massively. From this point of view, the development of one simulation tool completely focused on this subject could be very useful for street design and study traffic calming alternatives.
Due to the limited length of this paper all results achieved in this research will not be displayed. However, the most important ones as well as those obtained from the proposed simulation tool will be presented within an exhaustive analysis of the obtained results.
2. Speed Bumps
The road sections passing through towns are traditionally considered as a nondifferentiated part of the rest of the road, to the point that sometimes the urban road is wider than the intercity road. This can lead to high speeds in the urban area, with the risk of accidents and loss of life quality for residents in their environment (noise, pollution, etc.). Several actions have often been taken to control the speed, such as traffic lights, transverse ridges or speed bumps. In many cases this strategy not only has not achieved its goal of improving traffic safety, but it has sometimes worsened traffic safety [20].
With the aim of improving road safety in these road sections, it is necessary to study the implementation of new actions, avoiding creating additional problems for vehicles and contributing to the proper speed of movement in urban sections. It is noteworthy that all the modifications to be introduced in a particular road section should be designed in order to get a moderate and uniformly speed throughout the road [21, 22], avoiding that any of the installed items can lead to abrupt maneuvers because in some cases the drivers cannot perceive these devices in advance [23, 24].
Among the available actions within the urban roads, the so-called speed bumps are considered, whose advantages can be mentioned as follows:
effective reduction in cruise speed,
identification and protection of pedestrian crossings.
The first objective, speed reduction, is directly related to noise emission, but the influence in this aspect is another research field [25].
The speed bump considered in this study is a device designed to promote keeping moderate speeds in urban areas, and their longitudinal profile is circular.
The effectiveness of these devices is supported by its widespread usage in many countries. However, in some cases it has had the opposite effect than expected, so it is necessary to define the required features in order to be able to achieve the desired results.
In many cases, these elements are prefabricated and their geometry and dimensions are strictly controlled. The speed bump is made of a set of modules, each one of them with the same length and height. These modules usually have a curved top section and a flat bottom side that is fixed to the road pavement, by means of screws. The modules are arranged in a row, resulting in transverse bands on the track. The dimensions of these items will range from 30 to 90 centimeters wide, 3 to 10 centimeters high, and 30 to 100 centimeters long. In no case bands were made of the combination of modules of different widths or heights and must be correctly identified. The speed bump must be clearly identified by its color and reflectance and should be readily visible to the driver approaching the point at which they are fixed.
These devices have been chosen to analyze the effect of speed bumps because of the easy control of their design and installation. Furthermore, they can be directly used as a reference to improve speed bump design.
3. Bump Modeling
In order to analyze the effect of a bump on a vehicle and passengers a software tool has been created [26]. The first step to develop such tool is to model the bump geometry so as to generalize it for any other bump [27], based on two basic inputs: the length of the bump (L) and the height of the bump (H), as depicted in Figure 1. A premanufactured bump has been selected to model the bump geometry.

Bump modeling.
Attending to bump regulations the bump must be part of a circle. On one hand;

On the other hand,

Equaling both equations,
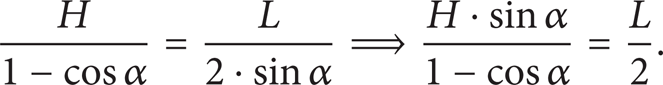
Substituting the sin α,

Operating,
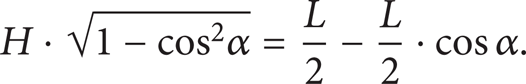
Operating and reorganizing terms,
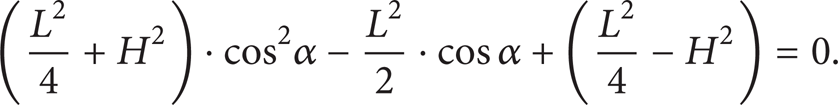
Finally, making the following change of variable x = cos α we have

For a given height (H) and length (L) of the bump, angle α used to define the bump geometry is obtained by solving

Once angle α is found, the radius of the bump circle is calculated either in terms of the bump length (L)

or in terms of the height of the bump (H)

yielding the same result.
However, in order to completely define the bump geometry the exact horizontal and vertical coordinates of a discrete set of points of the bump are needed. Given that the bump has a symmetric geometry with respect to its central axis, the left side of the bump has been discretized as follows (depicted in Figure 2).

Discretization of the bump.
The aim of this discretization is to find pair values of time (t) and vertical displacement (y) for each of the points, when the vehicle is travelling at a constant speed (v(m/s)). For the previous example of discretization time is computed as

And the vertical coordinate is obtained as

The bump discretization has been implemented in a Simulink file, shown in Figure 3, in which the user can introduce the bump parameters as well as the number of discretization points for the left hand side of the bump geometry (N), the length of the bump (L), the height of the bump (H), and the vehicle speed (v).

Tool to generate any bump geometry based on a circle bump.
4. Description of the Vehicle Model
In order to analyze the vehicle and passenger behavior under a bump a vehicle model must be implemented. Neglecting lateral external forces and lateral weight load transfer the vehicle dynamics is reduced to the vertical component. It is assumed that the bump is driving on a straight. In addition, the bump is assumed to have the same cross section along the road width and therefore no lateral movements have to be considered. A half vehicle model has been selected in order to model the vehicle vertical dynamics [28–31]. This model clearly describes the complete vertical motion of the vehicle while running through a bump. The model has four degrees of freedom, depicted in Figure 4.

Vehicle model.
The four degrees of freedom are the acceleration of the sprung mass, the pitch angle, the front unsprung mass acceleration, and the rear unsprung mass acceleration.
The sprung mass motion is represented as follows:

where
m s : sprung mass (kg),
z s : vertical displacement of the vehicle centre of gravity (m),
k1f: front vertical suspension stiffness (N/m),
l f : distance between the front axle and the vehicle centre of gravity (m),
zuf: vertical displacement of the front unsprung mass (m),
csf: damping coefficient of the front suspension (N·s/m),
θ: vehicle pitch (rad),
k1r: rear vertical suspension stiffness (N/m),
l r : distance between the rear axle and the vehicle centre of gravity (m),
c sr : damping coefficient of the rear suspension (N·s/m),
zur: vertical displacement of the rear unsprung mass (m),
J y : moment of inertia.
And the unsprung mass motion is represented by the following set of equations:

where
muf: front unsprung mass (kg),
k2f: front tire vertical stiffness (N/m),
z rf : front vertical displacement of pavement (m),
mur: rear unsprung mass (kg),
k2r: rear tire vertical stiffness (N/m),
z rr : rear vertical displacement of pavement (m).
The vehicle model has been programmed in Simulink, as shown in Figure 5.
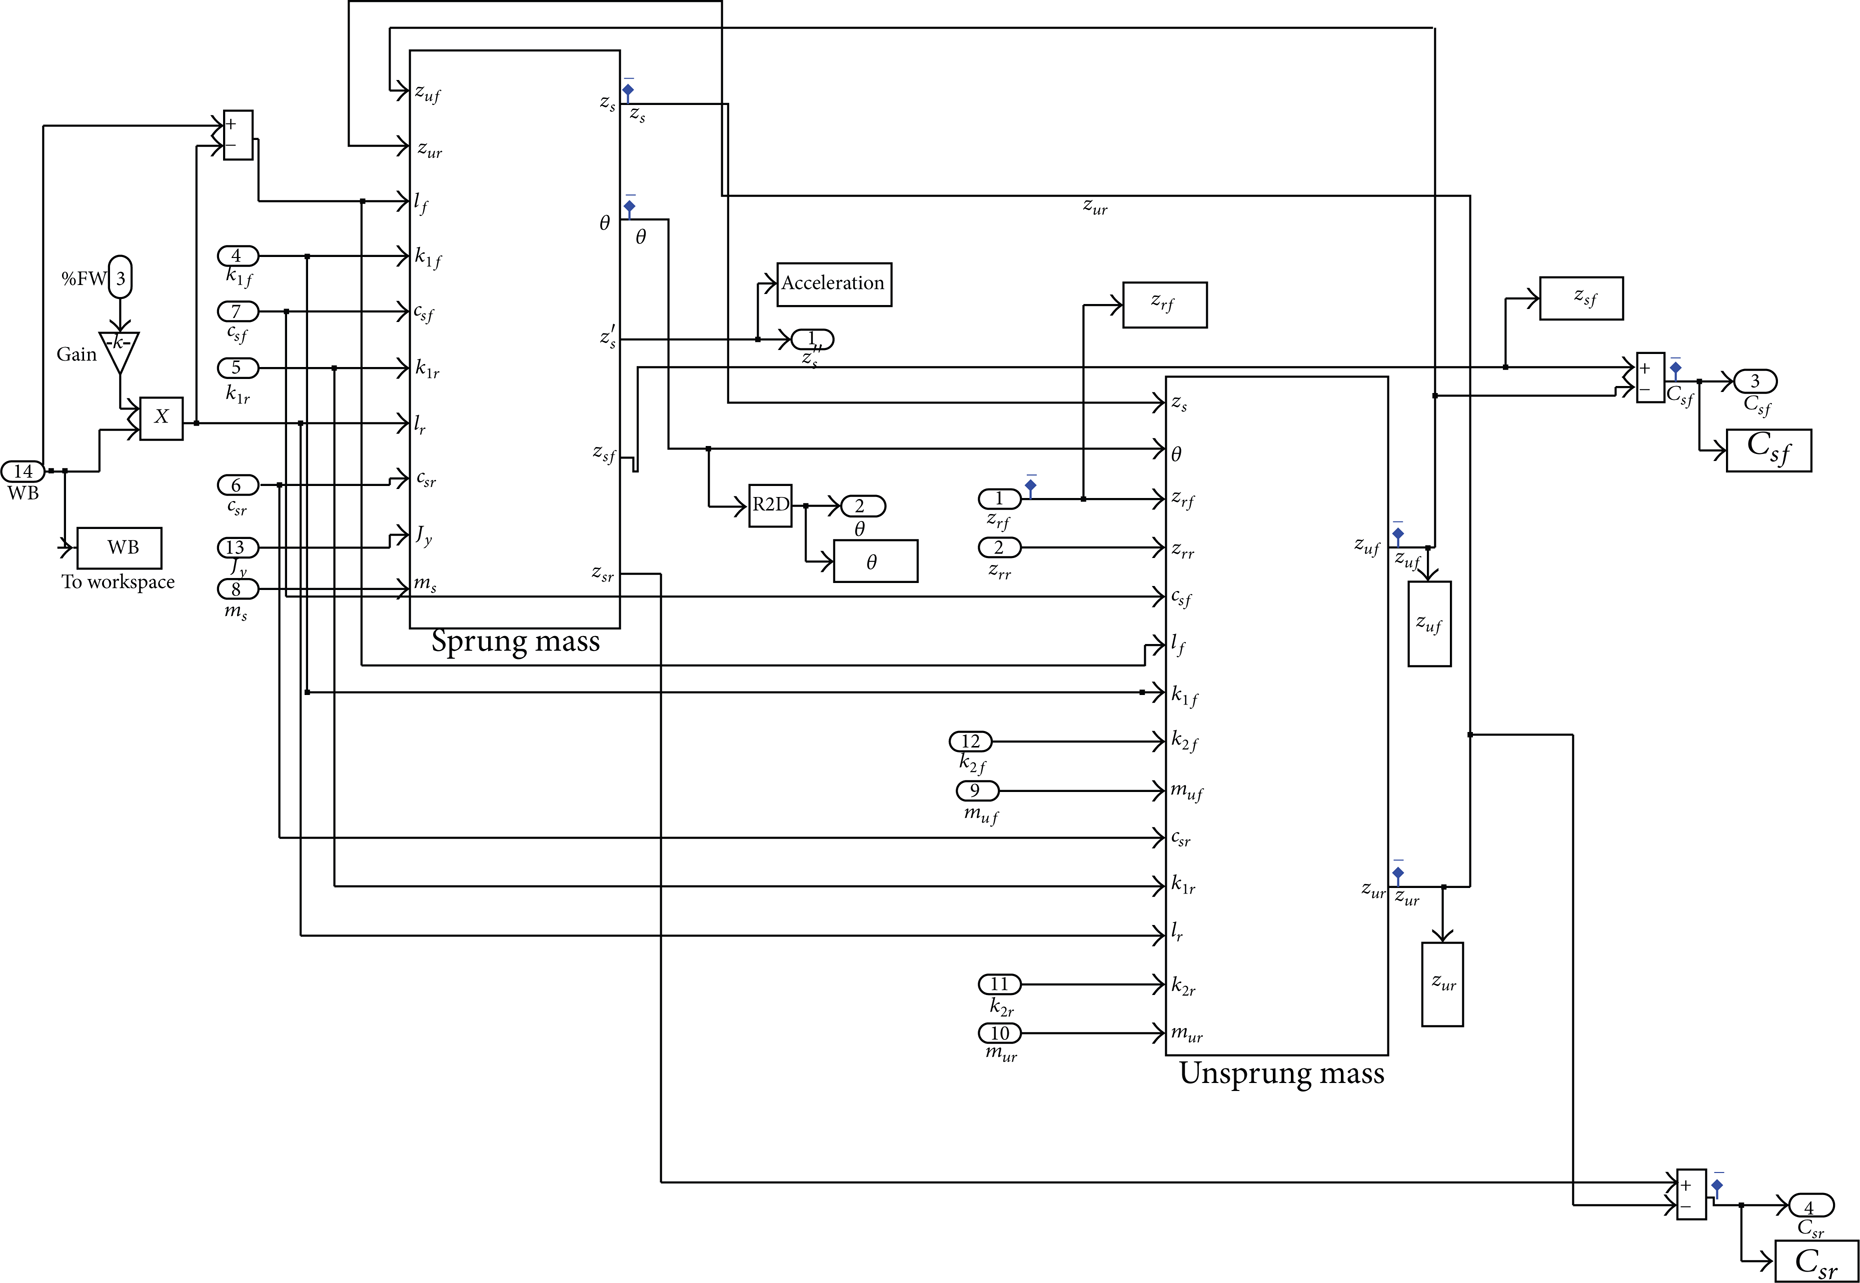
Vehicle model in SIMULINK.
5. Description of the Graphical User Interface
A graphical user interface (GUI) has been designed in Matlab, shown in Figure 6, in order to compare different case studies.

Graphical user interface (GUI) for bump analysis.
In the first place, the GUI allows the user to specify the vehicle category (view arrow 1) in order to generate the vehicle model. For each vehicle category the GUI automatically introduces the mean values of the main vehicle parameters. However, the developed GUI not only provides predefined vehicle parameters for vehicle categories A, C, D, and E, but it allows the user to define any vehicle parameter for a specific car that does not belong to the mentioned vehicle categories. In Table 1, the different vehicle models of the pre-defined categories between which the user can select are shown.
Values of the different tested vehicle segments.
Once the vehicle parameters are set the user can specify the bump over which the vehicle will drive through (view arrow 2 in Figure 6). To specify the bump the user will provide the length of the bump and the height. In addition, the vehicle speed will be given.
As an example, a bump of 4 m long and 6 cm tall has been selected from the regulations, as depicted in Figure 7. This bump is for roads with a maximum travelling speed of 50 km/h. The following circle geometry was found for the selected bump.

Results for a vehicle of category C yielded by the developed GUI.
The GUI calls the Simulink model to create the bump and to simulate the vehicle vertical dynamics with the parameter values given by the user. Once the model is calculated results are plotted by clicking on “Plot.” For vehicle category C and the previous bump the results for vertical acceleration (m/s2), pitch angle (deg), front suspension compression (m), and rear suspension compression (m) are depicted in Figure 8.
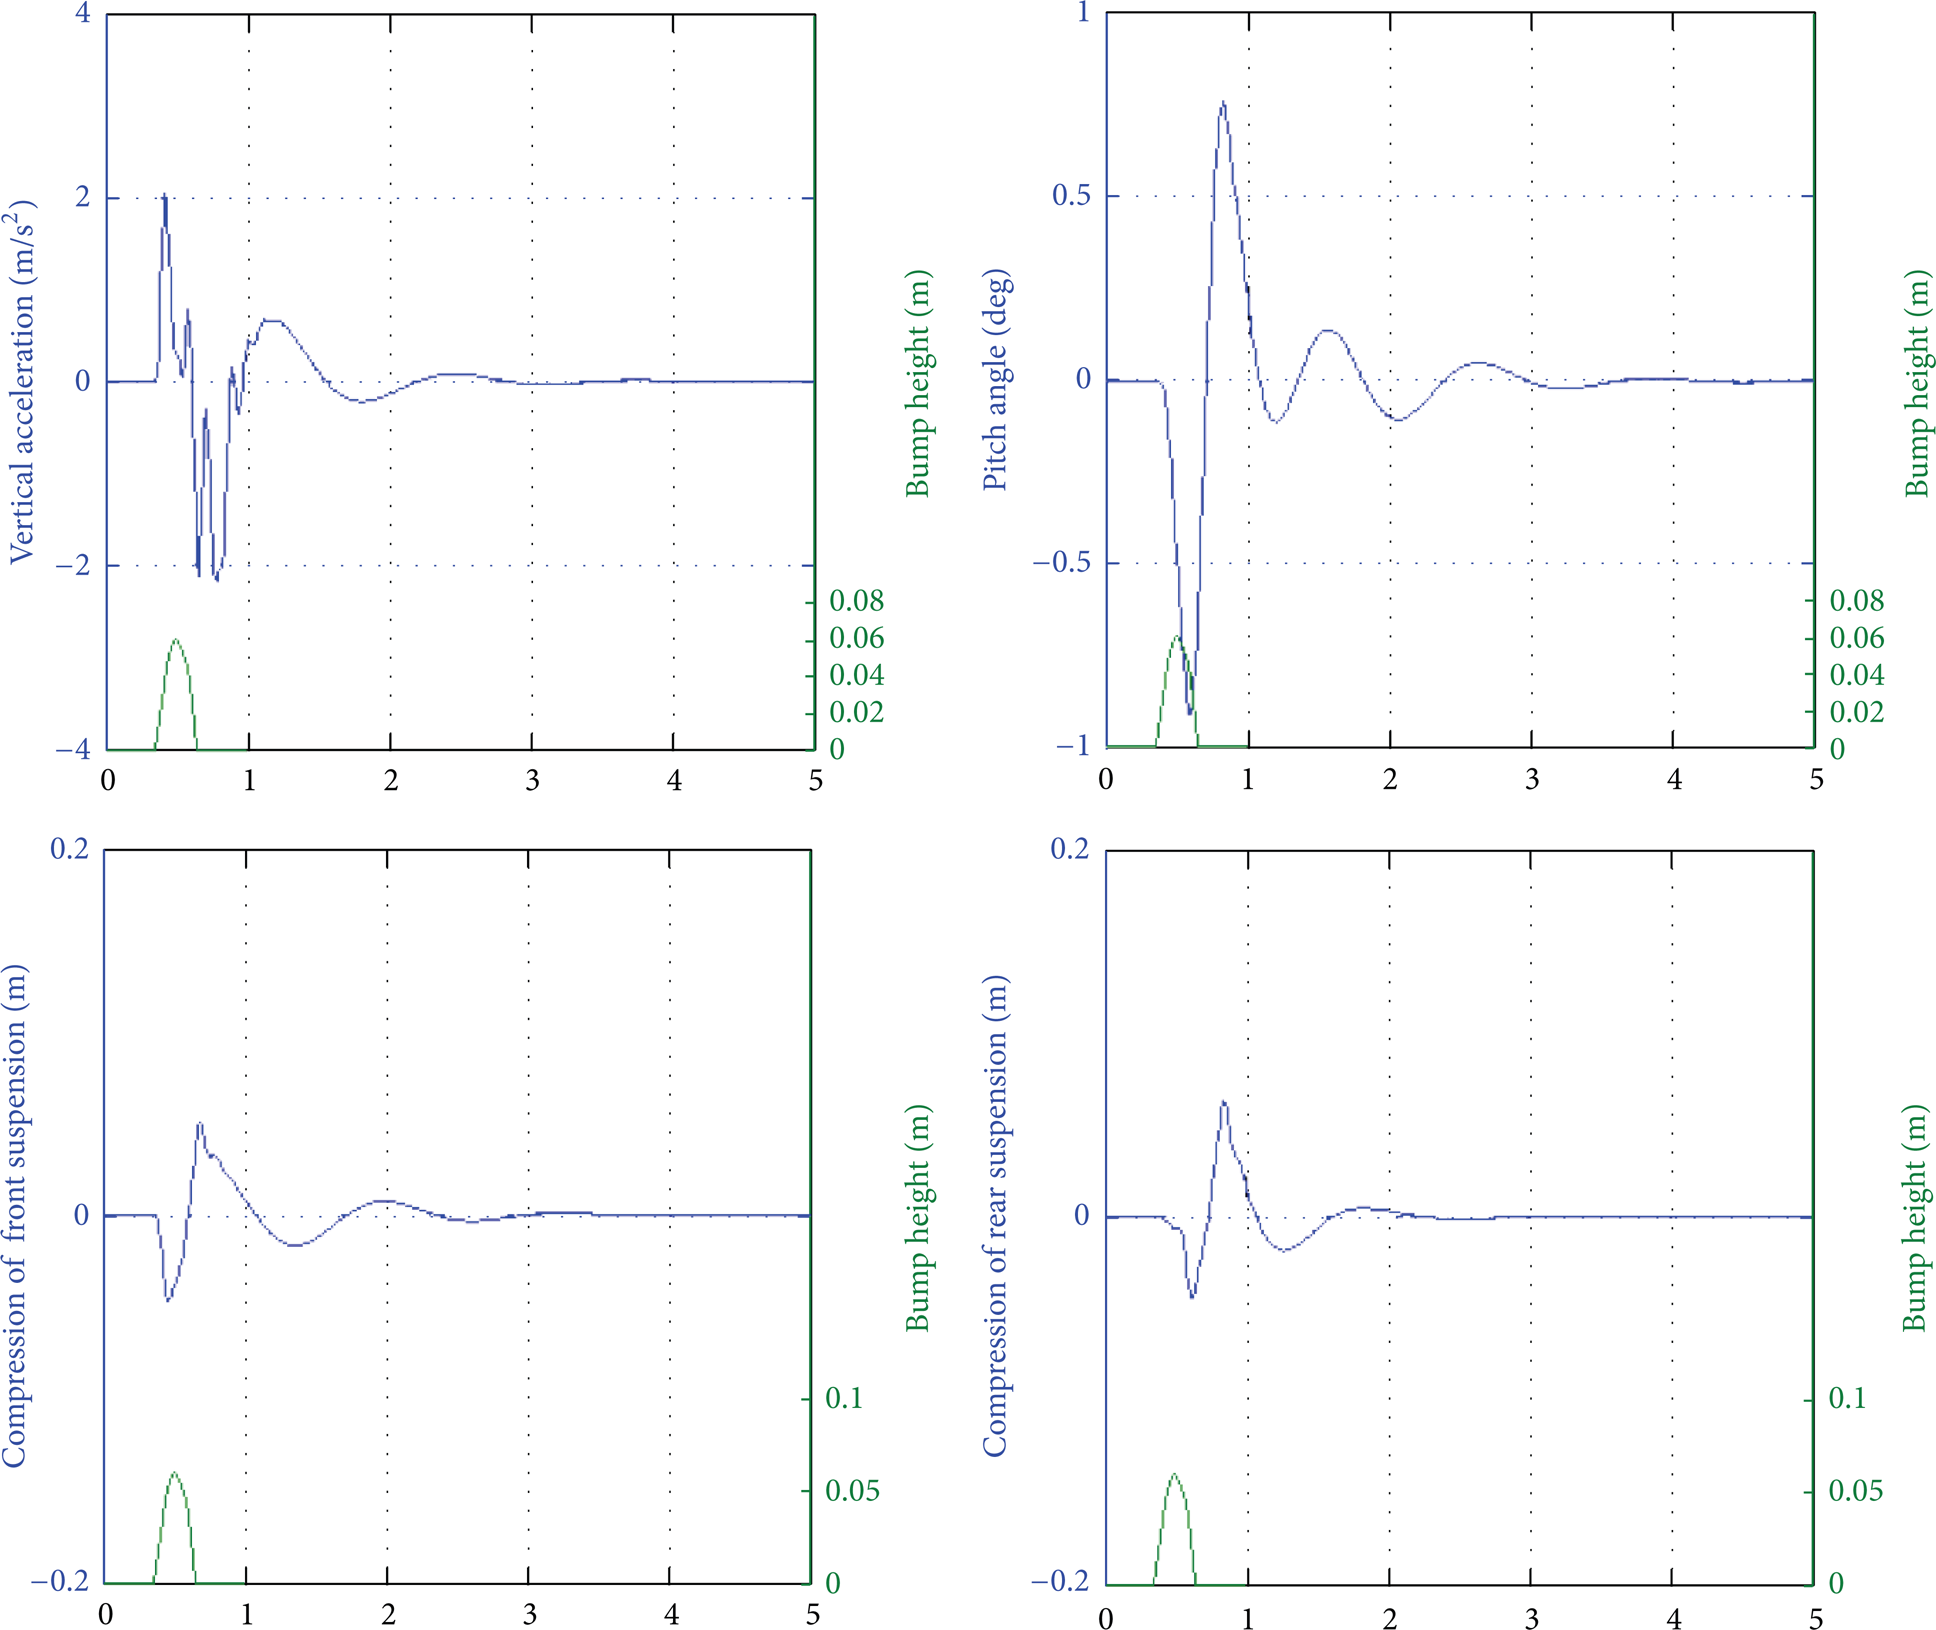
Vertical dynamics results for vehicle category C.
In addition, below each of the curves, the bump geometry is also shown. This representation of the results helps to understand the meaning of the maximum and minimum values of each of these parameters. For example, the maximum vertical acceleration is found at the first half of the bump due to the impact of the wheel against it. For vehicle category C the maximum vertical acceleration is 2 m/s2, the maximum pitch angle is 0.7 degrees, the maximum compression of the front suspension is 0.05 m, and the maximum value of the compression of the rear suspension is 0.06 m. Simulation for the rest of vehicles has been performed and results are shown in Table 2.
Maximum values for each vehicle category.

The designed GUI not only allows finding the vertical dynamic vehicle behavior but also a sensitivity analysis. From Table 2 it can be seen the most comfortable vehicle is the one corresponding to vehicle category C, as its maximum vertical acceleration is the lowest. In addition, the maximum pitch angle is smaller than larger vehicles.
6. Validation by Experimental Results
In order to carry out an initial validation, previous to the full validation process by comparison with experimental results from several vehicles, a segment D vehicle has been used. This vehicle was used in previous studies [31, 32] for experimental test with different bumps and velocities (Figure 9); these allowed checking the results and expand the information obtained by simulation.
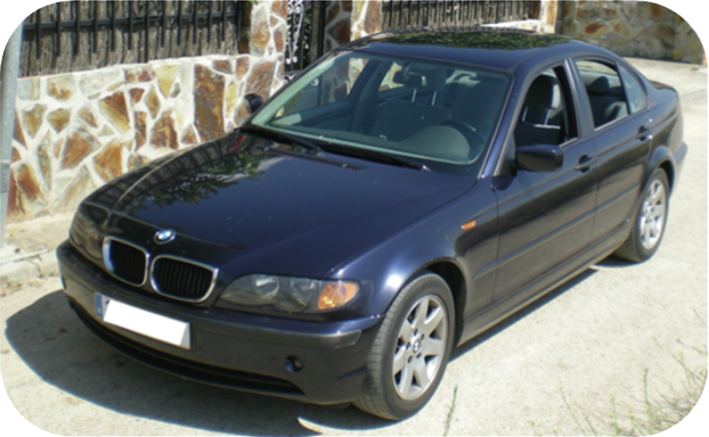
Tested vehicle.
The experimental results provided the vertical acceleration, which allowed comparing and validating the results obtained with the proposed simulation tool. In addition, the vertical acceleration provides a subjective evaluation (feeling of comfort of the driver and passengers) of the speed bumps analyzed. This aspect will be analyzed specifically in the full validation in order to improve the information reached by means of this tool. Thus, this is an important tool for taking design decisions, since the speed bumps are designed to reduce the speed when they are seen, and that reaction depends on the feeling that each type of speed bump transmits to us.
For the experimental measurements accelerometers were placed approximately at the center of gravity of the vehicle, as depicted in Figure 10.

Accelerometers placed near the centre of gravity of the vehicle and the data acquisition system.
As depicted in Figure 11, example of the set of tests, experimental results are quite similar to the simulation. It must be taken into account that the road provides a roughness, thus introducing “noise.” However, the main studied parameters (number of peaks and amplitude) in vertical acceleration signal are almost equal. This additional information allows checking if it is necessary to change any parameter in the simulated model, and the experimental results have validated the results shown in this paper.
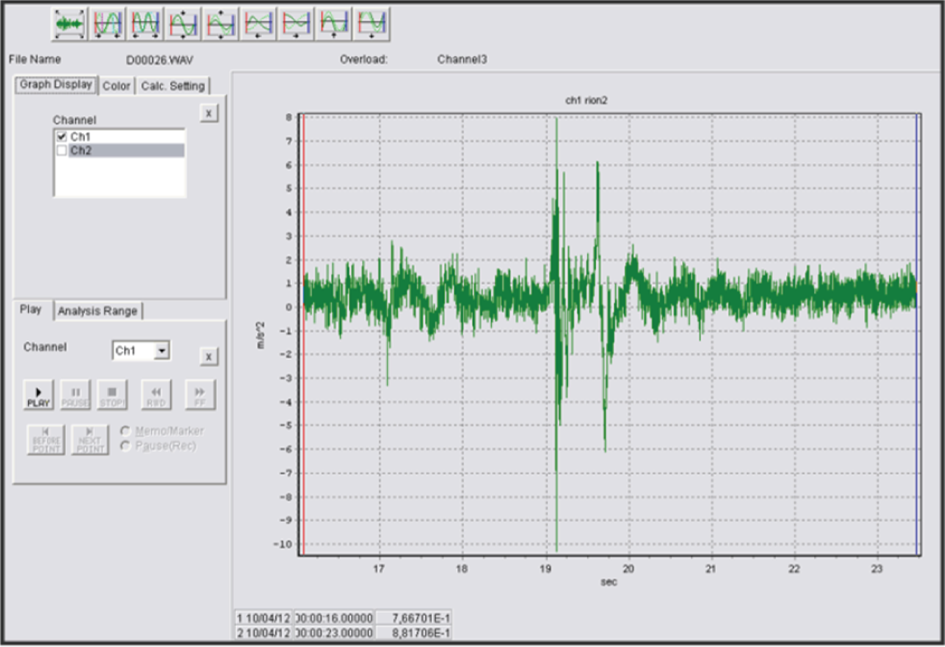
Main screen of acquisition data equipment. Vertical acceleration at 30 km/h for speed bump 10 × 90.
The maximum vertical acceleration registered at 30 km/h for speed bump 10 × 90, as depicted in Figure 11, is around 8 m/s2 (the filtered value is 7.1 m/s2), and six peaks due to the front suspension and four peaks due to the rear suspension can be identified. Finally, the signal is completely damped.
Tests were also performed with the bumps and speeds indicated in Table 3, showing similar results. They all met the same number of peaks (before they were completely damped) and amplitude variations are lower than 8% (once the signal has been filtered). Thus, it can be considered as representative information obtained through the proposed simulation tool. In Figure 12, results of the vertical acceleration for bump 10 × 90 are shown. Comparison of experimental results, shown in Figure 11, and the ones yielded by the proposed GUI, depicted in Figure 12, is very close, not only in magnitude but in shape and trend.
Comparison of vertical acceleration for different bumps and speeds.


Results from the developed software for bump 10 × 90.
A comparison for different bump geometries and speeds has been done to validate the proposed tool and in order to analyze the influence of bump and vehicle parameters in vertical acceleration. Table 3 shows the obtained results as well as a comparison with experimental testing. It can be seen that the proposed tool is validated.
From the results shown in Table 3 it can be found that vertical acceleration does not increase with vehicle speed for the same bump geometry. It must be taken into account that vertical acceleration is measured in the centre of gravity. In addition, for the same bump geometry vertical acceleration is influenced, between other parameters, by the instant of time in which the rear axle enters the bump. Therefore, for the analyzed bumps when the vehicle travels faster the longitudinal movement prevails over the vertical one. Finally, it can be noted that for the same speed and for the last two bumps (5 × 60 and 7 × 60), as expected, vertical acceleration is bigger for bump 7 × 60 because it is higher than bump 5 × 60. The proposed tool allows analysis of vehicle parameters and bump geometry on vertical dynamics.
7. Conclusions
This paper presented a model of a bump and software to predict vehicle vertical dynamics for different vehicles and bump geometries. The authors have developed a general model of a parametric bump with circular geometry in order to perform different analysis for any circular cross section bump. In addition, the proposed bump model allows discretization of the bump in order to refine the developed model. The bump model has been implemented in MatLab. By means of Simulink a half vehicle model has also been developed. A graphical user interface (GUI) has been developed in order to be able to simulate any type of circular bump and any type of vehicle. Standard vehicle categories, with their vehicle main technical features, have been preloaded. Thus, the user must first introduce the bump geometry and generate it. Next, either the vehicle parameters are manually introduced or the user selects a pre-defined vehicle category, in order to create the vehicle model. Finally, the developed GUI shows as result the main variables of analysis:
maximum vertical acceleration,
maximum pitch angle,
maximum compression of front suspension,
maximum compression of rear suspension.
In order to validate the proposed bump model and developed GUI, results were compared with experimental ones. The comparison has shown differences in vertical acceleration lower than 8%; the other variables will be tested in the final process of validation. The developed tool shows that there is a cross influence between vehicle and bump parameters, thus being necessary the developed tool. The validation of the bump model and GUI has proved to be a successful tool in order to predict vehicle vertical dynamics and guarantee sufficient accuracy to allow beginning a systematic study for establishing a set of guidelines for the use and design of speed bumps.
Conflict of Interests
The authors declare that there is no conflict of interests regarding the publication of this paper.