
Abstract
Bidirectional pump holds great promise in a wide range of applications since it could realize the function of drainage and irrigation simultaneously. A bidirectional pump with high specific speed was designed and 10 groups of performance tests, under different setting angles, including both positive and negative directions, were conducted. Numerical simulations were then performed to analyze the variation principle of internal pressure pulsation in flow passage and both the front and the back sides of the blade and guide vane. Results show that the optimum operation point was shifted and the performance declined under reverse operation. The maximum pressure pulsation amplitude occurred to the vicinity of the blade's inlet edge under both positive and negative operations. The main pulsation frequency was the blade passing frequency while it was four times of shaft rotation frequency in the rotatory zone, which was equal to the number of guide vanes. The guide vane has a significant effect on the pressure pulsation variation. The pulsation amplitude had a higher value while the pump was in its negative operation rather than positive. These results could provide valuable insight for reducing the pressure amplitudes in the bidirectional pump.
1. Introduction
Many pump stations need to operate bidirectionally to meet the demand for both drainage and irrigation simultaneously, especially in low head pumping stations like those along river, lake, and sea. Basically, there are three main ways, including direct reverse of impeller rotation direction, impeller 180′ rotation besides guide vanes switching, and what is more, using special arrangement of the flow channel, to achieve this purpose. Bidirectional pump considered here uses special leaf and achieves reverse pumping just by changing the rotation direction of the motor. Its advantage is in simple operation, fast response for changing direction of rotation as well as approximately equal efficiency in case of positive, and reverse rotation. However, positive operation efficiency would decline compared with the common axial-flow pump [1]. Due to the poor hydrodynamic performances of bidirectional airfoil and reversed guide vane, bidirectional pump would produce a large amount of vibration and noise under operation. Pressure pulsation is one of the key factors to cause unstable operation of pump station; hence the investigation of pressure pulsation has some practical significance for stable operation of the bidirectional pump station [2–4].
Experimental measurements and numerical simulations of pressure pulsation on hydraulic machinery have been carried out recently. Chirag et al. [5] found that there was a 0.85% difference between experimental and numerical result of efficiencies at the best efficiency point for a high head Francis turbine and the interaction between the rotor and stator resulted in an output torque oscillation over a particular power generation range. Pavesi et al. [6] experimentally analyzed the unsteady phenomena in a centrifugal pump with a vaneless diffuser; it was shown that there was an asymmetrical rotating pressure distribution at the impeller discharge and spread both in the radial and in the circumferential directions. Spence and Amaral-Teixeira [7] investigated the pressure pulsation in a centrifugal pump using numerical and experimental methods. It was concluded that CFD results can reasonably reflect the pressure pulsation changes for different geometrical arrangements. Zhang et al. [8] used RNG k -ε turbulence model and SIMPLEC algorithm to simulate unsteady turbulent flow in axial-flow pump and systematically analyzed pressure pulsation variation in the inner flow field.
Bidirectional pump always used symmetrical S-shaped airfoil; it also can be acquired by calculating forward and reverse bone line, respectively, with singularity distribution method and then superpose the two bone lines and thicken them. For fan, the method of reducing the camber of airfoil was used to improve the reverse performance as well. At present, research on high specific speed bidirectional pump was relatively rare and mainly concentrated on the analysis of inner flow field and the experiment of device performances [9–11]. Cheng et al. [9] carried out the positive and negative system performance test for the pump with the same pressure surface and suction surface and then analyzed the inner flow characteristics through numerical simulation. Wang et al. [10] investigated the cavitation performance of S-shaped airfoil bidirectional pump by comparing it to common axial-flow pump; the results showed that S-shaped airfoil bidirectional pump has a better cavitation property.
Overall, the pressure pulsation study about pump was common, but mainly for conventional pumps like centrifugal, axial-flow pumps, and the investigation of pressure pulsation about bidirectional pump especially under reverse operation was rare [12–15]. This paper considers a high specific speed pump which the authors have designed and improved by numerical simulation results. The performance parameters were obtained by the tests under 10 installation angles in both positive and reverse operations. After a verification for numerical simulation method by comparing the numerical and experimental results of energy performance, a comprehensive numerical analysis was carried out to investigate the pressure pulsation on the flow channel, front and back side of blade, and guide vane. However, the measurements for pressure pulsation were not performed due to the current experiment equipment limitation.
2. Modeling
2.1. Hydraulic Design
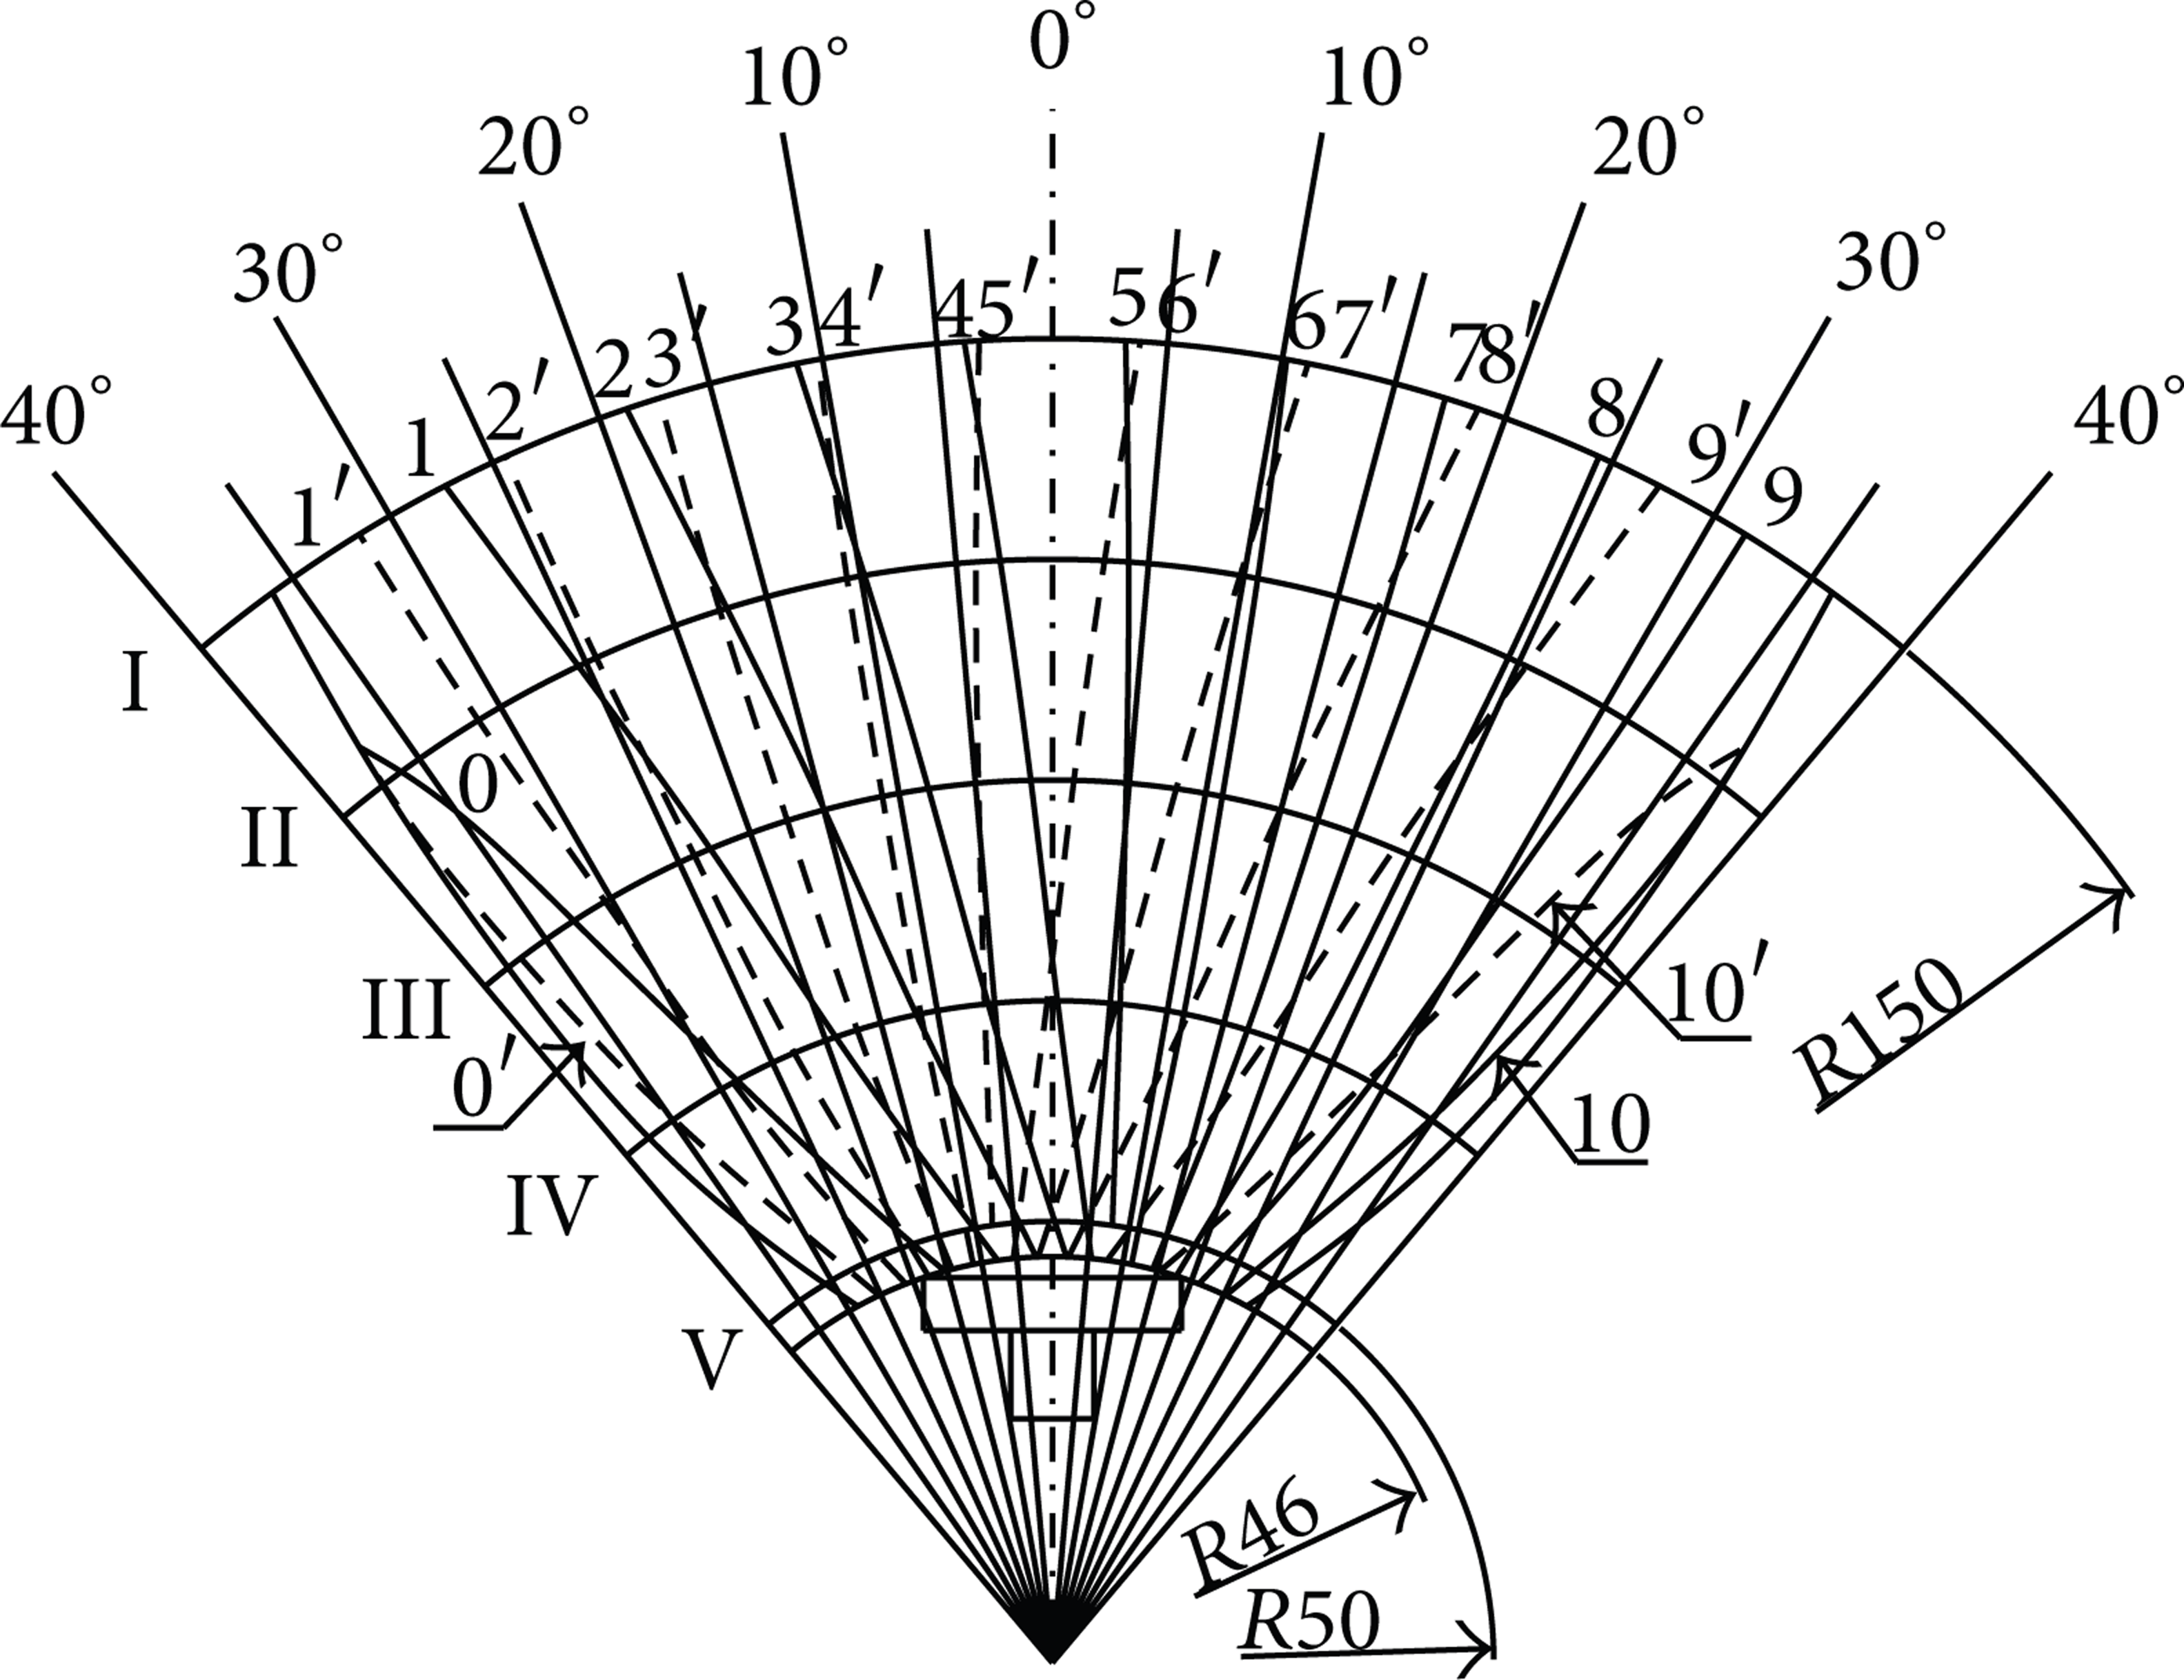
Lifting design method and streamline method [1, 16] were applied in the initial hydraulic designing of axial impeller and guide vane, respectively, and S-shaped airfoil was chosen (see Figure 3). The flow field was solved through free vortex pattern and outlet circulation was then corrected. After obtaining the flow field distribution, the flow angles can be determined at each airfoil section. According to the basic equation of energy conversion for axial flow pump, the cascade solidities and incidence angles at each section were determined, and then the original design was finished. Numerical simulation method was used to predict the performance of the pump; after that, the original model was improved continually through adjusting structure parameters till the numerical results can meet the requirement. The main requirement contained the specific speed and energy performance parameters for the pump, and a portion of parameters were shown in Table 1. Figure 1 shows the form drawing of blade.
Main parameters of bi-direction pump.

The form drawing of blade.
2.2. Performance Tests on Different Setting Angles
The experimental pump was manufactured according to the form drawing of blade and guide vane. Figure 2 shows the assembly drawing and the location of monitoring points for pressure pulsation. Bidirectional pump performance tests were done in the pump test-bed that meets the 1 grade precision of national standards GB/T3216-2005 (see Figure 5). The pressure difference between inlet and outlet was tested by U-type pressure monitor because of its high specific speed and low head. The experiment tested the performance of positive and negative operation at 5 angles including −4°, −2°, 0°, 2°, and 4°.
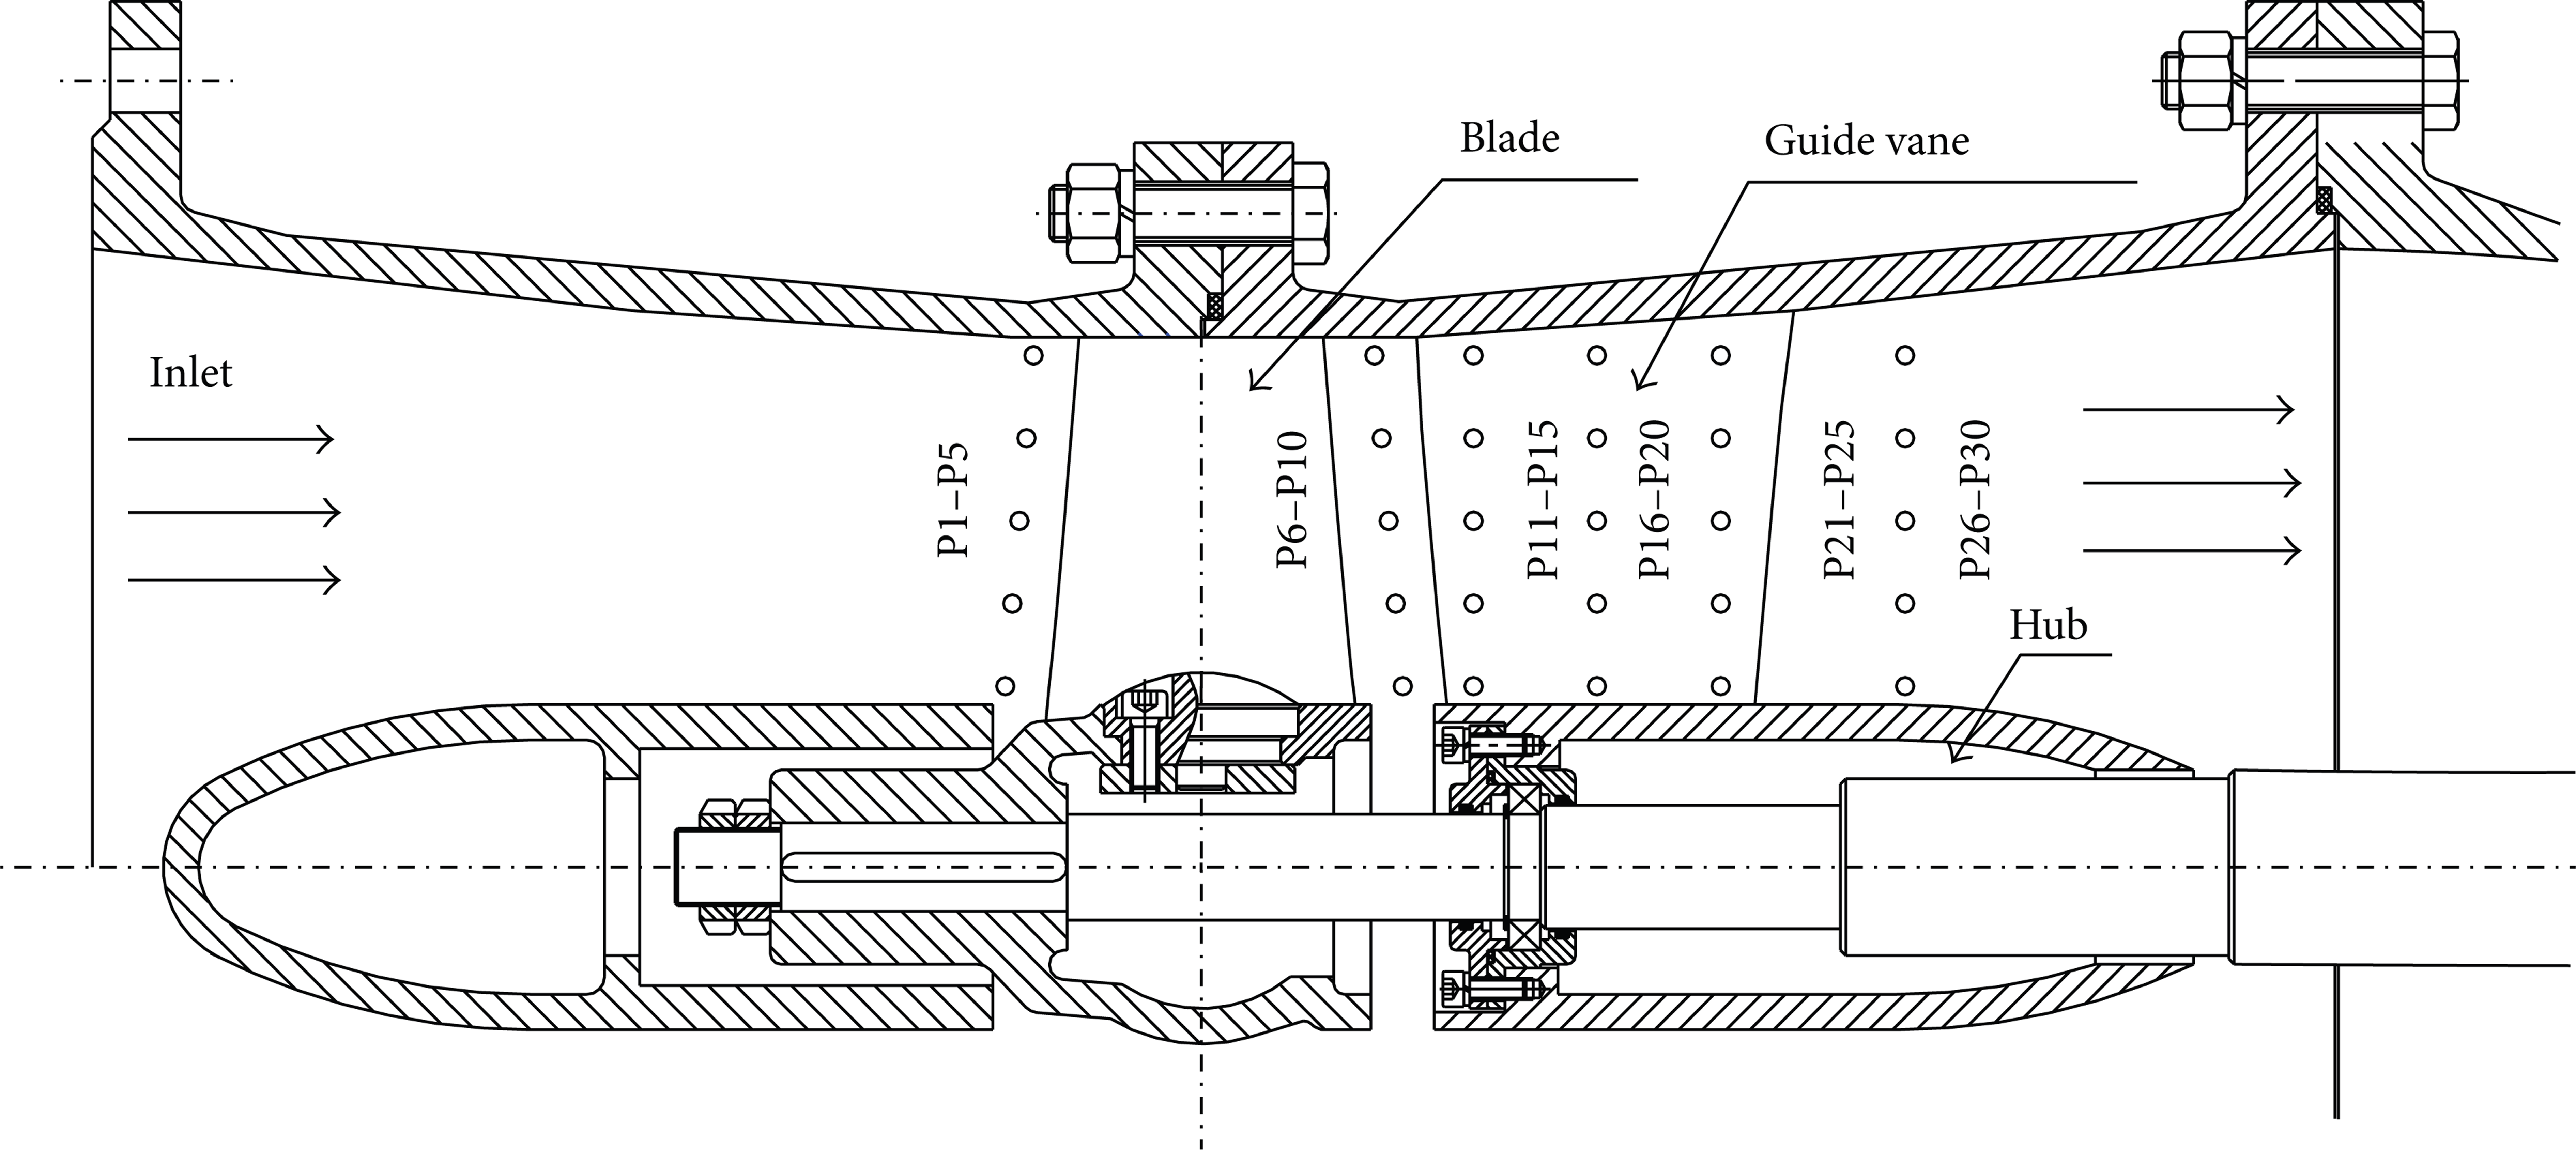
The assembly drawing and the monitoring points in flow passage.
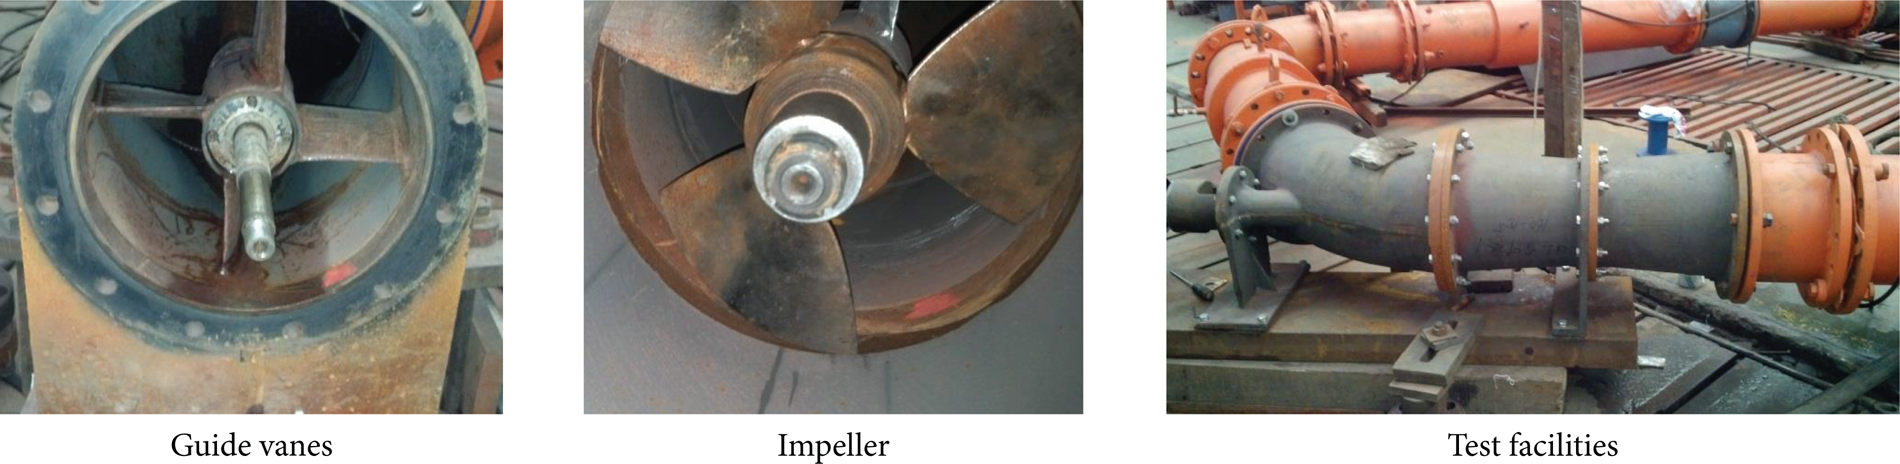
The models of impeller, guide vane, and test facilities.
Figure 4 shows the integrated performances curves at each setting angles. It was found that the H-Q curves were substantially parallel, and the variation trend of constant efficiency curves was consistent; the high efficiency area was near the 2° setting angle in positive operation, and it was near −4° setting angle in reverse operation; when setting angle was less than −4° degree, the maximum efficiency was likely to increase in reverse operation.

Integrated performance curves.

The components of bidirectional pump.
3. Numerical Simulations
3.1. Steady Calculation
In order to solve the inner flow field of the bidirectional pump, the standard k-ε turbulence model was chosen for calculation. Then the closed equations were constituted by Reynolds time-average equation, continuity equation, k equation, and ε equation. The flow of near-wall region was tracked with no-slip boundary condition and the standard wall function. The boundary conditions of inlet and outlet were velocity inlet and outflow. The pump performance curves were obtained by performing simulations with different inlet velocities, that is, different flow rates.
It was found that the position of coupling surface between the rotating and stationary domains has a significant impact on the calculated results. When the coupling surface was close to the blades, the numerical simulation results approached to experimental results. However, the quality of grid became low in this case. Meanwhile, there was a better calculation accuracy while the coupling surface was parallel to the revolution surface of inlet and outlet edge of the blades. As shown in Figure 6, the coupling surface is the surface that translates the revolution surface of inlet and outlet edge of blades 3 mm along rotation axis in this research.
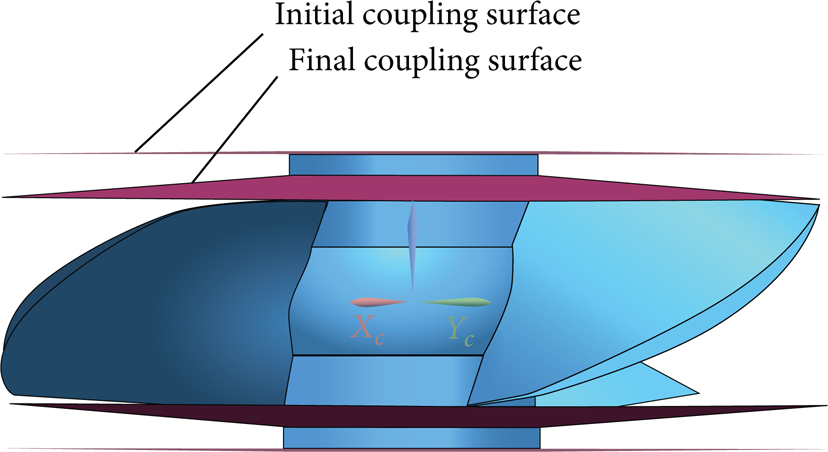
Position of coupling surfaces between the rotating and stationary domains.
3.2. Grid Independence Test
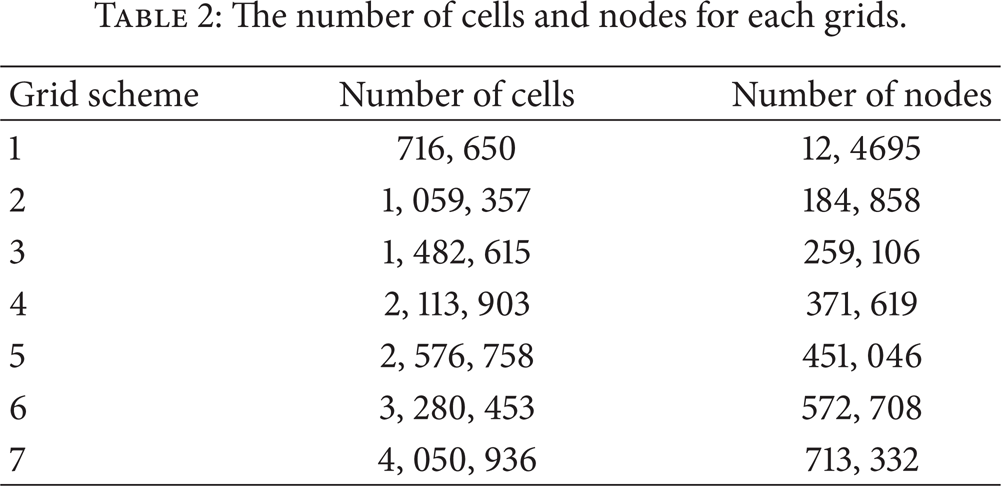
It was found that the grid number would influence the calculation results of CFD [17, 18]. Therefore, in this paper 7 different grids were used for grid independence analysis; the number of cells and nodes in each grid are listed in Table 2. Figure 7 showed the calculation results of head under high flow rate (1.1Q), design flow rate, and low flow rate (0.8Q). It can be seen that the calculation results of head under each operating points reduced firstly and then tend to be stable as the grid number increased; there were small differences of calculation results between each grid scheme, and when cell numbers were approximately greater than 3,250,000, the calculation results of head become stable. The seventh grid scheme was chosen for subsequent numerical calculations in this paper.
The number of cells and nodes for each grids.

Dependence of pump head on number of cells.
3.3. Unsteady Calculation
The unsteady simulations were carried out on the basis of the steady convergent results; the time step was chosen as 3.4483 × 10⁻⁴ s which equals the time that blade rotated for 3 degrees. In optimum operating point, the simulation converged to a stable solution after 2 revolutions of the rotor, while it was 4 in large and low flow rate. This research took the results of last revolution for analyzing.
In order to conduct a comprehensive analysis of the pressure pulsation in flow field of the bidirectional pump, totally 130 monitoring points were set of that distributed in flow channel, blade, and guide vane. The positions of monitoring points in flow channel, blade, and guide vane are shown in Figures 2, 9, 18, and 21. The monitoring points on the back side of blade and guide vane were corresponded with those in front. The points in flow channel can be obtained by creating points directly in Fluent software. Nonetheless, this method was not fit for the blade and guide vane's points as the blade was in motion, and the points may deviate the surface of blade and guide vane if the points were created through inputting their coordinate values directly. Therefore, the pressure pulsation in the blade and vane was acquired through creating small surfaces on corresponding positions and then monitored the average pressure of those surfaces; the small monitoring surfaces are shown in Figure 10.
4. Comparison of Performance Curves
The performance curves of positive and reverse operation under 0° setting angle were chosen for analysis since there was a similar variation law between each angle. As shown in Figure 11, the experimental results of the head were higher than the numerical results under low flow rate, while it became opposite in large flow rates. The highest efficiency calculated from simulation results was 66.85% under positive operations, which was 0.15% higher than the experimental result. In reverse operation, simulation result of highest efficiency was 4.92% higher than that of experimental result. The optimum operating condition acquired from simulation results were deviate to large flow rate in both positive and reverse operations, and the reason may be that the computational model was a simplification of the real pump and the mechanical efficiency was ignored. Overall, there was a same trend between numerical results and experimental results.
In reverse operation, the head decreased significantly compared with positive operation, yet H - Q curves remain parallel, and the guide vanes did not obviously change the slope of H -Q curves. In the vicinity of the design point and large flow rate, the efficiency under positive operation was significantly higher than that of reverse operation. As the flow rate decreases, the pump efficiency with positive and reverse impeller rotation becomes approximately equal. When the flow rate is less than about 1100 m3/h, the reverse efficiency becomes larger than the forward according to the numerical simulation results.
Under reverse operation, rear guide vane becomes front guide vane, yet the setting angle was not changed. As shown in Figures 12 and 13, the relative flow angle of inlet edge (β1) increased due to positive preswirl upstream of the impeller generated by the front guide vanes; hence the incidence angle increased; what is more, there is no rear guide vane to recover pressure and straighten the fluid flow. Hence there will be a big hydraulic loss and significant reductions of head and efficiency under reverse operation. And the instability of flow field may cause a higher error for numerical simulation. When the flow rate became low, the incidence angle decreases and is close to the setting angle of blade; hence the optimal operating point deviate to low flow rate in reverse operation. Meanwhile the numerical and experimental results become close.
5. Analysis of Pressure Pulsation
5.1. Pressure Pulsation in Flow Channel
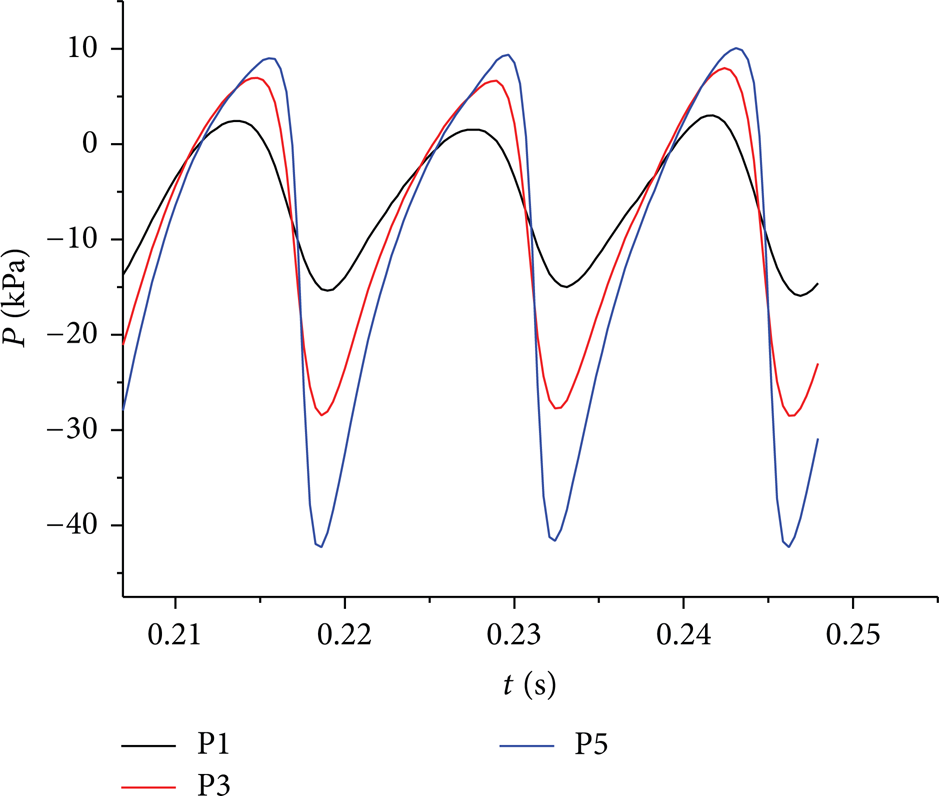
Consider positive optimal operating point, the same flow rate in reverse operation, reverse optimal operating point to analyze the difference of pressure pulsation between positive, and reverse operation. Figure 2 shows the positions of the monitoring points in flow channel. As shown in Figure 14, since the variation trends of monitoring points in the same cross-section were uniform and mainly different in the magnitude, hence the middle of each section’ monitoring points was chosen to analyze the pressure pulsation variation along the flow channel. The corresponding points were P3, P8, P18, and P28.
As shown in Figures 15 and 16, in both positive and reverse operations, the maximum pressure amplitude all occurred near to the inlet edge of the blade; there were 3 crests and troughs in each rotation cycle, but the moments that peaks and troughs appeared were different, which means blades had a main influence on pressure pulsation for all flow channel and the head and efficiency of the pump will periodically change. In forward 1494 m3/h conditions, the pressure value increased significantly after fluid flowed past the blades, and because of the diffusion and rectification in guide vane zone, the pulsation amplitude reduced to a large extent. When the fluid flowed through the guide vane zone, the maximum pressure changed slightly and the biggest difference was 1.51 KPa. However, the minimum of pressure increased greatly and by 9.53 KPa. During reverse operation, the pulsation amplitude increased as the fluid passed through the guide vane and close to blade. After fluid flowed past the blades, the pulsation amplitude reduced by 21.04 KPa. Comparing with positive operation, the max pressure amplitude was only 0.75 KPa lower in 1494 m3/h point.
It can be found from Figures 15 and 16 that the main frequencies were all blade passing frequency (BPF), the pulsation amplitudes near inlet edge were the biggest on BPF and its multiples, and guide vane had an influence on pulsation frequency of each monitoring points. For positive operation, the maximum amplitude on BPF was higher than that in reverse operation and by 9.24 kPa in 1494 m3/h point; however, the maximum amplitude on four times of shaft rotation frequency (4SRF) was less than the reverse and by 0.54 KPa.
5.2. Pressure Pulsation on Blade Surface
5.2.1. Front of Blade
For a comprehensive analysis of pressure pulsation in blade surface (see Figure 8), the monitoring points distributed in head, middle, and tail of airfoil profiles on R = 52 mm, 100 mm, and 148 mm cylinders were chosen to analyze. What is more, the 5 points under R = 100 mm cylinder were chosen to analyze the time domain and frequency domain variation along circumferential direction.

The computational grid on blade surface.

Position of monitoring points on back of blade and vane.
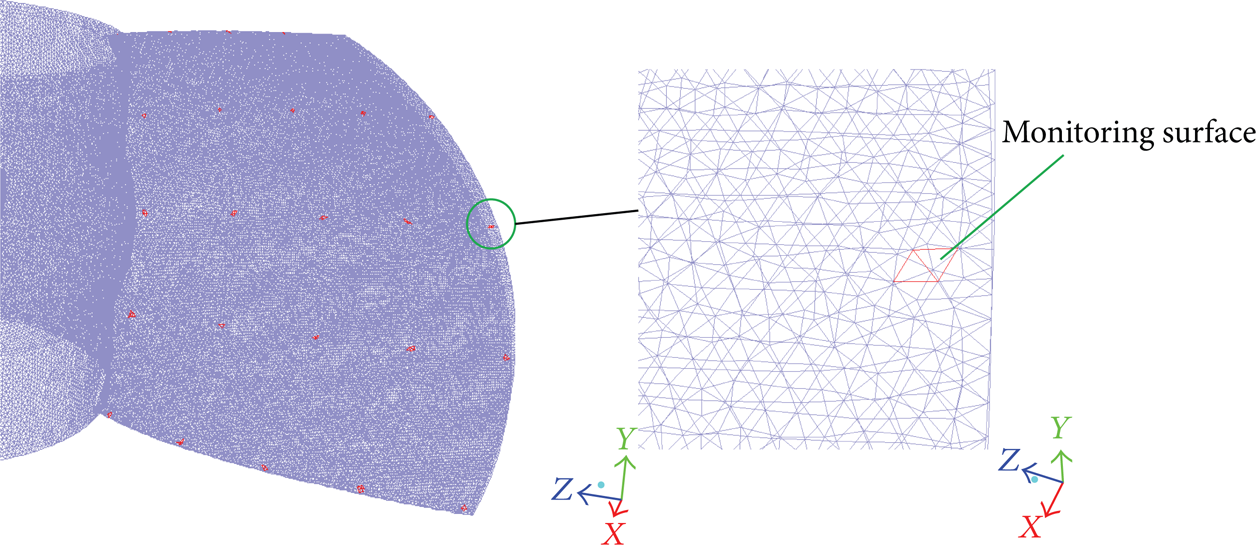
Monitoring faces on blade.

Performance curves on 0° setting angle.

Schematic diagram of positive and reverse operation.
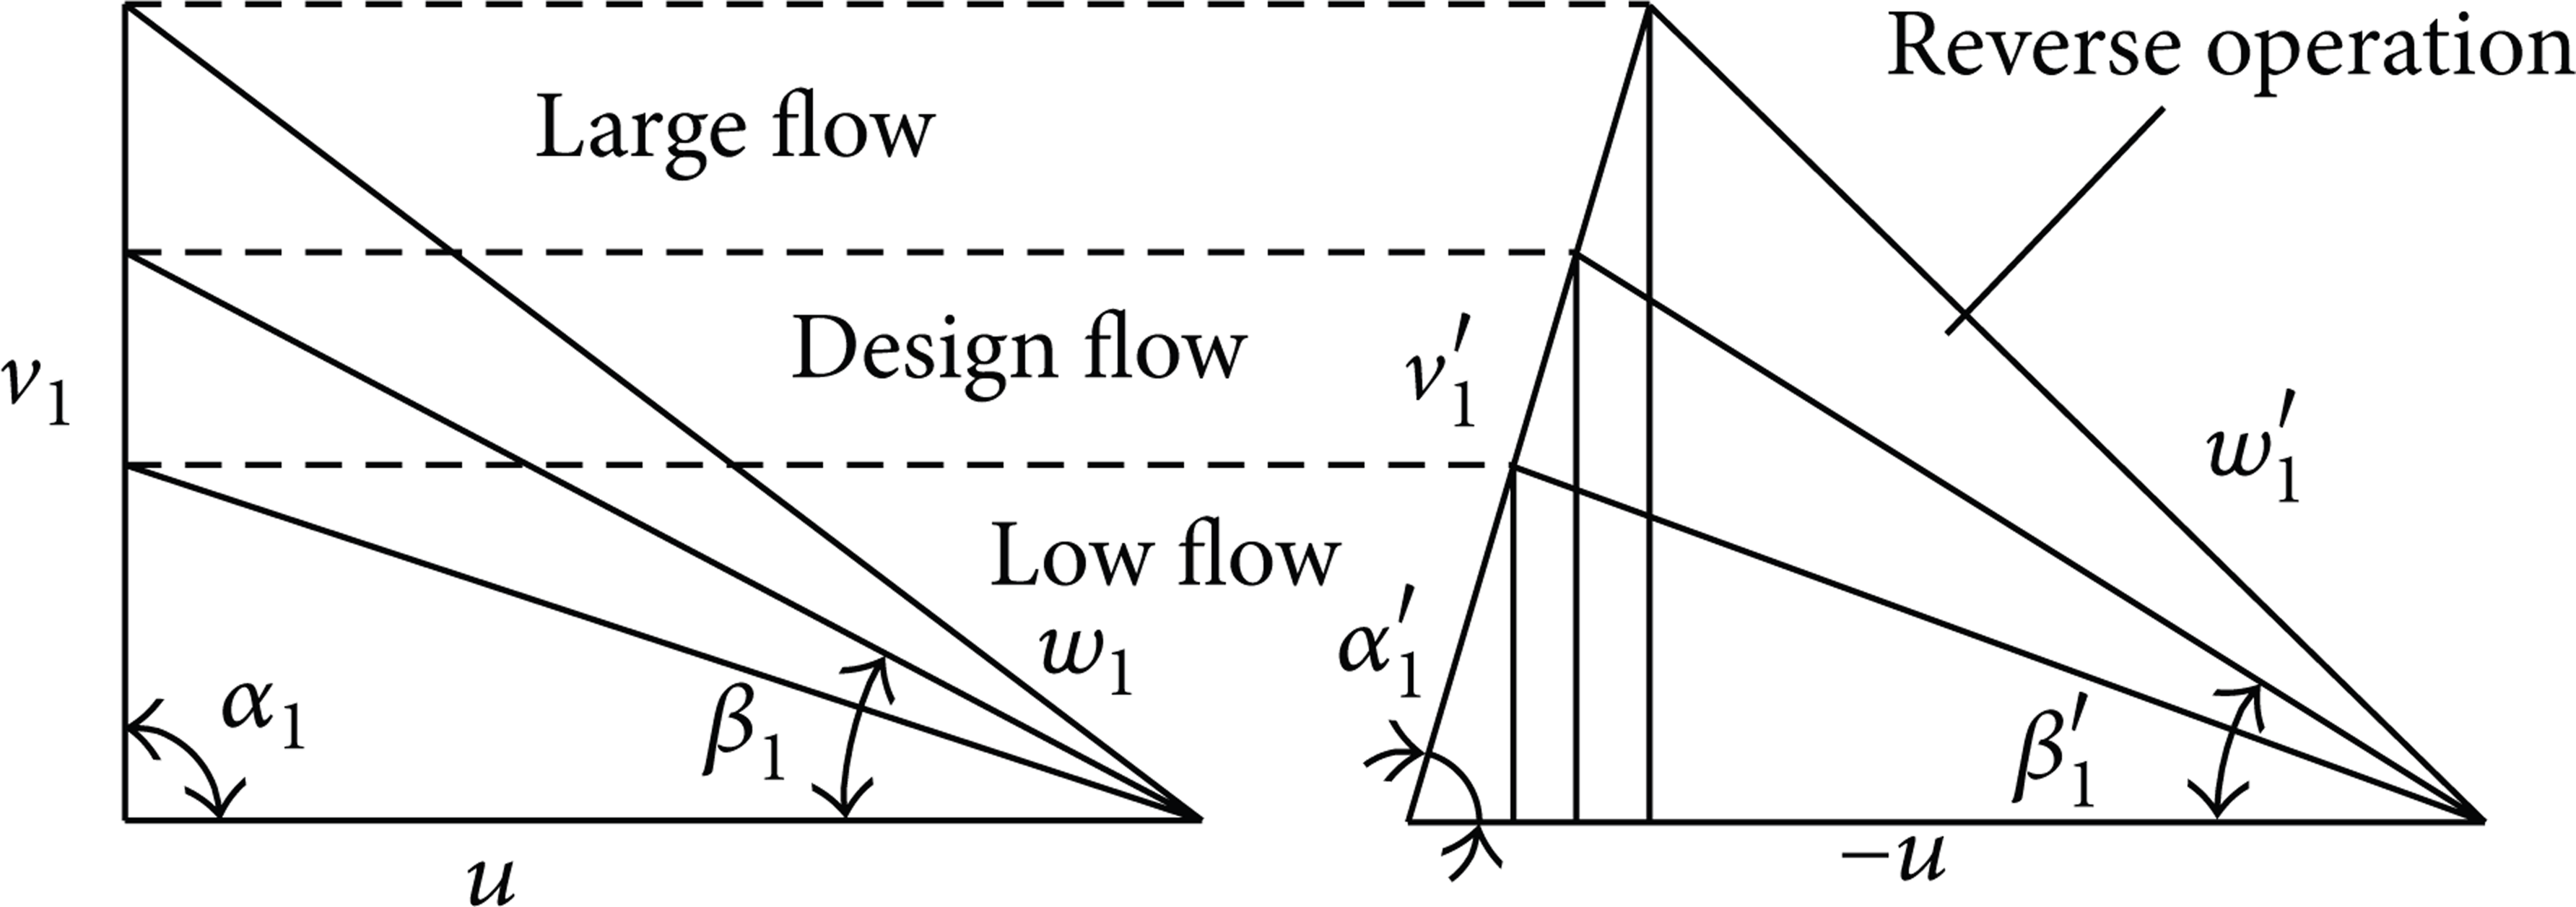
Velocity triangles.
Time domain of pressure pulsation at cross section.

Time and frequency domain of pressure pulsation at flow passage under positive operation.

Time domain and frequency domain of pressure pulsation at flow passage under reverse operation.
It was found from Figures 17, 18, and 19 that there were 4 crests and troughs in a rotation cycle on both front and back of blade surface, and pulsation amplitude had an incremental tendency from the hub to rim. Under positive operation, the maximum and minimum amplitudes, respectively, occurred in P55 and P35, the values were 9.73 KPa and 1.91 KPa, and the biggest amplitude region was near the outlet edge and the rim. In reverse operation, the maximum amplitude located in inlet edge, the maximum and minimum amplitude points were P80 and P56, and its values were 97.00 kPa and 4.13 kPa in 1494 m3/h point. In positive operation, the incidence angles were designed close to 0°; hence there was a small impact on inlet edge and the pressure amplitude was also low, while there may be big incidence angles due to the diversion of front guide vane under reverse operation. The time domain and frequency domain of pressure pulsation in 1494 m3/h point were similar with that in 1224 m3/h point, yet the maximum amplitude in 1494 m3/h point was significantly higher than that in 1224 m3/h point and by 53.62 kPa. It can be found from Figure 15 that the main frequencies of all points were 4SRF except P43 located in the middle of R = 100 mm cylinder; guide vane played a major role for the pulsation frequency on blade surface.

Time and frequency domain of pressure pulsation on R = 100 mm cylinder at front of blade (from inlet to outlet).
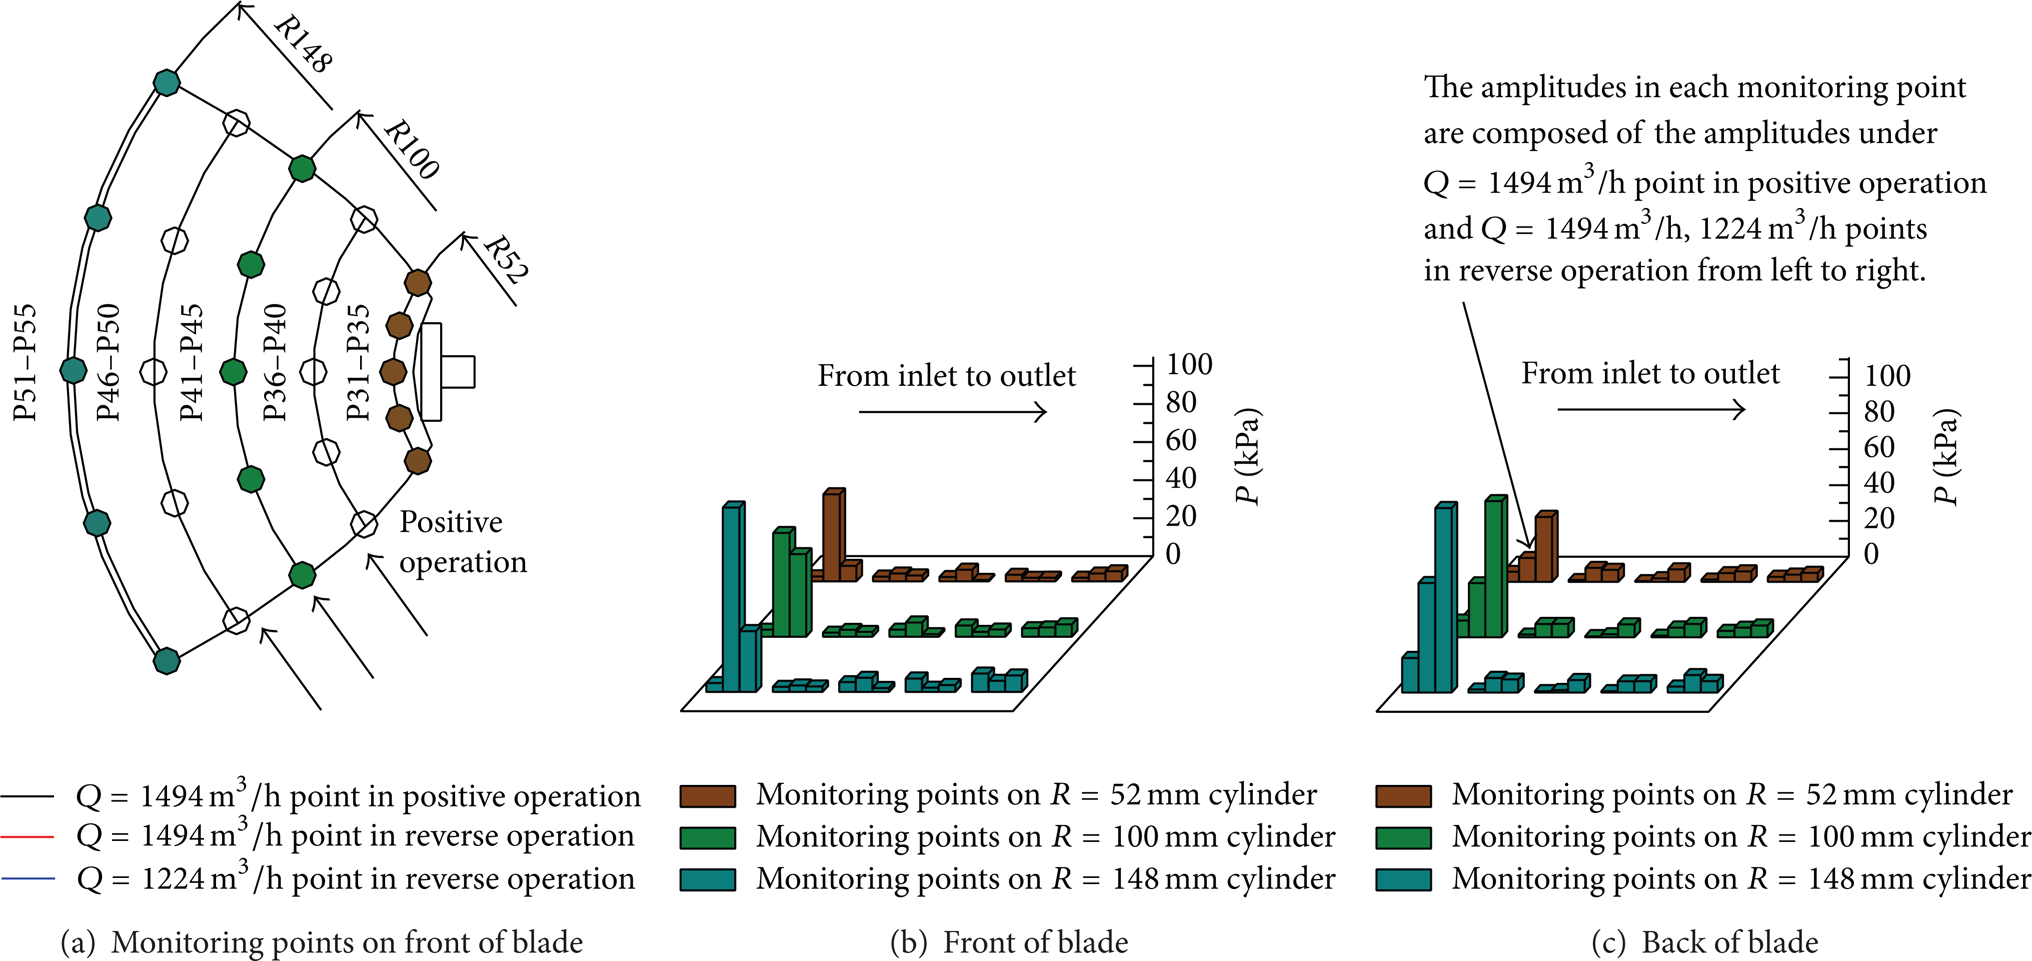
Pressure amplitudes on blade.

Time and frequency domain of pressure pulsation on R = 100 mm cylinder at back of blade (from inlet to outlet).
5.2.2. Back of Blade
As shown in Figure 18, the common points between positive and reverse operation were that the monitoring points near inlet edge had the maximum pulsation amplitude; the maximum values, respectively, were 19.28 KPa and 97.00 KPa in 1494 m3/h point. In positive operation, the pulsation amplitude in each monitoring points was all lower than that in the reverse operation, the amplitude difference between positive and reverse was least in outlet edge, and the maximum difference was 2.5 KPa. The amplitude increased from hub to rim in positive operation, the amplitude of points at middle of blade was significantly less than the points at head and tail, and the maximum amplitude at the middle of blade was only 0.79 KPa. The front and rear part of S-shaped airfoil are completely symmetrical, and the rear part is different with the common airfoil; hence there may be a worse flow pattern and bigger pressure amplitude on this region. In reverse operation, the amplitude increased from hub to rim in inlet edge; the maximum difference was 51.19 KPa in 1494 m3/h point. However, the amplitudes had a small change at middle and tail of the blade; the maximum difference was only 1.72 KPa. As shown in Figures 17 and 19, the variation law of frequency domain in the back of blade was similar to the front side, the main frequency was 4SRF, and the min amplitude on 4SRF was in the middle of the blade under positive operation while it was in tail of blade under reverse operation; there were small pulsations in inlet and outlet edge due to the impact and flow separation, and it was more obvious in reverse operation.
5.3. Pressure Pulsation on Guide Vane
5.3.1. Front of Vane
In reverse operation, guide vanes became front guide vanes, and the working surface became back surface. As shown in Figures 9 and 21, the 30 points in working and back surface were chosen to analyze.
As shown in Figures 20, 21, and 22, there were 3 crests and troughs in all monitoring points containing both front and back sides of the vane. The max amplitude region was near the blade, which was inlet edge in positive operation and outlet edge in reverse operation. In this region, the amplitude in the positive operation was significantly higher than that in reverse operation, and the max amplitude was 30.52 kPa higher than that of the reverse operation. In positive operation, the minimum amplitude occurred in the position about 25% vane height from outlet edge; and the minimum value of amplitude was 4.96 kPa in 1494 m3/h point; the increasing tendency was not clear for the amplitude from hub to rim. When the fluid flowed into the guide vane, the pressure amplitude reduced due to the effect of stationary vane, yet it will increase in outlet on account of flow separation. Under reverse operation, the amplitudes on inlet edge and middle of the vane were close. The variation law in 1224 m3/h point was similar to that in 1494 m3/h point, and the amplitude of each monitoring points in 1224 m3/h point was higher than that in 1494 m3/h point. It can be found from Figure 20 that the main frequencies were shaft rotation frequency (SRF), BPF, 4SRF, and their multiples; while the BPF dominated, there was a small change for the amplitude on 4SRF, and the impact of SRF and 4SRF became larger in the position about 25% vane height from outlet edge. Under positive operation, the amplitude on BPF decreased gradually from inlet edge to outlet edge, yet the amplitude on outlet edge was large again. In reverse operation, the amplitude on BPF increased from inlet edge to outlet edge on the whole as the flow direction became reverse.

Time and frequency domain of pressure pulsation in the middle of front vane face (from inlet to outlet).

Pressure amplitudes on guide vane.

Time and frequency domain of pressure pulsation in the middle of back vane face (from inlet to outlet).
5.3.2. Back of Vane
It can be found from Figure 21 that the position of maximum amplitude in positive operation was the same with reverse operation; the maximum amplitude under back surface was obviously higher than that of the front. Under positive operation, the max amplitude was 43.15 KPa higher than the front, while the value was 12.76 kPa in reverse 1494 m3/h point. It may be caused by a negative incidence in inlet edge of guide vane. In positive operation, the pulsation amplitude had an obvious decreasing trend from inlet edge to outlet edge, whereas the radial difference was not significant. The max amplitude under positive operation was 60.91 kPa higher than the reverse, while the min amplitude was just 3.72 kPa lower than the reverse. As shown in Figure 22, the main frequencies in the back of the vane were also BPF and the multiple of BPF. The frequency construction in back surface was the same with that in front of the vane. Under reverse operation, the pulsation on the position about 25% vane height from outlet edge was more obvious than the pulsation on the same position in positive operation.
5.4. Discussions on Pressure Amplitude Reduction
According to the analysis, the maximum amplitude mainly occurs on the inlet edge of the blade, the inlet edge of guide vane under positive operation, the outlet edge of guide vane under reverse operation, the region between blade and guide vane, and near the rim. Hence the geometric parameters of these areas should be carefully designed, which mainly include the inlet incidence angles of blade and guide vane, axial distance between blade outlet and guide vane inlet, the blading density degrees, and the setting angles of airfoils near the rim. The shape of rim may also have an influence on the maximum pulsation amplitude and should be carefully designed. Secondly, the number of blades and guide vanes should be strictly different and not proportional to each other, since the main frequencies of pressure pulsation in the pump are BPF, 4SRF, and the multiple of them; if the number of blades and guide vanes are equal or proportional to each other, the maximum amplitude will increase significantly and may disturb the stability of the pump. What is more, the adjustable guide vanes should be used if possible, since it cannot only improve the performance under reverse operation but also may reduce the pulsation amplitude by adjusting the setting angle of guide vane.
6. Conclusions
In this study, a high specific speed bidirectional axial-flow pump was designed and improved through numerical simulation results. Then the performance were tested under 10 setting angles containing both positive and reverse operations, and the differences of performance curves between positive and reverse operation were compared. After that, this paper analyzed the change law of pressure pulsation in flow passage, both front and back of blade and guide vane in detail. The main results are summarized as follows:
The H-Q and constant efficiency curves had the same variation trend. And the high efficiency area was near to the 2° setting angle in positive operation, while it was near −4° setting angle in reverse.
In reverse operation, the head reduced significantly compared with positive operation, and optimal operating point deviate to low flow rate, whereas the range of high efficiency area was close to that in positive operation.
The main frequency in flow passage was BPF, and the maximum pulsation amplitude occurred near to the inlet side of the blades. In the same cross-section, pressure pulsations had the same variation tendency, and mainly the amplitudes were different.
The main frequency of pressure pulsations under blade face was four times of shaft rotation frequency, which was equal to the number of guide vanes. There were also small pressure pulsations on inlet and outlet edge of which were irregular due to impact and flow separation. On the front of blade, the biggest amplitude region was near the outlet edge and the rim in positive operation, while it was near to the inlet edge in reverse operation. In the back side of blade, the max pulsation amplitude occurred near to the inlet edge, and the amplitudes of pressure pulsations at each monitoring point in positive operation were all lower than that in the reverse operation.
The main frequency under guide vane face was BPF. The max amplitude occurs to the position close to the blade, and the position of min amplitude was about 25% vane height from outlet edge. When it became reverse operation, this pulsation trend was more obvious.
Conflict of Interests
The authors declare that there is no conflict of interests regarding the publication of this paper.
Footnotes
Acknowledgment
The authors would like to acknowledge the financial support offered by the Project of Manufacturing, Education and Research in Baoshan district, Shanghai city, under Grant no. CXY2012-12.