
Abstract
A systematic method to obtain the freezing characteristics and the amounts of frost heave in the soils around a buried oil pipeline in island talik permafrost region is presented on the basis of the simulation of soil temperature fields and a classic segregated potential frost heave model. The finite thermal effect domain and the equivalent heat capacity method were adopted to analyze the heat transfer process with phase change. The calculation parameters were derived from the China-Russia Crude Oil Pipeline engineering. The developments of the annual maximum freezing circles and frost penetrations emerging in typical years within the pipeline operation life cycle under different oil temperature, different thickness of thermal insulation layer, and different water content of soils were investigated. The maximum frost heaves in four typical sections of island talik were predicted. The results can be used to further mechanical calculation and can provide references for risk evaluation and site management of the buried pipelines in island talik permafrost regions.
1. Introduction
The buried oil pipeline may face huge challenges for safe operation due to severe frost heave and thaw settlement deformations which are induced by the freezing and thawing process of soils around the pipe transporting oil with varying temperatures [1]. The freezing and thawing process is also affected by the change of the atmospheric environment. In permafrost region, the island-shaped section of soils, containing perennial nonfrozen water, resulting from the outside disturbance, or consisting of groundwater passageway, is called island talik permafrost region [2]. The soil in island talik is susceptible to the disturbance imposed by the environment and buried oil pipeline after the start of its operation. The water-contained soil might be frozen which can lead to differential frost heave and soil deformation and finally can destroy the pipeline structure [3].
In order to obtain the freezing and thawing characteristics of soils in permafrost region, the complicated heat and mass transfer process including moisture transfer, heat conduction, and phase change has been widely studied experimentally and numerically [4, 5]. The experimental studies mainly consisted of the measurements of soil temperature, water content of soil, mechanical characteristics of soils, and the moisture-heat coupling process. But there are no direct experimental studies on soil freezing and heaving under the thermal effect of a buried pipeline in permafrost regions. On the other hand, the theoretical and numerical studies usually concentrated on the moisture-heat-stress coupling model of soils and tried to obtain the moisture, thermal, and stress parameters simultaneously [6, 7]. But it is difficult to clearly describe the various thermodynamical and mechanical parameters of soils and their interrelationship in theory. These pioneering studies can provide basic information for determining the freezing and thawing characteristics of soils in permafrost region. However, they are not sufficient and convenient for calculating the frost heave in soils around an actual buried pipeline engineering.
Furthermore, in order to predict the amount of the soil deformation and the danger level for the buried pipeline in permafrost regions, many works related to the thaw settlement and frost heave in soils around the buried pipeline have also been carried out. Konrad and Morgenstern [8] proposed a procedure to calculate the frost heave based on a finite difference formulation of heat and mass transfer in saturated soils and on a segregation potential concept. Oswell [9] conducted several large-scale frost heave tests and pointed out that soil frost heave under pipeline depends on three conditions: the freezing temperature in unfrozen soils, a source of water to migrate to the freezing front, and the frost susceptible soil that permits free water to migrate. Palmer and Williams [10] examined the interaction between soil frost heave and upheaval buckling of pipeline from the aspect of mechanics. Konrad and Shen [11] simulated the frost action including the stress-strain-temperature relationship using a two-dimensional segregation potential method. Selvadurai et al. [12, 13] established a three-dimensional finite element model of the interaction between buried pipeline and soil based on the simplified moisture-heat coupling effect. It focused on the induced bending stress on pipe caused by frost heave. These studies provide valuable information for predicting the soil deformation and understanding its effects on pipeline.
Recently, owing to the design and operation of China-Russia Crude Oil Pipeline (CRCOP), some institutions in China such as the Cold and Arid Regions Environmental and Engineering Research Institute of Chinese Academy of Sciences have also performed certain research related to the soil deformation around the buried pipeline in permafrost regions. The researchers conducted geological survey and investigations of the temperature distribution of soils and transported oil along the pipeline. Among them, Zhang et al. [14] used the finite element method to estimate the thermal effects of the CRCOP pipeline. The results indicated that the thaw of permafrost under the pipeline cannot be prevented. Li et al. [15] analyzed the freezing and thawing process of the soils around the buried pipeline by numerical simulation. They concluded that the insulation can restrain the heat transfer between pipeline and soils during the early operating period. Ji et al. [16] measured the frost heaving features of soils in typical geomorphologic units along the pipeline and found that the frost heaving ratio of the silty clay with humus was the maximum one among the tested samples. These findings provide a great deal of useful information for understanding basic situations of CRCOP engineering.
However, it is worth mentioning that, owing to the complicated atmospheric environment, various compositions of soils, and different engineering background, great differences exist in the situations of permafrost region (including the island talik) and pipeline which are located in various geographical locations. Accordingly, different thermodynamical and mechanical models are required for different actual pipeline projects. With respect to CRCOP, nobody has performed comprehensive analyses of the freezing and heaving rules of the soils in island talik under the influences of different oil temperatures, different thicknesses of thermal insulation layer, and different water contents of soils, as far as we know. Thus, a systematic method to obtain more accurate and reliable results of soil frost heave for CRCOP is very necessary.
Against this background, the freezing characteristics of soils around the buried pipeline in four typical sections of island talik with various oil temperatures, thicknesses of thermal insulation layer, and water contents were investigated quantitatively on the basis of the simulation of unsteady soil temperature fields. The finite thermal effect domain and the equivalent heat capacity method were adopted to analyze the heat transfer process with phase change. The amounts of soil frost heave were calculated by the segregated potential frost heave model based on the obtained frost penetrations and temperature gradients. The research provides an effective method for calculating the freezing size and frost heave in soils around the buried pipelines in island talik permafrost regions.
2. Modeling
As described in our previous research [17], for forecasting the thaw settlement of soils, the heat transfer of soils around the buried oil pipelines in permafrost regions including the island talik is a complicated process involving phase change, moisture migration, and coupled deformation. To simplify the calculation, some assumptions are made in the modelling as follows: (1) the replaced soil in the pipe ditch, the pipe wall, and the coating have no effects on the long-term soil temperature fields; (2) the oil temperature on the cross-section of pipe is uniform; (3) the soil is isotropic and the heat conduction of soil along the direction of pipe axis is ignored; and (4) the effects of moisture transfer on the long-term soil temperature fields are also ignored [18].
2.1. Geometric Model
Some researchers adopted a finite thermal effect domain for simulating the soil temperature fields around the buried pipeline in nonpermafrost regions [19]. For the pipeline in island talik permafrost region, the similar method was adopted to determine the appropriate size of the thermal effect domain. The sketch of the geometric model of the buried oil pipeline in permafrost region is presented in Figure 1. Half of the thermal effect domain was chosen to be the computational domain. According to the results of geological survey for CRCOP [20], the unilateral horizontal distance was set to be 15 m for the buried pipeline with a large diameter. The vertical depth was set to be 20 m due to the stable year-round temperature gradient at the location. The soil around the pipeline was divided into three layers by the soil types in the domain. The first layer at the depth of 3 m below the ground was composed of sand loam. The second layer at the depth of 3–10 m consisted of silty clay mainly. The third layer at the depth of 10–20 m was composed of bedrock mainly. The nominal buried depth and diameter of the pipe were 1.5 and 0.813 m, respectively. Partial sections of pipeline were wrapped with thermal insulation layer of 80 mm thickness.

Sketch of the buried oil pipeline in permafrost region.
2.2. Governing Equations
As introduced in our previous research [17], the equivalent heat capacity was adopted to replace the latent heat of phase change according to the temperature regime of soil. The governing equation of heat conduction is written as

where c p denotes the heat capacity of soil and λ is the thermal conductivity according to the temperature condition and the corresponding freezing-thawing state. They are expressed as follows when T is between the temperature of fully frozen T1 and the temperature of phase transition T2:

where c f and c u are heat capacities of frozen and unfrozen soil, respectively, λ f and λ u are thermal conductivities of frozen and unfrozen soil, respectively, and L is the latent heat in ice-water phase transition. ΔT is a small temperature range, W is the total water content, and ΔW is the change of frozen water content in a small temperature range.
The heat conduction equation of the thermal insulation layer outside the pipe wall in the polar coordinate can be written as

where the superscript
The segregated potential frost heave model [21, 22] adopted in this research is given as (4). The frost heave was assumed to be composed of segregation frost which is induced by water migrating and freezing from outside and of in situ frost caused by freezing of pore water. The former frost makes volume of soils increase approximately 1.09 times. Meanwhile, the latter one makes volume increase about 0.09 times:

where ΔH is the value of frost heave, Δh f is segregation frost, SP0 is segregated potential which can be calculated by SP0 = aexp(− bP e ), a and b are the parameters related to the soil type, P e is external physical loads, gradT(t) is the temperature gradient at a given time, Δt is freezing time, η is porosity of soil, and ΔZ is the displacement of the freezing front in time Δt.
2.3. Boundary Conditions
The method for setting the boundary conditions is similar to that used in our previous research [17]. However, the parameters are significantly changed due to the changed state of soils in island talik. The upper boundary of the model of soil temperature fields is assumed to be the first boundary condition because the annual variation of the ground surface temperature is found to be regular based on the geological survey. It is easy to describe it by a periodic function. In contrast, it requires a complicated function to describe the ambiguous convective heat transfer coefficient if we set the boundary to be the second boundary. Considering the fact that the atmospheric temperature has risen by 2.4 K in the last 50 years, the periodic function is written as

where T′ is the annual mean surface temperature, A is the annual amplitude of the change of the surface temperature, and t is time. Two representative functions were obtained by regression analysis using the least square method for the surface temperature in island talik permafrost region along the CRCOP. The average temperatures were 274.15 and 275.15 K with both amplitudes being 19 K, respectively. The corresponding regional soils were defined as low-temperature (cold) and high-temperature (hot) unfrozen soils, respectively.
The left boundary not including pipe wall is a symmetrical boundary, while the right boundary is assumed to not be thermally affected by the buried pipe. They are formulated as

The boundary of pipe wall in the model is assumed to be the first boundary condition. The temperature is the same as the uniform oil temperature based on the aforementioned assumption. It is described by a sinusoidal function obtained by regression analysis via the least square method as
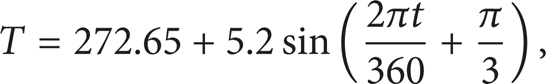
where π/3 is the initial phase. This phase differs from that in the periodic function of the surface temperature. It indicates that the change of oil temperature lags behind that of the surface temperature.
The lower boundary of the model is assumed to be the second boundary condition according to the year-round stable temperature gradient there via geological survey [20]. This boundary is described as a constant heat flux as (8). The stable temperature gradient at the location of 20 m below the surface is −0.04 K/m along the section of CRCOP in China [23]:

2.4. Other Parameters
The basic thermophysical parameters of various materials involved in the model of soil temperature fields are set as the same as those in our previous research [17]. The other thermophysical parameters and equivalent heat capacities of the silty clay with various water contents are referenced from [24]. The equivalent heat capacities of the three types of soils with the average water contents in various layers corresponding to different temperature ranges are shown in Table 1. For calculating the segregated potential during the freezing process, the parameters a and b of the sand loam around the pipe are set to be 1.45 × 10⁻⁸ m2/(s·K) and 0.015 × 10⁻³ Pa−1, respectively. The porosity of soil is assumed to be 10% generally [2].
Equivalent heat capacities (J/(kg·K)) of soils with average water contents [24].

3. Numerical Method
3.1. Grids
Figure 2 shows the grids of partial computational domain near the buried pipe. The unstructured triangular grids in Cartesian coordinate are generated for the soil area automatically via the Delaunay triangulation method and the structured quadrilateral grids in polar coordinate are generated for the thermal insulation layer area. Since the temperature gradient is greater in the region near the pipe, denser grids are generated in the region close to the pipeline without overlapping each other. There are 4570 triangular elements in total.

Grids of computational domain around the buried pipe.
3.2. Establishment of Initial Temperature Fields
The initial temperature fields can be used to verify the model and calculate unsteady soil temperature fields further. When we calculated the initial temperature fields, the climate warming was ignored in the surface temperature function of (5) and the boundary of pipe wall was assumed to be adiabatic.
The widely applied commercial software FLUENT was adopted in this study. This numerical method can be easily used to practical engineering application. Several user defined functions were written and inserted to describe the thermophysical parameters of various types of soils and the time-dependent boundary conditions. The heat conduction equation was discreted by the second order upwind scheme and the time step was chosen as 86400 s. The calculation of initial temperature fields had lasted for a period of 50–100 years until the soil temperature reached constant at the same position in the area with seasonal varying temperature at the same time in continuous years; meanwhile, the temperature fields in other areas of the computational domain remained stable.
The section of CRCOP in China was put into operation in autumn, and one week was needed to fill up the pipeline with oil. It is difficult to determine the exact initial time for different typical sections along the pipeline. However, as long as the initial boundary conditions are guaranteed to correspond with the corresponding time, the initial temperature fields of any time in one year do not affect the prediction results in the long-term operation of pipeline. In the current study, July 15th, the day in the hottest month, was selected as the initial time for the convenience of calculation. The initial temperature fields of soils on the starting date of the pipeline are shown in Figure 3. Figure 3(a) corresponds to the hot unfrozen soils with temperature from 275.15 to 280.15 K under pipeline and Figure 3(b) represents the cold unfrozen soils with average temperature being 274.65 K. These features also agree well with those of the temperature distribution in island talik permafrost regions introduced in the classic literature [2].
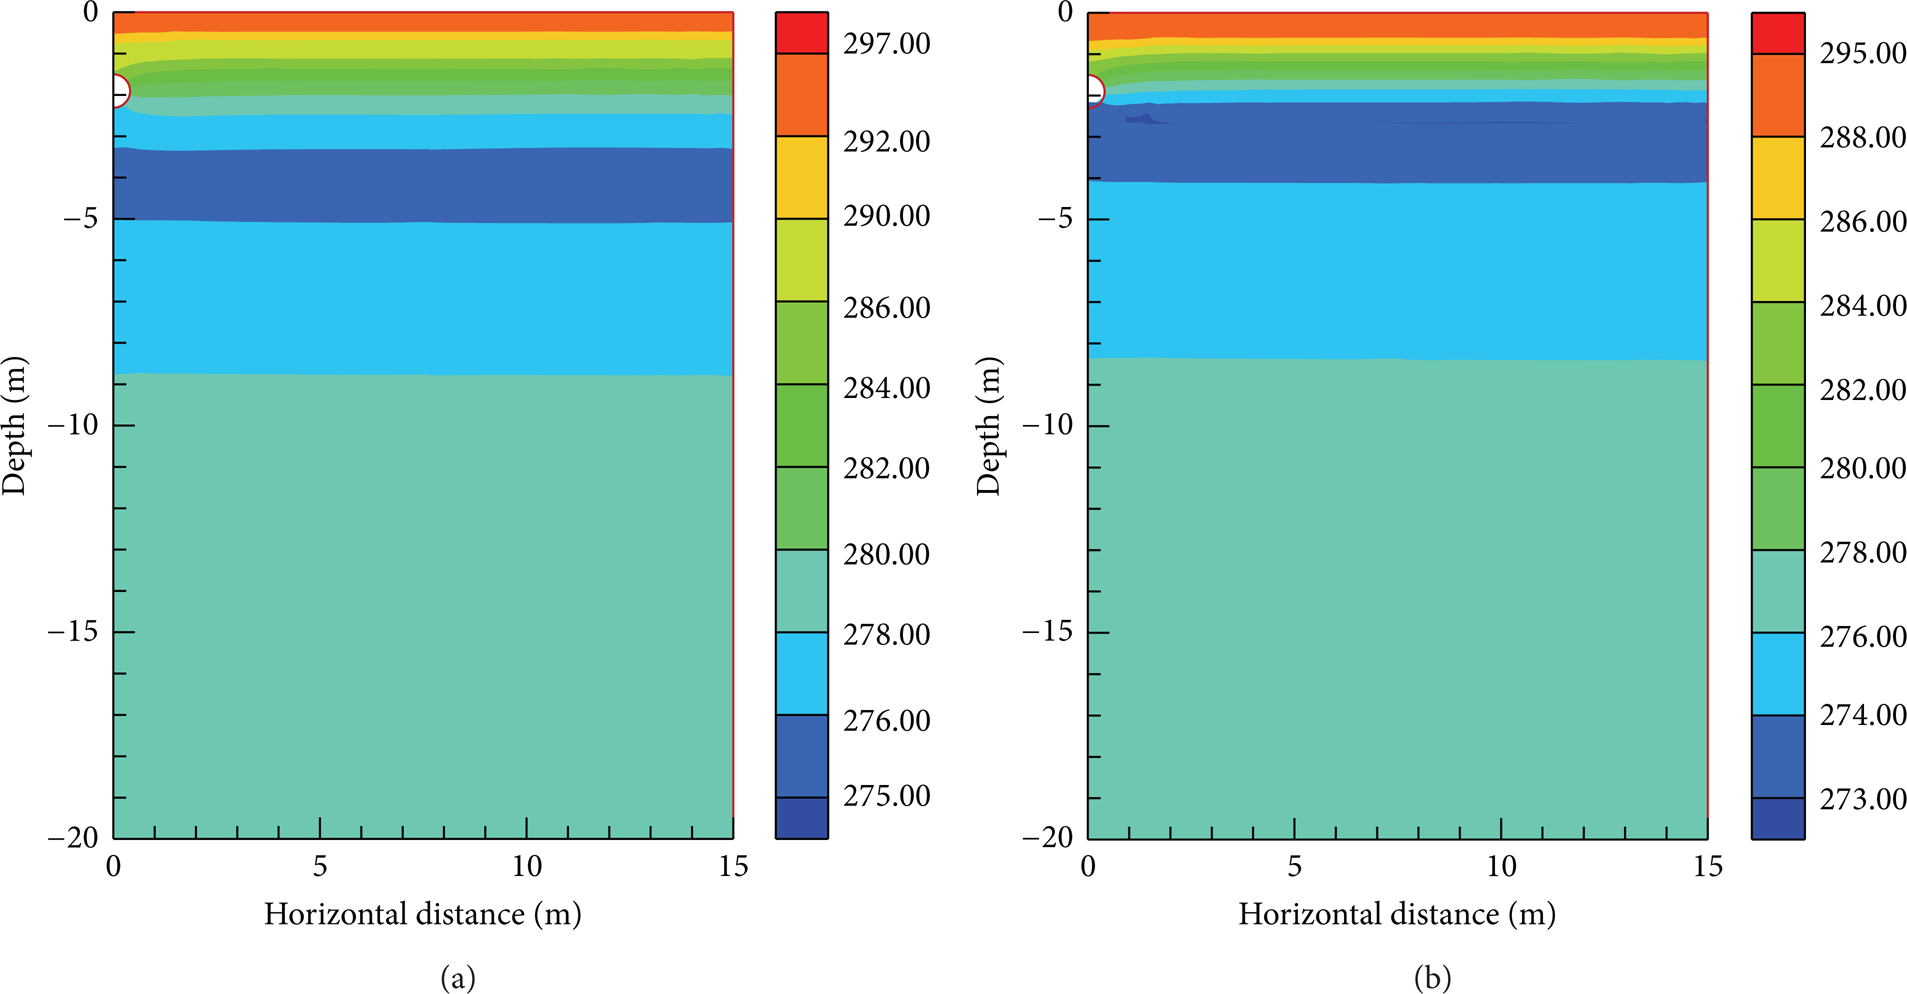
Initial temperature fields of (a) hot unfrozen soils and (b) cold unfrozen soils in island talik permafrost region.
3.3. Validation
The temperature distribution of the plumb line that is 10 m of horizontal distance from the central axis of the pipeline in the computational domain was chosen as the evaluation object. Figure 4 presents the calculation results along with the actually measured temperatures in different depths in an island talik near Jia station along CRCOP in July in summer. It can be found that the calculation results of the natural temperature distribution of soils are in good agreement with the measured values with the maximum deviation being not more than 1.5 K. This validates the accuracy and reliability of the model and numerical calculation.

Distribution of soil temperature in different depths near Jia Station.
4. Results and Discussions
According to the water-bearing characteristics of soils in island talik permafrost region along the section of CRCOP in China, the four typical talik sections of 20%, 25%, 35%, and 55% water contents in soils were selected as research objects to analyze the freezing characteristics and to calculate the amounts of frost heave. The temperature fields of hot and cold unfrozen soils as established in Section 3.2 were adopted as the initial temperature fields. The oil temperatures in operation were considered to be constant (267.15, 269.15, and 271.15 K) and varying in a sinusoidal pattern as expressed in (7). The thicknesses of thermal insulation layer were assumed to be 0, 10, 80, and 120 mm, respectively. The developing processes of the annual maximum freezing circles (isothermal line of 273.15 K, freezing interface) around the buried pipeline under the conditions of above various parameters were simulated and analyzed to determine the change of the maximum frost penetration and frost heave during the pipeline operation life cycle of 50 years.
4.1. Freezing Characteristics
The developments of the annual maximum freezing circles and frost penetrations emerging in typical years within the pipeline operation life cycle under different factors such as oil temperature were investigated. Figure 5 presents the results of the initial cold unfrozen soils of 20% water content around the pipeline without heat preservation under the conditions of 267.15 K and periodic oil temperature. In this study, we also performed numerical calculations under other conditions to compare the freezing characteristics. Figure 6 shows the variations of the annual maximum frost penetrations under the pipeline with different oil temperatures, different thicknesses of thermal insulation layer, and different water contents during the operation period, respectively.
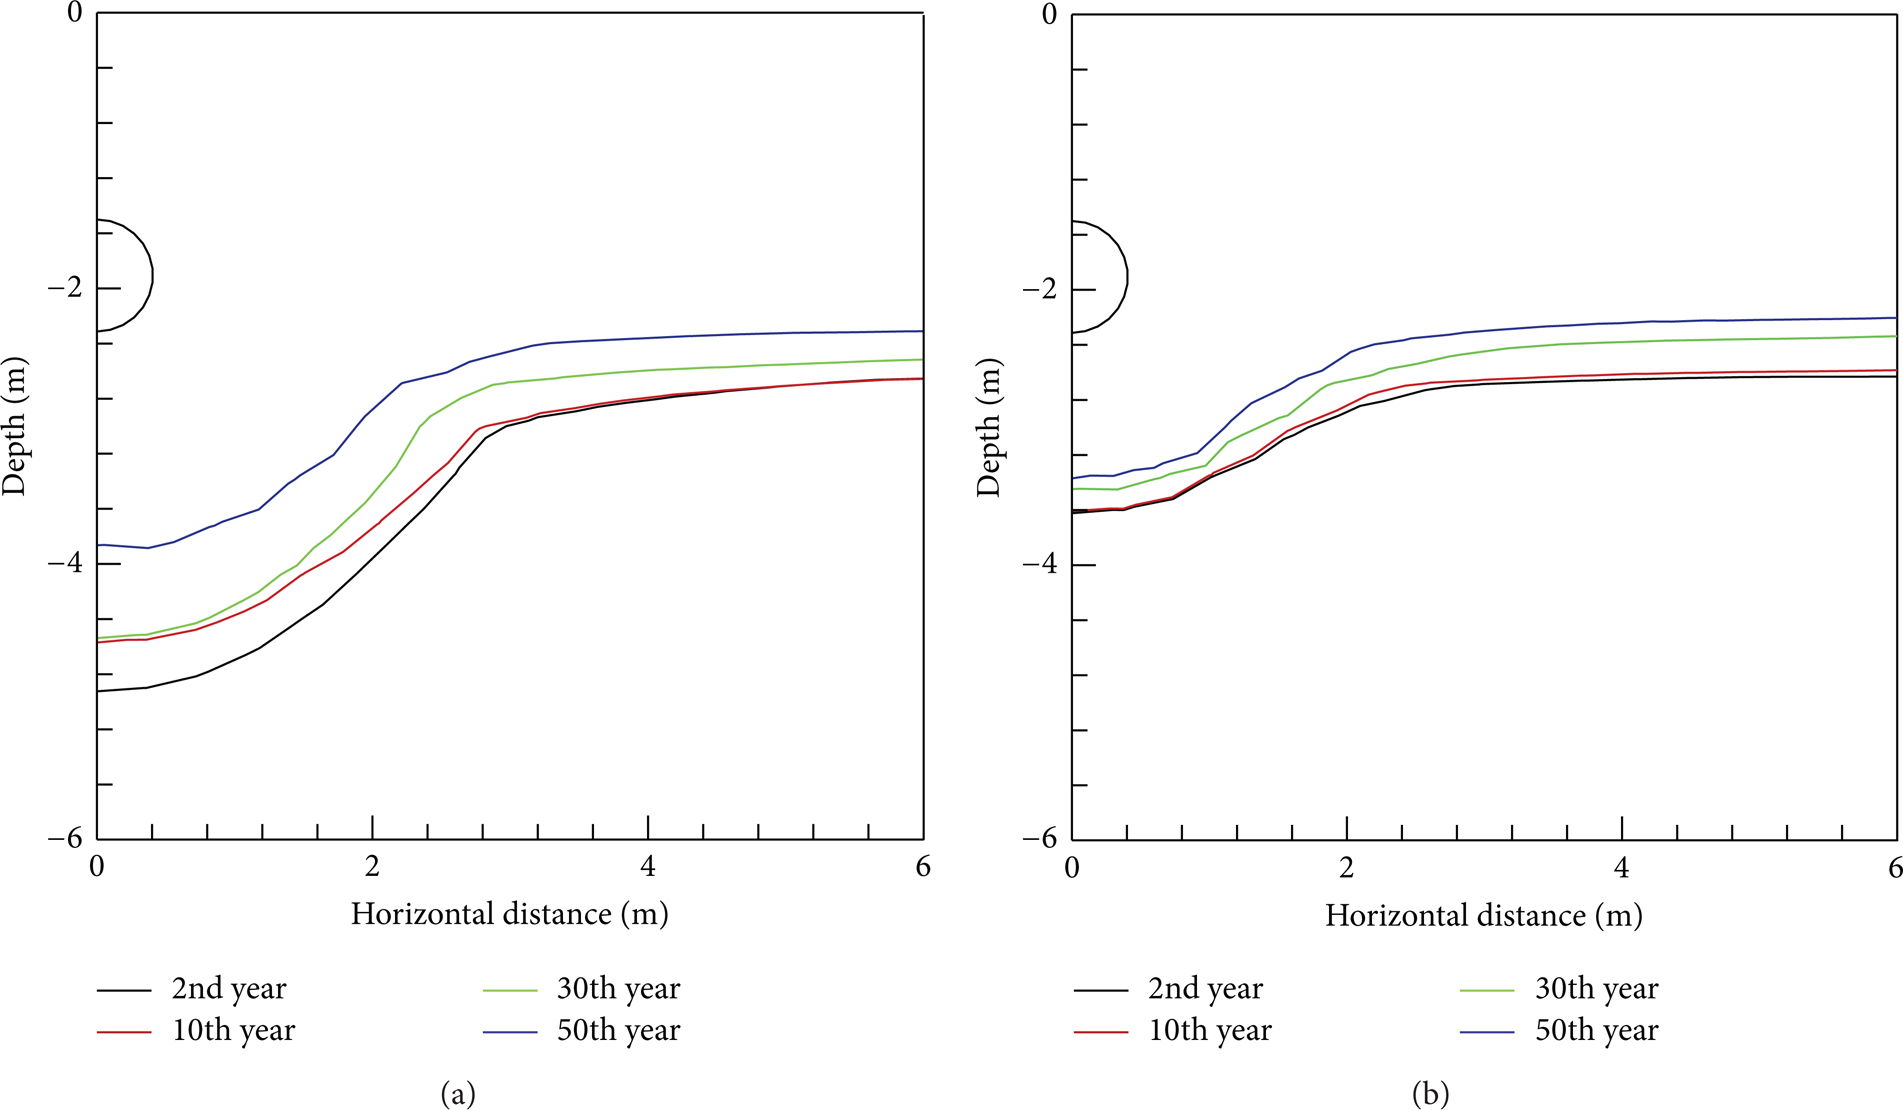
Development of the annual maximum freezing circle around the pipeline with different oil temperatures: (a) 267.15 K and (b) periodic.

Variation of annual maximum frost penetration under pipeline with different (a) oil temperatures, (b) thicknesses of thermal insulation layer, and (c) water contents in soils.
From Figure 5, it can be seen that the annual maximum freezing circle around the pipeline in island talik permafrost region narrows as time elapses when the pipeline is operated with negative and periodic oil temperatures. The variation trend of the freezing circle is smooth during the operation period. The size of the circle with 267.15 K oil temperature is larger than that with the periodic oil temperature. Moreover, the annual maximum freezing circles with 269.15 and 271.15 K oil temperatures are also found to be smaller than those with 267.15 K oil temperature in the other same situations based on our simulation (not shown here, due to the limited space). It indicates that the lower the oil temperature is, the larger the size of the annual maximum freezing circle can be obtained. In addition, with the other same parameters, the annual maximum freezing circle of soils around the buried pipe with 80 mm thermal insulation layer is found to be much smaller than that of the case without heat preservation. The heat exchange between soils and the pipe can be suppressed by the thermal insulation layer obviously. The thicker the layer is, the harder the unfrozen soil around the pipeline turns to be freezing. The annual maximum freezing circle of the soil with 20% water content is found to be slightly larger than that of the 25% water content case with the other same parameters due to the smaller heat capacity of soils with lower water content.
From Figure 6(a), it can be seen that the maximum frost penetration emerges in the second year after operation as 2.8 m under the pipeline with the oil temperature of 267.15 K for the initial cold unfrozen soil of 20% water content. In contrast, the 271.15 K oil temperature has less effect on the freezing of soil. With the periodic oil temperature as described in (7), the freezing and thawing of soils around the pipeline may develop alternately because of the positive and negative effects of the transported oil. Thus, the maximum frost penetration in the second year under this condition as 1.34 m is between those of the 271.15 K and 269.15 K cases. Furthermore, the thermal insulation layer seems to have significant effects on the frost penetration as shown in Figure 6(b). The annual maximum frost penetrations are almost identical for the cases with 80 and 120 mm thermal insulation layers. It indicates that an economical thickness of the insulation layer exists for the application in CRCOP. However, they are smaller than that of the 40 mm case due to the more effective heat insulation.
From Figure 6(c), we can see that the annual maximum frost penetration under the pipe decreases with the increasing of water content. For the initial cold unfrozen soil of 55% water content, the maximum frost penetration as 1.03 m also appears in the second year after operation of the pipeline with the periodic oil temperature, which is 0.3 m smaller than that of the 20% water content case. In addition, according to the features of the freezing circles shown in Figure 5, the maximum frost penetration at the position far away from the buried pipe is found to decrease year by year due to the rise of the atmospheric temperature. These results imply that close attention should be paid to the probable large increase of the frost penetration in island talik permafrost region when the weather or oil turns extreme cold at the project site and when the thermal insulation layer is broken or soaked.
4.2. Frost Heave in Typical Sections
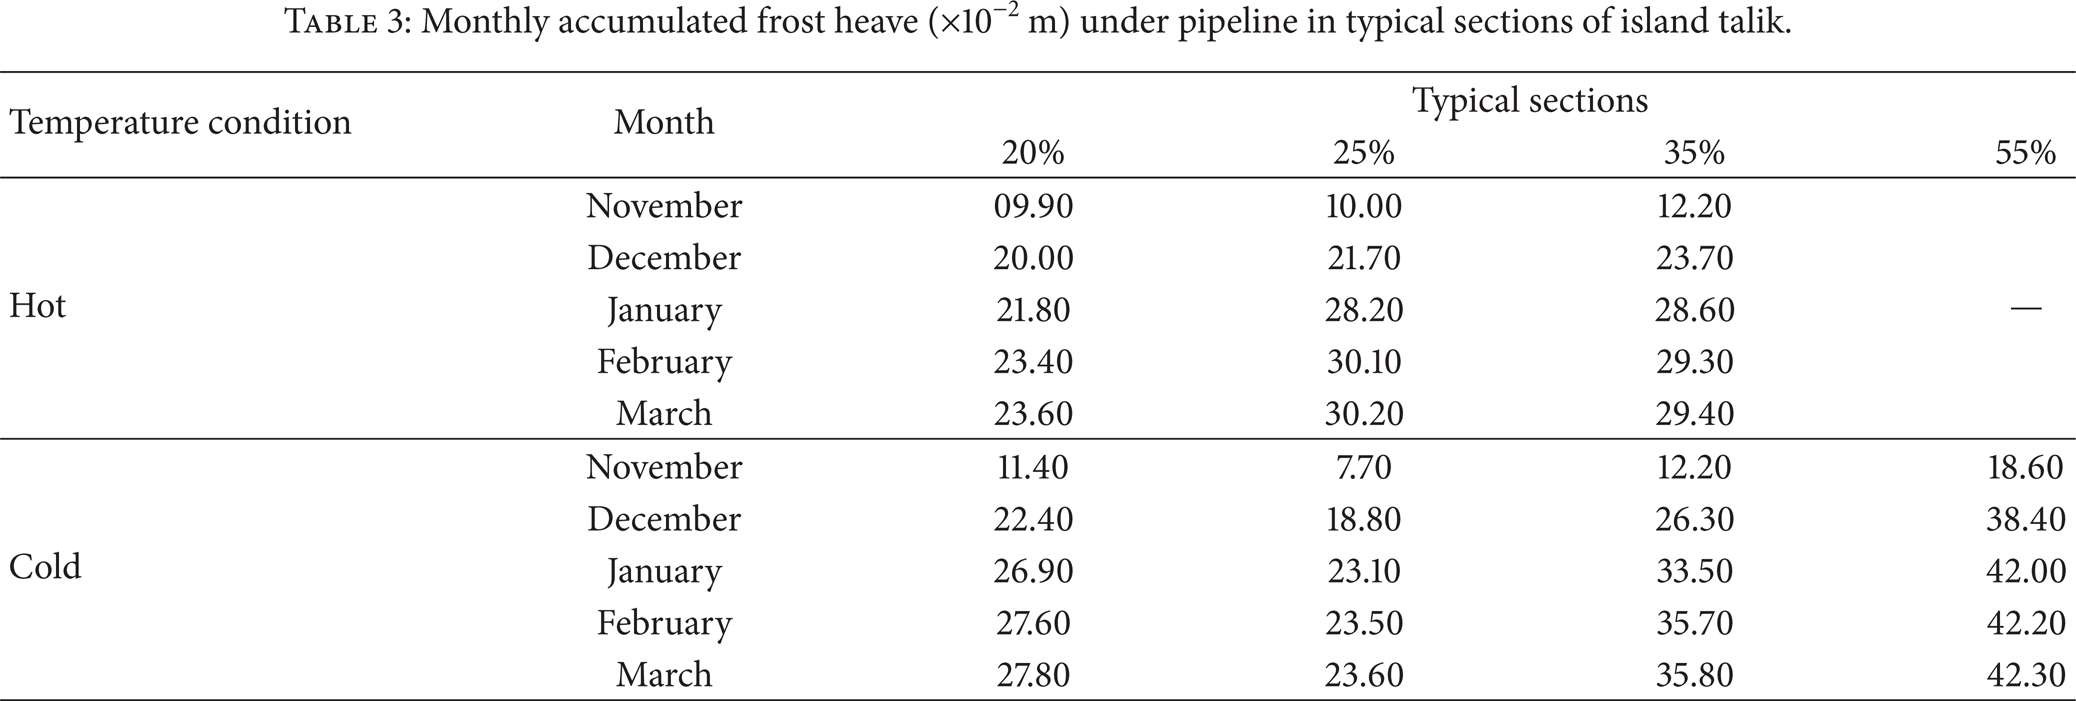
In this section, the oil temperature is set to vary in a sinusoidal pattern as (7) according to the design conditions of the section of CRCOP in China. Based on the monthly frost penetration and average temperature gradient of the freezing front in the freezing season, the amounts of the monthly frost heave under pipeline in three typical sections of island talik with 20%, 25%, and 35% water contents in the second year after operation were calculated for two initial temperature conditions of hot and cold unfrozen soils by using (4). In particular, for the section with 55% water content, the designed thermal insulation layer was ignored to predict the maximum frost heave of soils under the cold initial temperature for considering the worst factors. Table 2 lists the monthly frost penetration and average temperature gradient of the freezing front in the freezing season in the second year after operation for the four typical talik sections. Table 3 presents the monthly accumulated frost heave under the same conditions.
Monthly frost penetration (m) and average temperature gradient (K/m) of the freezing front in typical sections of island talik.

*The left side of the slash represents the value of frost penetration, while the right side represents the value of the average temperature gradient.
Monthly accumulated frost heave (×10−2 m) under pipeline in typical sections of island talik.
According to the results shown in Table 2, the monthly frost penetration under the pipeline is found to increase from the last November to March in the second year for all the typical sections due to the effects of the decreasing oil temperature and atmospheric temperature. For the sections with 20% and 25% water contents, the values of frost penetrations under cold initial temperature condition are larger than those under the hot initial temperature condition. Nevertheless, the monthly frost penetrations for the section with 35% water content under the hot and cold initial temperature conditions do not have the similar rules. Actually, since the hot unfrozen soils of 35% water content have a larger thermal diffusing coefficient, the frost penetration is slightly larger than that of the soils under cold initial temperature condition. For the sections of island talik with 35% and 55% water contents under cold initial temperature condition, the monthly frost penetrations are also quite close due to the almost uniform thermophysical parameters. Because of their larger heat capacities, the corresponding frost penetrations are slightly less than those of the sections with 20% and 25% water contents. The average temperature gradients of the freezing front are larger in the initial two months. In addition, it can be seen in Table 2 that the average temperature gradients for the four sections decrease month by month. It can be attributed to the decreasing temperature difference between the adjacent soils during the heat transfer process.
It can be seen in Table 3 that the amounts of the frost heave under the pipeline increase month by month in the freezing season for all the typical sections of island talik. The frost heaves develop quickly in the first three months from the freezing moment but smoothly in the later two months till March. This also indicates the fast freezing induced by the large temperature gradient during the early operating period. The maximum amount of the frost heave of the section with 20% water content is 0.278 m under conditions of cold initial temperature and periodic oil temperature. It is larger than that under the condition of hot initial temperature. For the section of island talik with 25% water content, the result under hot initial temperature is 0.302 m. Moreover, the amounts of this case are larger than those under the cold initial temperature in the same months due to the greater temperature gradients in such conditions. As the water content increases, the largest amounts of the accumulated frost heaves of the sections with 35% and 55% water contents under the cold initial temperature increase to 0.358 and 0.423 m, respectively. Thus, the relationship between the maximum frost heave and water content of soils during the pipeline operation period is not simply linear because of the combined effects of the temperature gradient at the freezing front and of the frost penetration affected by the complicated process of heat transfer including phase change in soils.
In the design of the section of CRCOP in China, the allowable deformation of the pipeline structure in the length of 40 m is suggested to be 0.25 m [24]. The obtained maximum frost heaves in the typical sections exceed the critical value except for the soils of 20% water content under hot initial temperature and the soils of 25% water content under cold initial temperature. In addition, the pipeline in the sections with more than 50% water contents is designed to be wrapped by a thermal insulation layer of 80 mm to protect the structure. According to the forecast results, heat preservation for the buried pipeline in the island talik permafrost region is strongly recommended. It is also worth mentioning that the used thermal insulation layer can become invalid due to its damage and water immersion after operation. This might seriously impact on the soils around the pipeline and cause freezing. Subsequently, a certain heave deformation may occur under the pipeline and result in danger. The value of soil frost heave can be applied to further mechanical calculation about the buried pipe. The research results will provide references for risk evaluation and site management of the buried pipelines in island talik permafrost regions.
5. Conclusions
The model of the soil temperature fields around a large-diameter buried pipeline in the island talik permafrost region was established with taking into account the phase change in the heat transfer process. The characteristics of soil freezing and heaving were determined on the basis of the segregated potential frost heave model and the CRCOP engineering. The annual maximum freezing circles and the maximum frost heaves under the conditions of two initial soil temperatures and other factors were obtained by numerical calculation. The following conclusions were drawn from the present study.
The annual maximum freezing circle around the buried oil pipeline narrows with the elapse of time. It also increases with the decreases of oil temperature and water content of soils under the same other operation conditions. The development of the annual maximum frost penetration has the same pattern. The thermal insulation layer can effectively restrain the freezing of unfrozen soils around the pipeline in island talik permafrost region. Close attention should be paid to the damage and failure of the insulation layer.
The combined effects of temperature gradient and frost penetration result in a complicated relationship between the maximum frost heave and water content in soils. The maximum amounts of frost heave emerging in the sections of island talik with 35% and 55% water contents under cold initial temperature are larger than those in the sections with 20% and 25% water contents. The maximum frost heaves may exceed the allowable value of deformation except for the section with 20% water content under hot initial temperature and the section with 25% water content under cold initial temperature.
Conflict of Interests
The authors declare that there is no conflict of interests regarding the publication of this paper.
Footnotes
Acknowledgments
The support by the National Science Foundation of China (nos. 51176204 and 51325603) to this study is acknowledged and highly appreciated. The first author would like to thank the Japanese Ministry of Education, Culture, Sports, Science and Technology for its support in the form of the scholarship.