
Abstract
An aerodynamic and aeroacoustic investigation of the multiblade centrifugal fan is proposed in this paper, and a hybrid technique of combining flow field calculation and acoustic analysis is applied to solve the aeroacoustic problem of multiblade centrifugal fan. The unsteady flow field of the multiblade centrifugal fan is predicted by solving the incompressible Reynolds-averaged Navier-Stokes (RANS) equations with conventional computing techniques for fluid dynamics. The principal noise source induced is extracted from the calculation of the flow field by using acoustic principles, and the modeled sources on inner and outer surfaces of the volute are calculated with multiregional boundary element method (BEM). Through qualitative analysis, the sound pressure amplitude distribution of the multiblade centrifugal fan in near field is given and the sound pressure level (SPL) spectrum diagram of monitoring points in far field is obtained. Based on the analysis results, the volute tongue structure is adjusted and then a low-noise design for the centrifugal fan is proposed. The comparison of noise tests shows the noise reduction of improved fan model is more obvious, which is in good agreement with the prediction using the hybrid techniques.
1. Introduction
In order to learn more about centrifugal fan noise, a lot of researches based on experiment and numerical calculation were carried out by many scholars in the past few decades. Experimental study on the source of tonal noise from centrifugal fans shows that the source region is concentrated in the vicinity of the volute tongue [1]. As there are multiple blades in this type of fan, the structure is compact structure. It is difficult to capture the internal flow field information of the fan by test. Numerical approaches have been used to understand the unsteady flow fields and mechanisms of noise generation by fans. Reynolds-averaged Navier-Stokes (RANS) equations are used in conjunction with Ffowcs-Williams and Hawkings’ far-field model to predict dipolar tonal noise from a centrifugal fan [2].
Conventional acoustic prediction method is to calculate unsteady flow field, in which time step must met the computational fluid dynamics (CFD) accuracy requirements and then to get the changing process of pressure on the sound source surface. On this basis, the FW-H equation is solved to predict the generation and propagation of sound, in which the integral sound source data in time domain need to be processed into sound propagation signal. As is known, in near field, fluid parameters are affected seriously by turbulence, and the various assumptions that apply to FW-H equation are unable to meet. So, acoustic analogy cannot simulate aerodynamic noise accurately in the near field. For example, acoustic analogy integration module of CFD software cannot simulate the internal sound like the pipe noise or semifree field, because the Green Function applied to FW-H equation by simulation is false; meanwhile, there may be other factors such as acoustic refraction and reflection, while, in single FW-H equation, these factors are not considered.
However, from the physical standpoint of sound generation and propagation, acoustic waves in internal flows are influenced by interference between the wall and noise sources in addition to interference between the noise sources themselves [3]. Interference between the wall and noise sources leads to modal solutions in internal acoustic fields [4]. Therefore, in this paper, to analyze the internal aeroacoustics of the fan, we employed a hybrid method consisting of two steps: flow-field prediction and prediction using modeled sources of noise induced in internal flows. The flow field around the rotating fan was predicted with conventional CFD techniques. Then, aeroacoustic sources were extracted from information on unsteady flow fields. This was numerically realized using the boundary element method (BEM). The proposed method was validated by comparing computational results with experimental data.
2. Method
2.1. Model
The main object is a multiblade centrifugal fan (in Figure 1). The basic geometric parameters of the fan are shown in Table 1.
Main structure parameters of the multiblade centrifugal fan.


The model of multiblade centrifugal fan.
2.2. Grid
The main fan parameters were transformed into a complete three-dimensional computer-aided design (CAD) model and saved into the shielded twisted pair (STP) format in order to build grid model using the structured grid technology by the Integrated Computer Engineering and Manufacturing (ICEM). The grid refinement has been studied and adapted to meet required solver precision in high gradient regions.
According to Figure 2, about 6.7 × 10⁶ cells grid was considered sufficient to ensure mesh independence for the three-dimensional configuration. In order to use the formula to describe the flow in the logarithmic law layer [5], the dimensionless parameter y+ is introduced:

where u is time average velocity; uτ is wall velocity; Δy is the distance from the mass center of the first layer grid to the wall.

The grid model of impeller and volute.
In this paper, the y+ near the boundary wall was lower than 100 to ensure the first node in the region of the fully developed turbulence.
2.3. Boundary Condition and Setting
Total pressure inlet condition (1 atm) was applied to simulate drawing air from ambient. Mass flow rate (0.233 kg/s) was applied at the outlet [6, 7]. A second order discretization of convection terms was applied, and the transient terms were approximated by a second order backward Euler scheme, which provides higher accuracy for rotating or swirling flows solved on quadrilateral or hexahedral meshes. The maximum residue is lower than or equal to 10−5. The sliding mesh technique was applied to the interfaces in order to allow the unsteady interactions between the impeller and the volute. The results of the steady simulation served as the initial condition for the unsteady calculation. Each time step spanned Δt = 2.001e − 4s. The chosen time step was related to the rotational speed of the impeller and it was small enough to get the necessary time resolution and to capture the phenomena of the pressure fluctuations. Sampling begins when it is stable after calculation for 10 cycles.
3. Results and Discussion
Figure 3 shows the diagram of the experimental system for the aerodynamic performance, where an outlet chamber is established to measure the related physical parameters [8]. The discharge static pressure of the tested fan is measured using a pressure transducer installed in the chamber. In the aerodynamic performance measurement, the tested fan is mounted on the wall of the test chamber to simulate free inlet and free outlet conditions.

Fan tester.
To validate the accuracy of numerical result, experimental and numerical performance curves of the forward bending centrifugal fan are presented in Figure 4. It, respectively, shows pressure-flow curve and efficiency-flow curve under different working conditions. The maximal relative error of the pressure coefficient

Pressure-flow curve and efficiency-flow curve.
In order to observe the pressure distribution inside the impeller passage, we divide the impeller to get three sections, namely, at 25%, 50%, and 75% of the blade height, which are shown in Figure 5(a). And Figure 5(b) shows the section of one internal passage.

The diagram of different blade sections.
The relative static pressure distribution of blade on different sections can be seen in Figure 6: the distributions of blade suction surface (SS) and pressure surface (PS) on the section of 25% blade height are different from those on 50% or 75%. The distribution curve on the section of 25% blade height presents a trend of increase in pressure from inlet to outlet; by contrast, the pressure distributions on the sections of 50% and 75% blade height show a trend of decrease from inlet to outlet. The pressure of the section of 25% blade height at the end of the outlet is obviously larger than that of other sections. As fluid enters into the axial direction of a rotor and goes on to the volute through the radial direction of an impeller, an inactive zone is generated at the entrance of the impeller and its size is not uniform in both the axial and radial directions.

The pressure distribution of blade on different sections.
Such uneven distribution of pressure is bound to influence the velocity distribution, and, therefore, in order to learn more about the flow field, it is necessary to observe the velocity distribution of the sections of different blade height at the outlet.
Figure 7 shows the velocity distribution of the three sections at impeller outlet, from which it can be seen that nonuniform flow velocity occurs near both ends of SS and PS. It is notable that the velocity of 25% section shows an alternating characteristic, and, from the velocity vector distribution of this section, it can be seen that reflux tends to occur near the front cover of impeller (namely, the area near inflow). The unevenness of velocity tends to cause the generation of jet wake, of which the impacts on volute passage are different among the three sections of different blade heights.

The velocity distribution at impeller outlet.
The unsteady interaction between the rotating impeller blades and the stationary volute is considered to be aerodynamic noise source. As fluid gets out from the impeller outlet and rushes into the volute, pressure pulsation is generated at dynamic and static coupling area. In order to study the impact of pressure pulsation on the fan noise, the monitoring points of pressure pulsation are set in volute per 60°, as shown in Figure 8.

Monitoring points.
The relative static pressure time domain diagram of points 0~5 is shown in Figure 9. In this figure, the pressure appears to be a sinusoidal distribution. With the migration of monitored position, static pressure amplitude increases gradually. Pressure fluctuation in point 0, as shown in the diagram, is larger than other points.

The time domain of pressure fluctuation.
The pressure pulsation time domain diagram shows the pressure fluctuation value at each monitoring point tends to decrease along the rotating direction of impeller. In the position of volute tongue, the fluctuation range of the relative static pressure is the largest, while, in the volute outlet, the fluctuation range is the smallest. Based on the analysis above, the predicted position where the pressure pulsation amplitude is larger is consistent with the location where flow field is deteriorated. In order to get a further recognition about the influence of pressure pulsation on the internal acoustic performance of the fan, the following of the paper will explain it with acoustic theory.
This paper employed the Ffowcs Williams-Hawkings (FW-H) equation to predict the acoustic pressures and to study the acoustic benefit of the acoustic analogy. The acoustic analogy had been originally formulated by Lighthill, and then the method was promoted by Curle, Ffowcs-Williams and Hawkings. The generalized Lighthill theory is described using FW-H equation
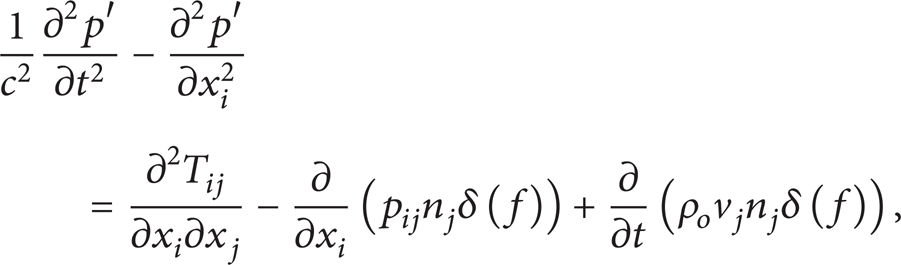
where p′ = p − p o is fluctuation pressure (equal to acoustic pressure when in far sound field), c and t are sound pressure and time, while x i and v j are space coordinate and velocity, respectively. Consider

T ij is Lighthill stress tensor. And n j is the unit outward normal vector to the surface, ρ and ρ o are the density of air flow and averaged density of air flow, respectively. p ij = (p − p o )δ ij − τ ij is the compressive stress tensor including the viscous stress and surface pressure, τ ij is viscous stress tensor, and δ ij is Kronecker symbol. Dirac delta function is denoted by δ(f). The noise source terms on the right-hand side of (2) are known as the quadrupole source, dipole source, and monopole source, respectively, among which the dipole source is caused by loading, and the monopole is influenced by thickness. The effect of the quadrupole source on the sound pressure on the surface of the fan can be neglected. The dipole source is the main source of fan.
Considered the dipole source in the FW-H equation, p ij would be simplified to (p − p0)δ ij in (3), then we can get the Helmholtz equation at fundamental frequency domain by fast fourier transformation (FFT)

where K = w/c is the wave number. For stationary objects such as volute, by applying the Green Function for the wave equation in unbounded space, the three-dimensional Green Function can be expressed as
where r o and r s are field position vector and source position vector, respectively. P(r s ) = − (p − p o ) is the fluid pressure on surface, which composes the dipole source.
BEM is applied in the paper to calculate dipole source sound field in the outer surface of the volute, in which the grid must be a closed one. The calculation of grid is shown in Figure 10. Both surface sound pressure and normal velocities are major variables of BEM. Acoustic models of inner and outer boundary elements are established in LMS SYSNOISE, representing the internal and external sound fields of volute, respectively, which are coupled through the volute inlet and outlet. Meanwhile, the volute is regarded as completely rigid, and thus the wall normal velocity of the radial sound pressure pinc′(r o ) acoustic projection and acoustic radiation is 0. The total sound field is the overlap of acoustic projection and acoustic radiation. The value of surface sound pressure fluctuation obtained from CFD is inserted in the volute surface of internal acoustic model, and the fundamental frequency component of pressure fluctuation (fundamental frequency dipole source) can be obtained through Fourier transform.

Mesh of acoustic calculation model.
Figure 11 shows the sound pressure amplitude distribution of the sound source in the volute surface, where a big change in pressure amplitude can be observed in the surface of volute tongue, which may be affected by the bell mouth. The value of the sound pressure amplitude fluctuates in a wide range, and it decreases gradually along the rotating direction of impeller. The distribution of sound pressure amplitude is uneven in the position where the biggest sound pressure amplitude appears, near the section of 25% blade height (the area near inflow). The distribution of the sound source strength is consistent with characteristics of the flow field distribution discussed above, which proves that the noise distribution rule of near field can be revealed qualitatively with the hybrid method of combining flow field and sound field, to lay a foundation for the research of far field noise.

Pressure amplitude distribution of volute at fundamental frequency.
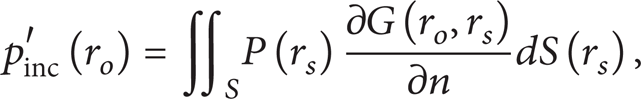
To study the far field noise, four monitoring points were established in the sphere formulated with the radius 1.414 m and the center of test fan as the center of the circle according to global grid envelop method. The points A, B, C, and D represent left, front, right, and back of the fan, respectively, as shown in Figure 12.
Global grid envelope method.
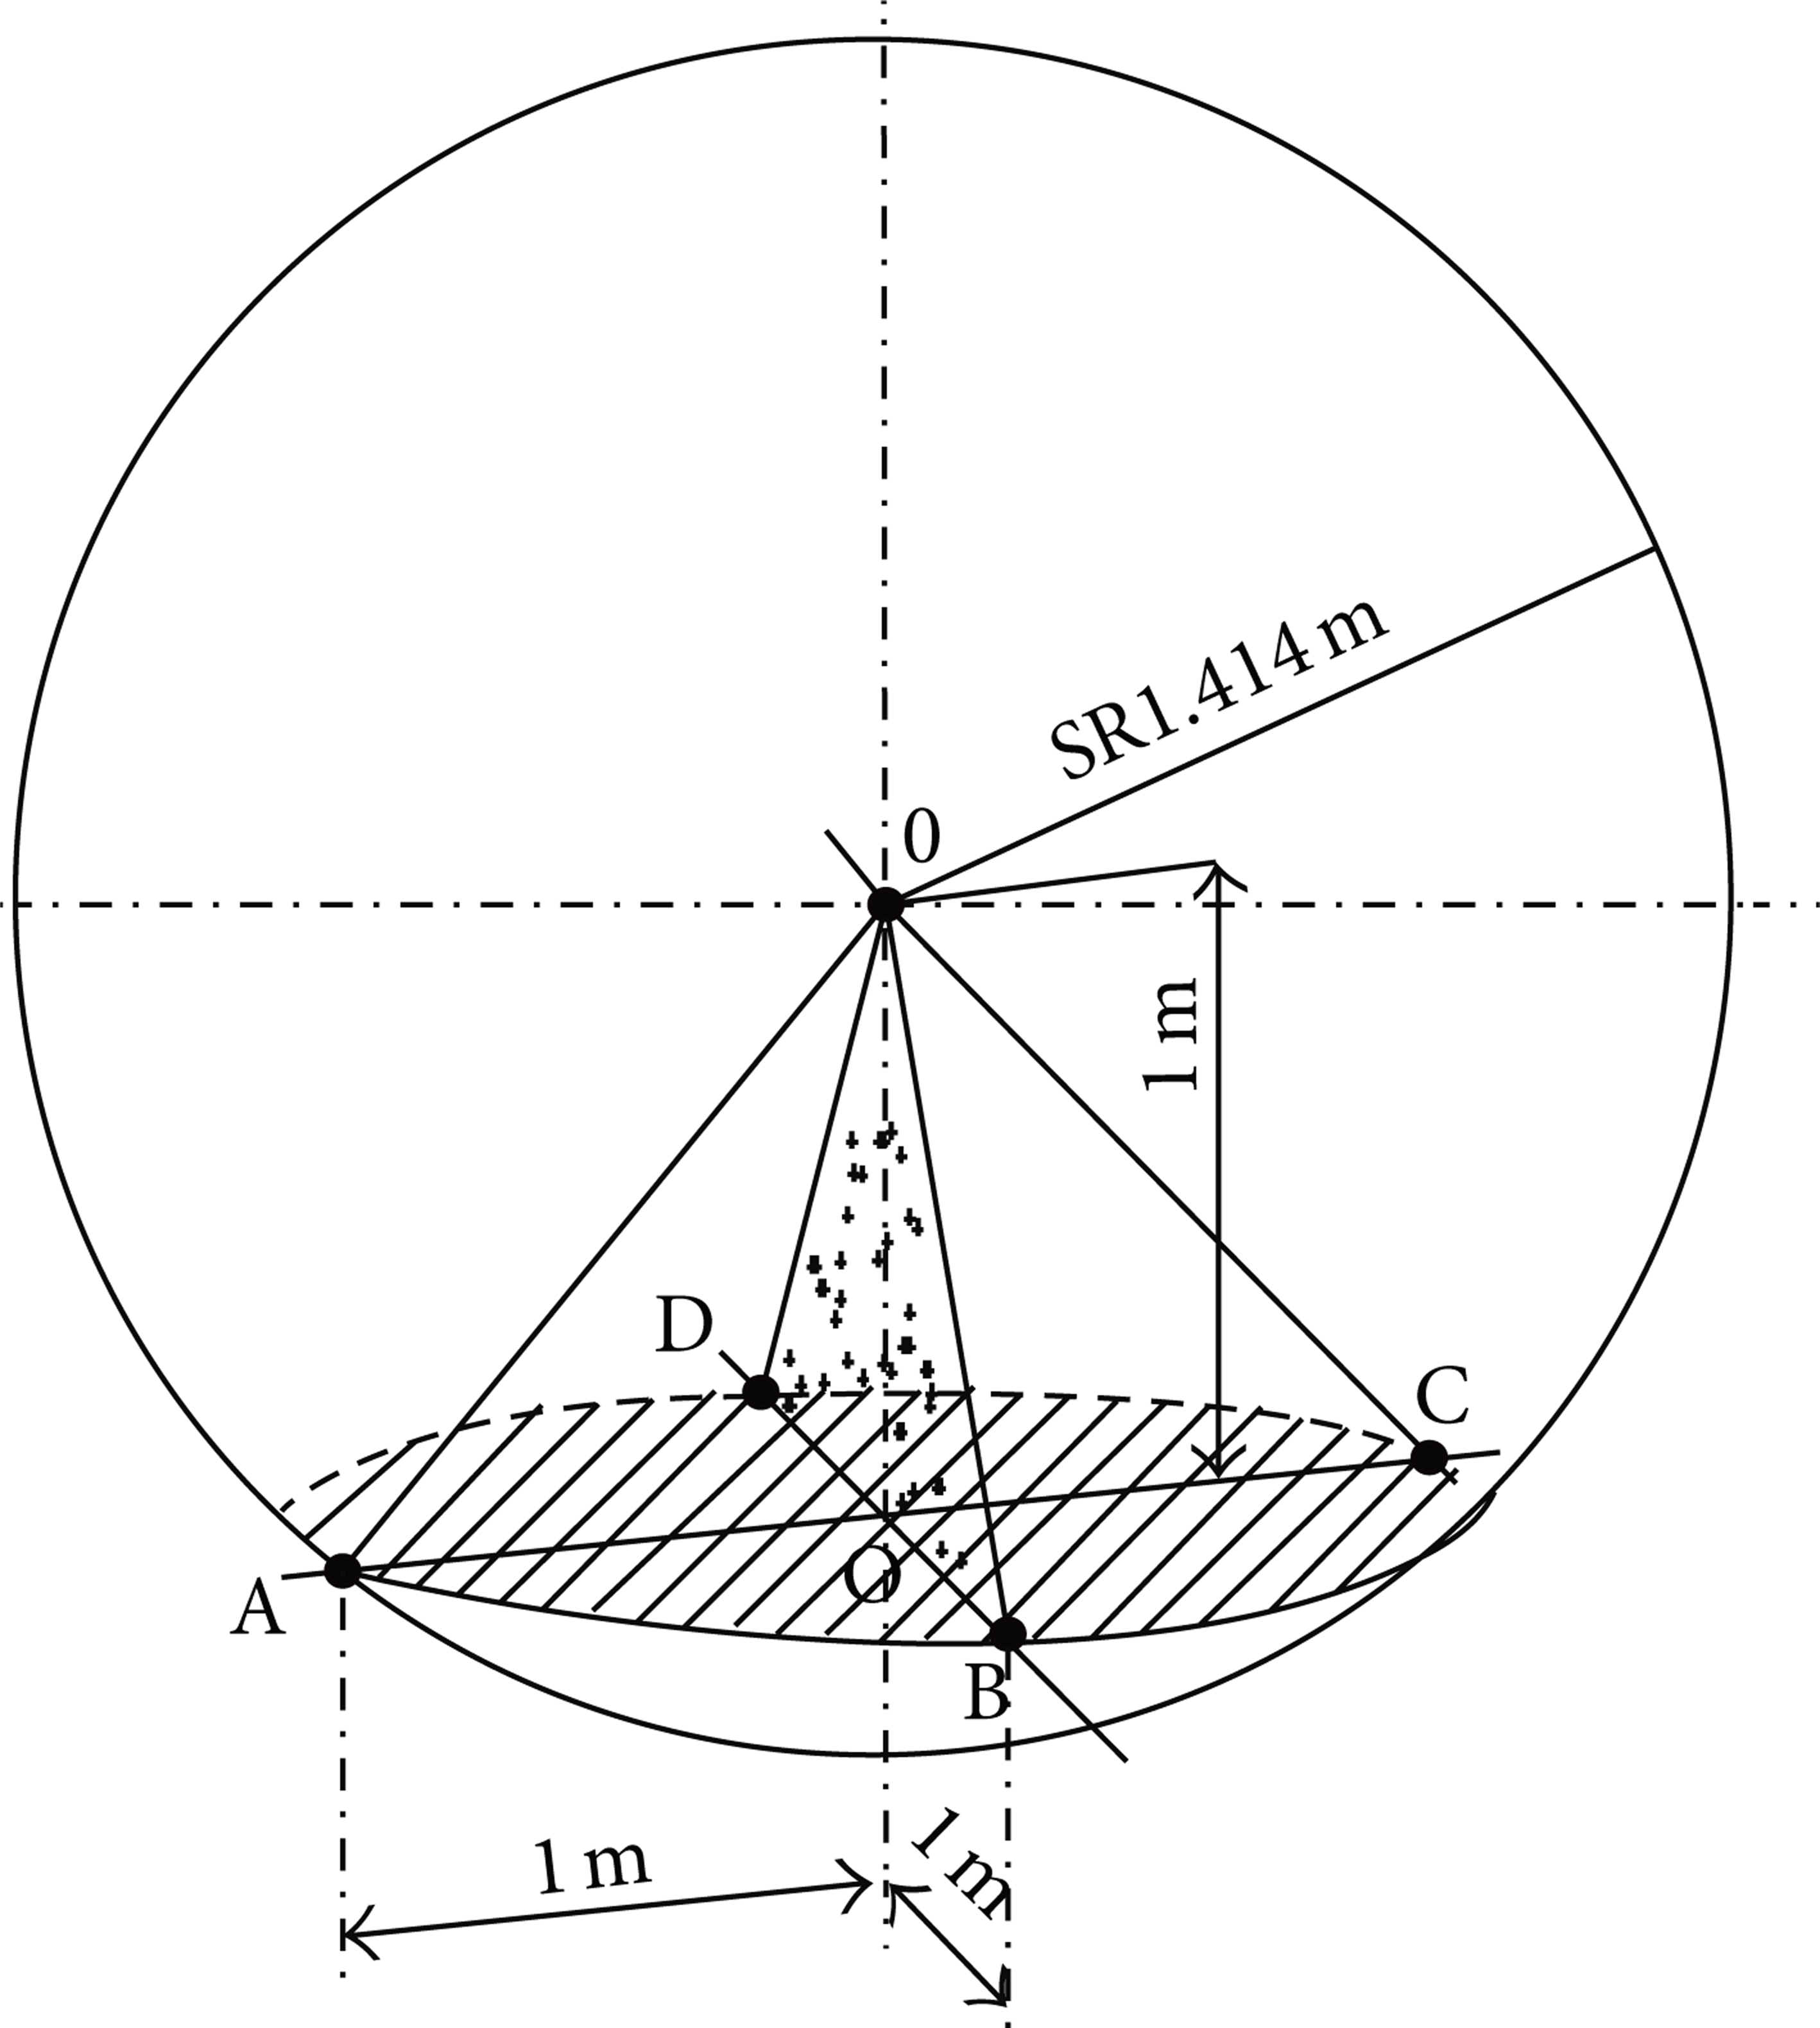
From Figure 13, the frequency spectrograms of the SPL at different monitoring points can be seen as follows: (1) the SPL distribution in the front of far field noise of fan (point B) is almost identical to that in the back (point D), and the SPL is the biggest at the blade passing frequency (BPF); (2) the distributions in the left (point A) and the right (point C) differ from each other greatly; however, the SPLs of both them are increased at the fundamental frequency and the peak value occurs at the BPF and its multiple frequency.
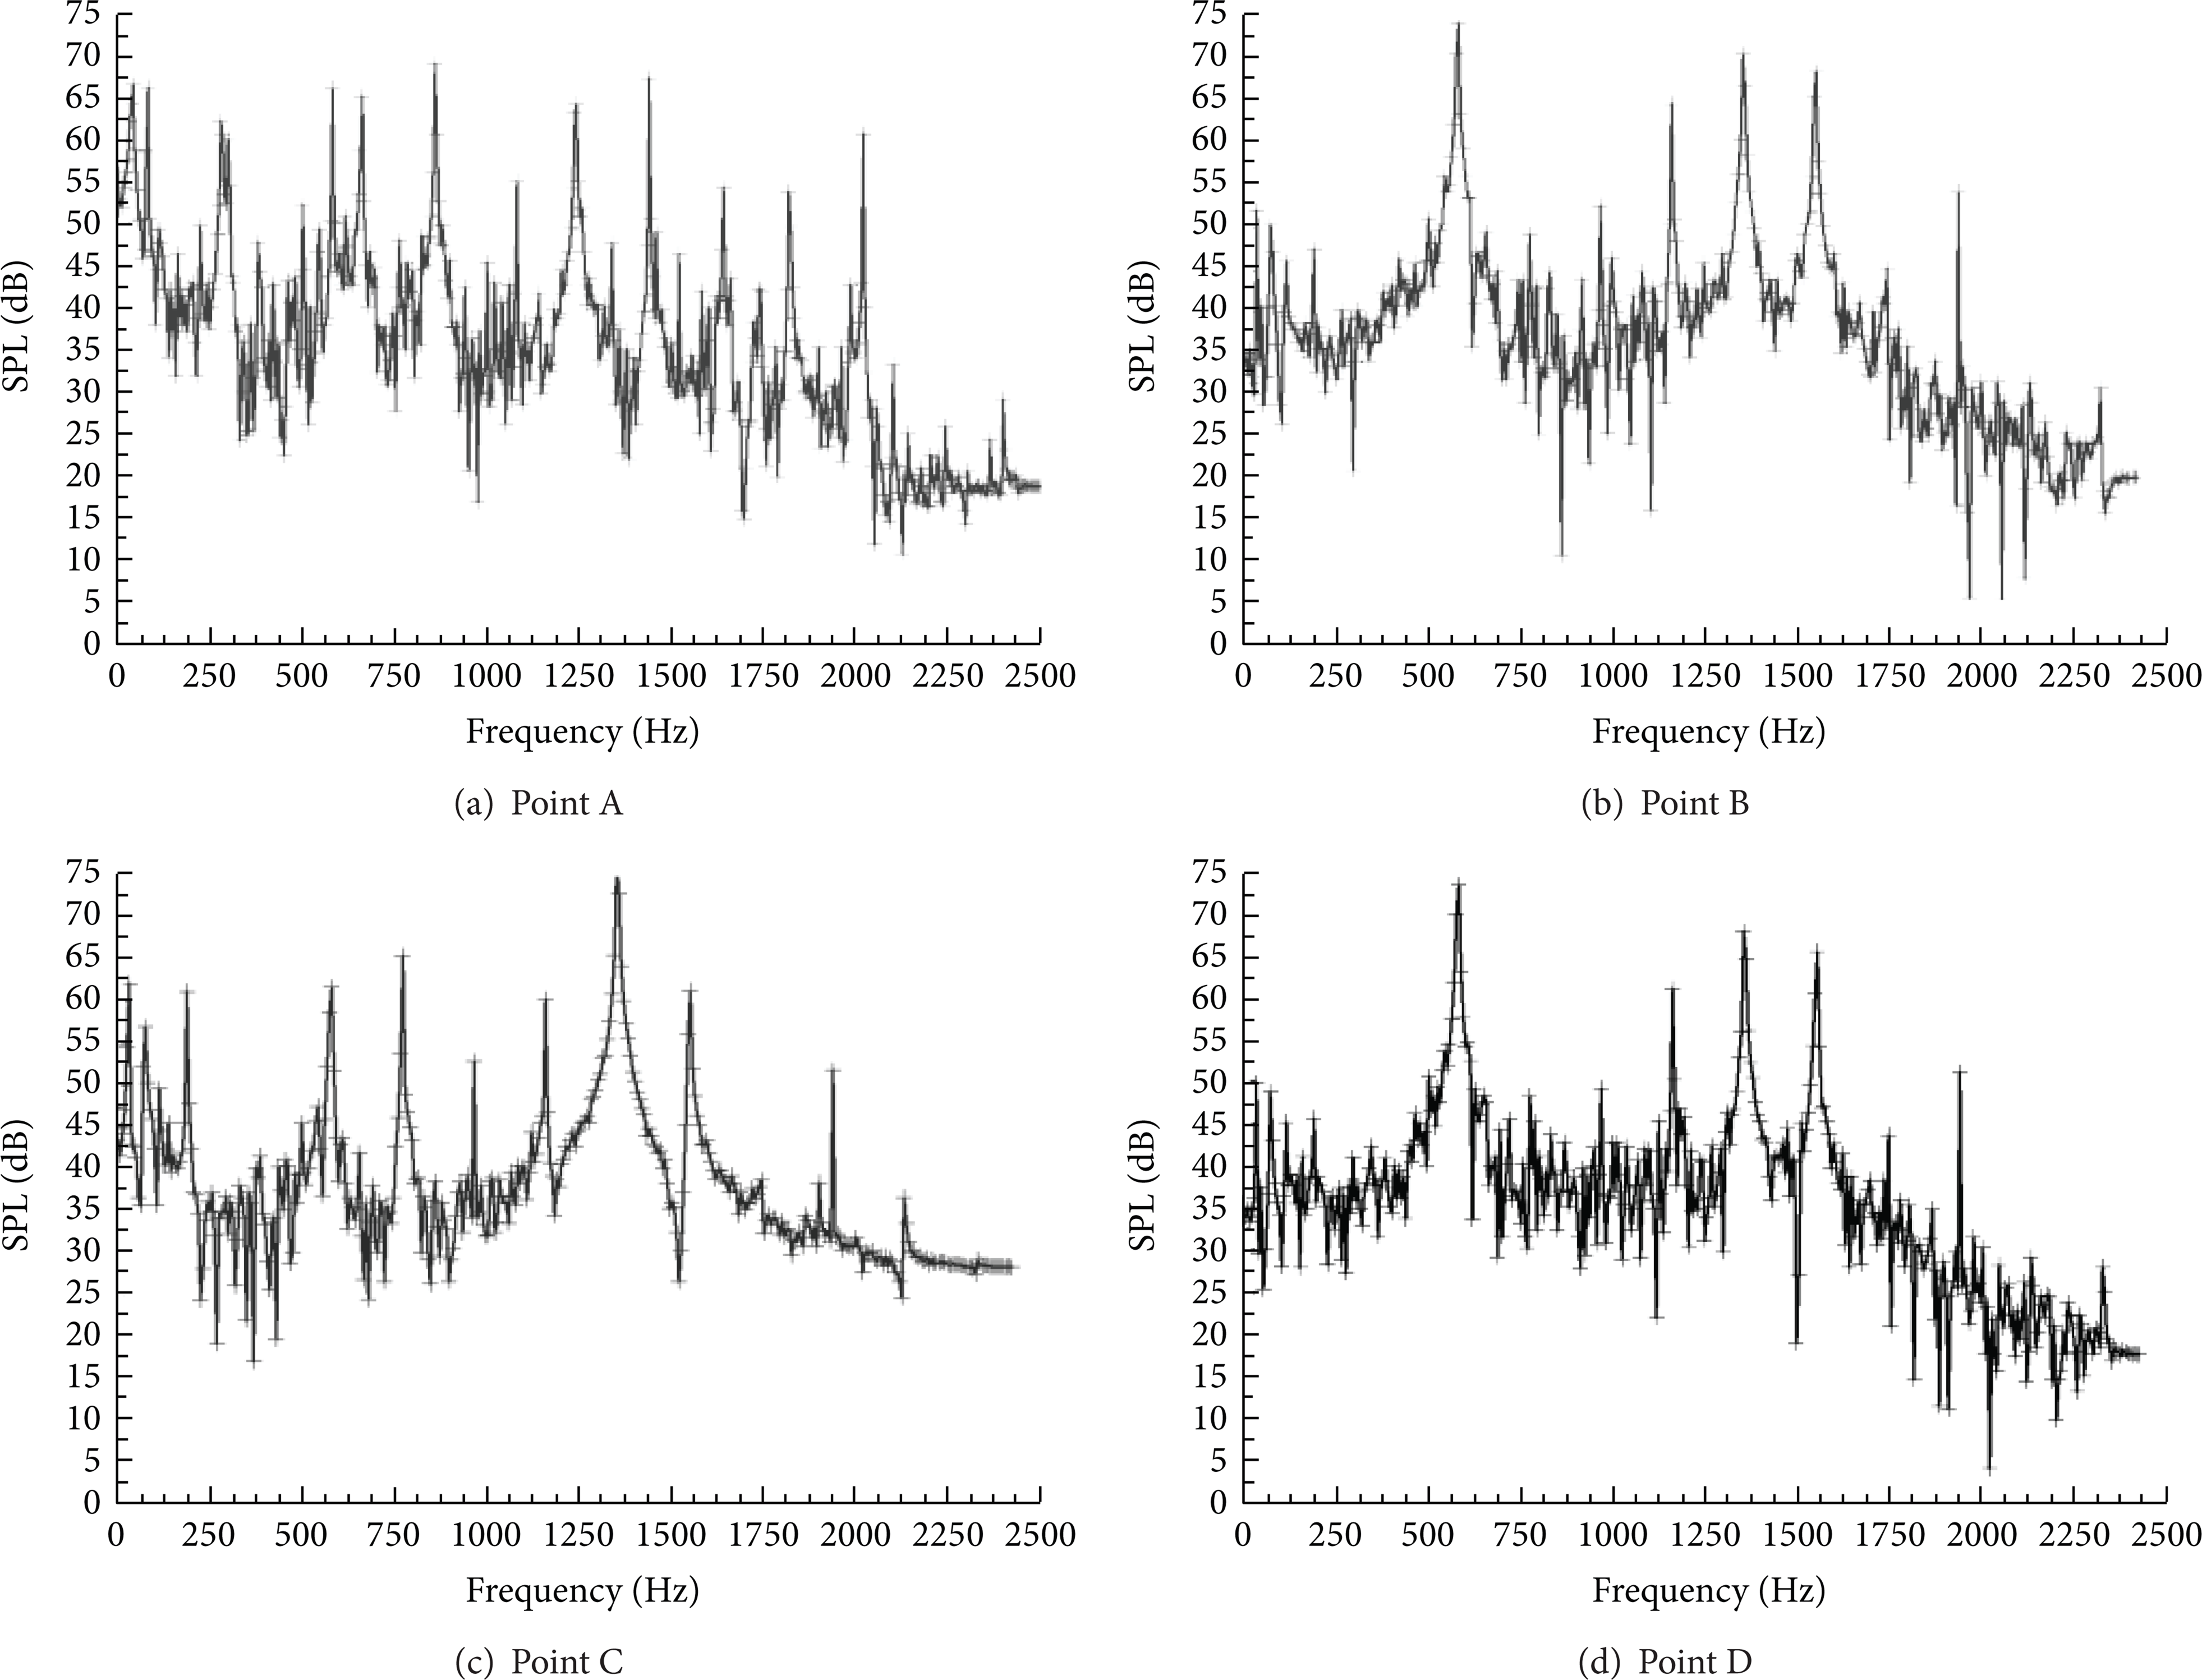
Frequency spectrograms of the sound pressure level at different monitor points.
The influence from rotation noise is analyzed by comparing the four points in frequency spectrograms. And the frequency spectrograms present a discrete distribution; besides, the SPLs of point A and point C are influenced significantly by low-frequency noise, which may be caused by the turbulent noise of the internal flow. In order to testify the assumption above, we created a circle with the radius 1 m based on the plane of points A, B, C, and D in Figure 12. Figure 14 is the sound source amplitude distribution of the plane at fundamental frequency in far field, from which it can be seen that the sound source amplitude values in the left and the right are higher, while the ones in the front and the back are lower relatively. The distribution characteristics accord with the conclusion from the monitoring points.

Pressure amplitude distribution of volute at far field.
To get a comprehensive, intuitive, and clear recognition of far field noise distribution, the virtual global envelope was established for the fan model. The sound field grid needs to be closed in direct boundary element and global envelope grid needs to be established for fan model based on the CFD results obtained in near field. The center of the sphere is the symmetrically rotating center of the impeller of the fan, of which the radius is 1.414 m, shown in Figure 15. Figures 15(a) and 15(b) show the far field noise distribution of the fan is more symmetrical with the minimum distribution in the front and the back, as well as the maximum distribution in the top and the bottom. Figure 15(a) shows the whole distribution far field noise vividly, providing basis for the qualitative analysis of sound source propagation.
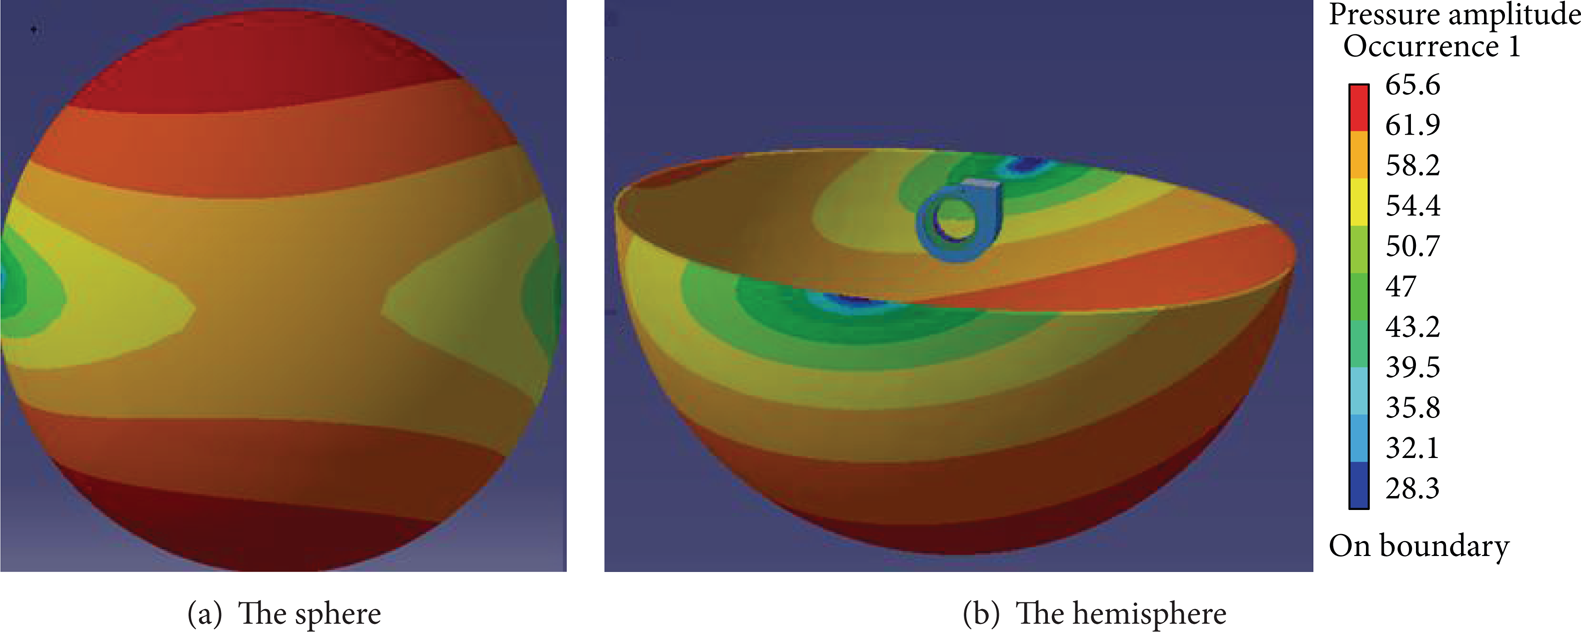
Pressure amplitude distribution of volute at far field.
The location of tongue near the front cover in volute was adjusted with the analysis result of flow field and sound field stated above. Tongue position angle was defined as α, shown in Figure 16. The preliminary values were taken as 53°, 58°, and 63°; however, the taken values need to guarantee the flow-rate and the pressure performance parameters of the new structure are no less than the original one [9]. The three groups of volutes with tongue position angle are modeled and the rationality of the three degrees are discussed. The flow reduction is significant when α = 53° and α = 58°, and the flow-rate and the pressure meet the requirement of fan index when α = 63°, which can be seen from numerical simulation. The distribution of near field sound source strength in new structure was analyzed by using direct BEM, as in Figure 17. It can be found that the maximum value of near field sound source strength becomes reduced with new structure, and the sound pressure amplitude in the volute tongue is lower than the original model.

The diagram of volute tongue position angle.

Pressure amplitude distribution of improved volute at fundamental frequency.
In order to verify the effect of the new volute structure, the product was processed, as shown in Figure 18. The experimental measurement has been carried out in a semianechoic chamber (see Figure 19). The useful size of the hemianechoic chamber is 6.1 m long by 2.8 m wide by 3.6 m high. All round surfaces are filled with mineral wool wedges that are 59 cm deep, which has a good absorption characteristics at frequency above 150 Hz.
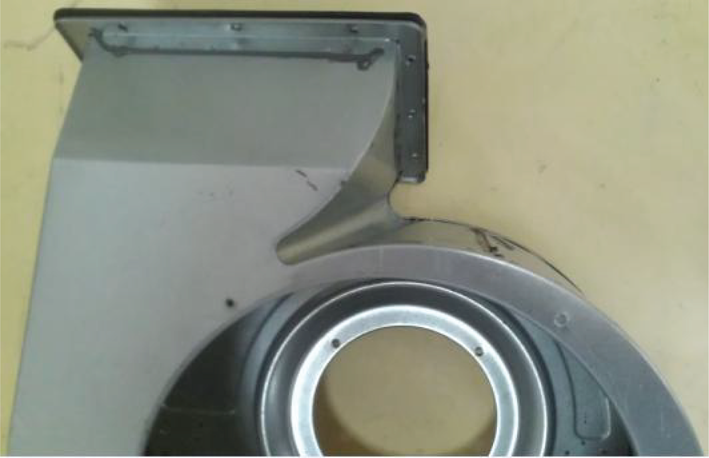
The new structure of volute.

The semianechoic chamber.
The control chamber is equipped with 3560C sampling and analyzing system from B & K Corporation in Denmark and 7700 type acoustic and vibration analyzing software, including FFT, CPB (1/3 octave analysis), and total-level analyzer. The comparison result of calculated data and measured data is shown in Figure 20. Obviously, the sound pressure level of the fan with new structure has been improved at low-frequency band, the sound pressure level is lower than the original one at BPF and its multiple frequency, and the noise-reduction effect is remarkable.

The test results of both the original fan and the improved one.
4. Conclusion
By using CFD and acoustic simulation calculation, the aerodynamic noise of the multiblade centrifugal fan is predicted. The influence of volute structure on radiation noise is researched qualitatively, and the volute tongue position angle is adjusted. Through the experimental tests for the reliability of reasonable assessing method, the feasibility of whole machine noise-reduction design has been testified.
Firstly, the unsteady interaction between the rotating impeller blades and the stationary volute was considered to be aerodynamic noise source. The sound pressure amplitude of the whole volute changes in a wide range, and it decreases gradually along the rotating direction of impeller. And the frequency spectrogram mainly presents a discrete distribution, the sound pressure level increases at the fundamental frequency, and the peak value occurs at the BPF and its multiple frequency.
Secondly, a comprehensive, intuitive and clear recognition of far field noise distribution was given. It shows the far field noise distribution of the fan is more symmetrical with the lowest distribution in the front and the back, as well as the maximum distribution in the top and the bottom. The mounting location of tongue near the front cover in volute is adjusted to reduce sound source strength distribution. Through the experimental tests, the noise-reduction effect of improved fan is verified. This proposed method may be applied to performance optimization for multiblade centrifugal fan and the aerodynamic noise prediction in future.
Conflict of Interests
The authors declare that there is no conflict of interests regarding the publication of this paper.
Footnotes
Acknowledgment
The project has been supported by the Natural Science Foundation of China, Grant no. 51276070.