
Abstract
A series of orthogonal tests have been designed to investigate the combined effects of aging temperature, time, predeformation, and part thickness features on the springback of creep age forming of 2524 aluminum alloy sheets. Two springback prediction models containing the four process parameters mentioned above are developed based on experimental results and the multiple linear regression method. The comparisons of predicted and experimental values of springback yield good agreement. The dependence of springback on stress gradient across the thickness of sheet is examined in detail, showing that springback increases with the decrease in stress gradient while maintaining the ratio of bending radius to sheet thickness (R0/H) as constant. In addition to springback, the mechanical properties and microstructural evolution are also researched. In the creep age forming process, the compression side of the sheet has higher mechanical properties and is characterized by more and finer precipitates in grains as compared to tension side.
1. Introduction
In the past twenty years or so, creep age forming (CAF) has been selected as the favored metal forming method as it can manufacture large integrated structures, in particular, those used in the aerospace industry, with higher strengths and lower residual stresses compared to conventional metal forming methods [1–4]. Creep age forming is referred to a combined creep and aging treatment process, in which creep during aging is the mechanism to promote forming and retention of the formed shape of the metal and aging treatment can improve the metal's mechanical properties. Although several studies have been carried out on creep and aging as individual processes, many problems are posed when two phenomena are combined into one in CAF. One of the greatest challenges is that the springback of formed component inevitably occurs.
Springback occurs because of limitations on the maximum usable temperature and the forming time dictated by microstructure requirements [5, 6]. High levels of springback often result in the formed component being out of tolerance, extra after-work problems during final assembly, and also deficient aerodynamic behavior. For large integrated aircraft panels, the amount of the springback can reach up to a total strain of approximately 70% [5, 7]. Narimetla et al. [8] stated that a good estimate of springback was able to minimize costly and time-consuming trial and error. Therefore, the accurate prediction of springback arising after formation is highly important, in that a tool may be defined to compensate for it, increasing the accuracy of component and reducing the fabrication cost. With the intention of predicting springback, significant efforts have been made over the years. Gardiner [9] originally proposed the basic two-dimensional springback theory. He showed that the springback is proportional to the ratio of yield strength to elastic modulus, σ y /E, and to bend ratio, R/H, where R is the tool radius and H is the sheet thickness. Jeshvaghani et al. [6] claimed that springback increased with decreasing time and temperature and found the appropriate forming cycle (150°C/24 h) for AA7075. Jeunechamps et al. [5] established an efficient numerical method and program to predict springback in CAF of aluminum shell components. Sallah et al. [10] developed a mathematical model for autoclave age forming of aircraft wing panels. Beam specimens were used to demonstrate the modeling process. It was found that a closed form solution can be obtained for a tool in the shape of a circular arc, but not for other tool shapes.
Although the researches discussed above are concentrated on the springback of formed aluminum alloy sheets, there is no literature concerning (i) the combined influences of aging temperature, time, part thickness, and predeformation features on springback and (ii) the evolution of springback with stress gradient while maintaining the bend ratio (R/H) constant. In this research, using AA2524 as model material, two corresponding springback prediction models are derived theoretically based on experimental results and multiple linear regression and their capacities to predict springback are validated by a set of tests; the dependence of springback on the stress gradient is formulated while the ratio of bending radius to thickness remains unchanged; mechanical properties and microstructures of formed AA2524 sheets are analyzed in order to gain an excellent combination of springback and properties.
2. Experimental
2.1. Test Materials
The starting materials, AA2524, were provided by a company as the hot-rolled sheets with different thicknesses, that is, 1.6, 3.5, 6, and 8 mm. The exact chemical composition of AA2524 is given in Table 1. Rectangular sheets with 400 mm length and 80 mm width were machined parallel to the rolling direction of the as-received sheets and divided into four groups in terms of thickness, that is, 1.6, 3.5, 6, and 8 mm. Then the rectangular sheets were solution treated at 490°C and water quenched at room temperature. The duration of solid solution treatment for the four group sheets corresponded to 35, 52, 56, and 65 minutes, respectively. Subsequently, the sheets were kept in refrigerated condition to reduce natural aging.
Chemical compositions of 2524 aluminum alloy (in wt.%).

2.2. Test Tool
A novel toolset capable of deforming sheet into complex curvatures, such as single or double curvature, by changing the bars’ positions in the forming die was designed and shown in Figure 1. In the current positions of bars in Figure 1, pure bending moment and single curvature occur in the b regime of the material sheet with the analysis of shearing force and bending moment.

Line diagram of (a) creep age forming toolset and (b) forming die.
2.3. Forming Test
Creep age forming tests were carried out for the four group sheets at temperatures ranging from 100 to 190°C for a duration of 4–16 h. The experimental procedure can be summarized as follows.
Step 1. First, the sheet was placed on the lower support bars of the tool. The strain foil was attached to the centre of the lower surface of the sheet to momentarily record the value of strain ε. Thus, the bending radius, R, of the neutral surface of the sheet was obtained by R = y/ε, where y was the vertical distance from the lower surface of the sheet to the neutral surface.
Step 2. The sheet was then deformed into prebending radius of R0 using bolts at the four corners of the tool.
Step 3. Last, the whole assembly was sent into the furnace and heated to a preselected temperature for a controlled amount of time.
Step 4. The test was stopped when the time reached goal value and the assembly was cooled at room temperature for about 30 min before releasing the loads acting on the sheet. After the sheet springbacked, a new strain foil was attached to the centre of the upper surface of the sheet, and then the formed sheet was deformed into initial flat state without any bending. Hence, the bending radius of the neutral surface after springback was calculated by R = y/ε, where y was the vertical distance from the upper surface of the sheet to the neutral surface.
2.4. Mechanical Property Tests and Microstructure Observations
Tensile tests were carried out at room temperature using an INSTRON 5500 machine operating at a constant speed of 2 mm/min. Tensile tests for each test-piece condition were conducted three times and the values of specimen strength took the average. Hardness measurements were carried out on the specimens using Vickers hardness tester (Huayin HV-5). For each specimen, hardness value was given by averaging six values directly measured by applying a load of 2940 mN for a 15 s duration. Microstructure observations were performed with a Transmission Electron Microscope (TEM). The TEM samples were first machined into 80 μm in thickness, followed by standard twin-jet electropolishing using 70% methanol and 30% nitric acid solution at −35 to −25°C cooled by liquid nitrogen, and lastly by anhydrous alcohol cleaning for 2–3 minutes. In the end, TEM samples were observed in JEOL-2010 Transmission Electron Microscope operated at 200 kV.
3. Results and Discussions
3.1. Definition of Springback
Figure 2 shows the schematic diagram for springback definition. Two general methods [5, 7, 11], that is, radius and deflection methods, are introduced to define the springback of creep age forming of aluminum alloy sheet, with the forms:
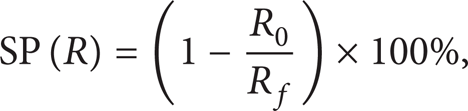

where SP(R) and SP(δ) denote the amount of springback defined by radius and deflection methods, respectively, R0 and R f refer to the bending radius of the sheet before and after the tool is removed, and δ0 and δ f represent the deflection at the centre of the sheet before and after the tool is retrieved. The chosen definition methods, given in (1) and (2), have the advantage of a simple physical interpretation. Both definition approaches of springback are carried out on the same sheet.
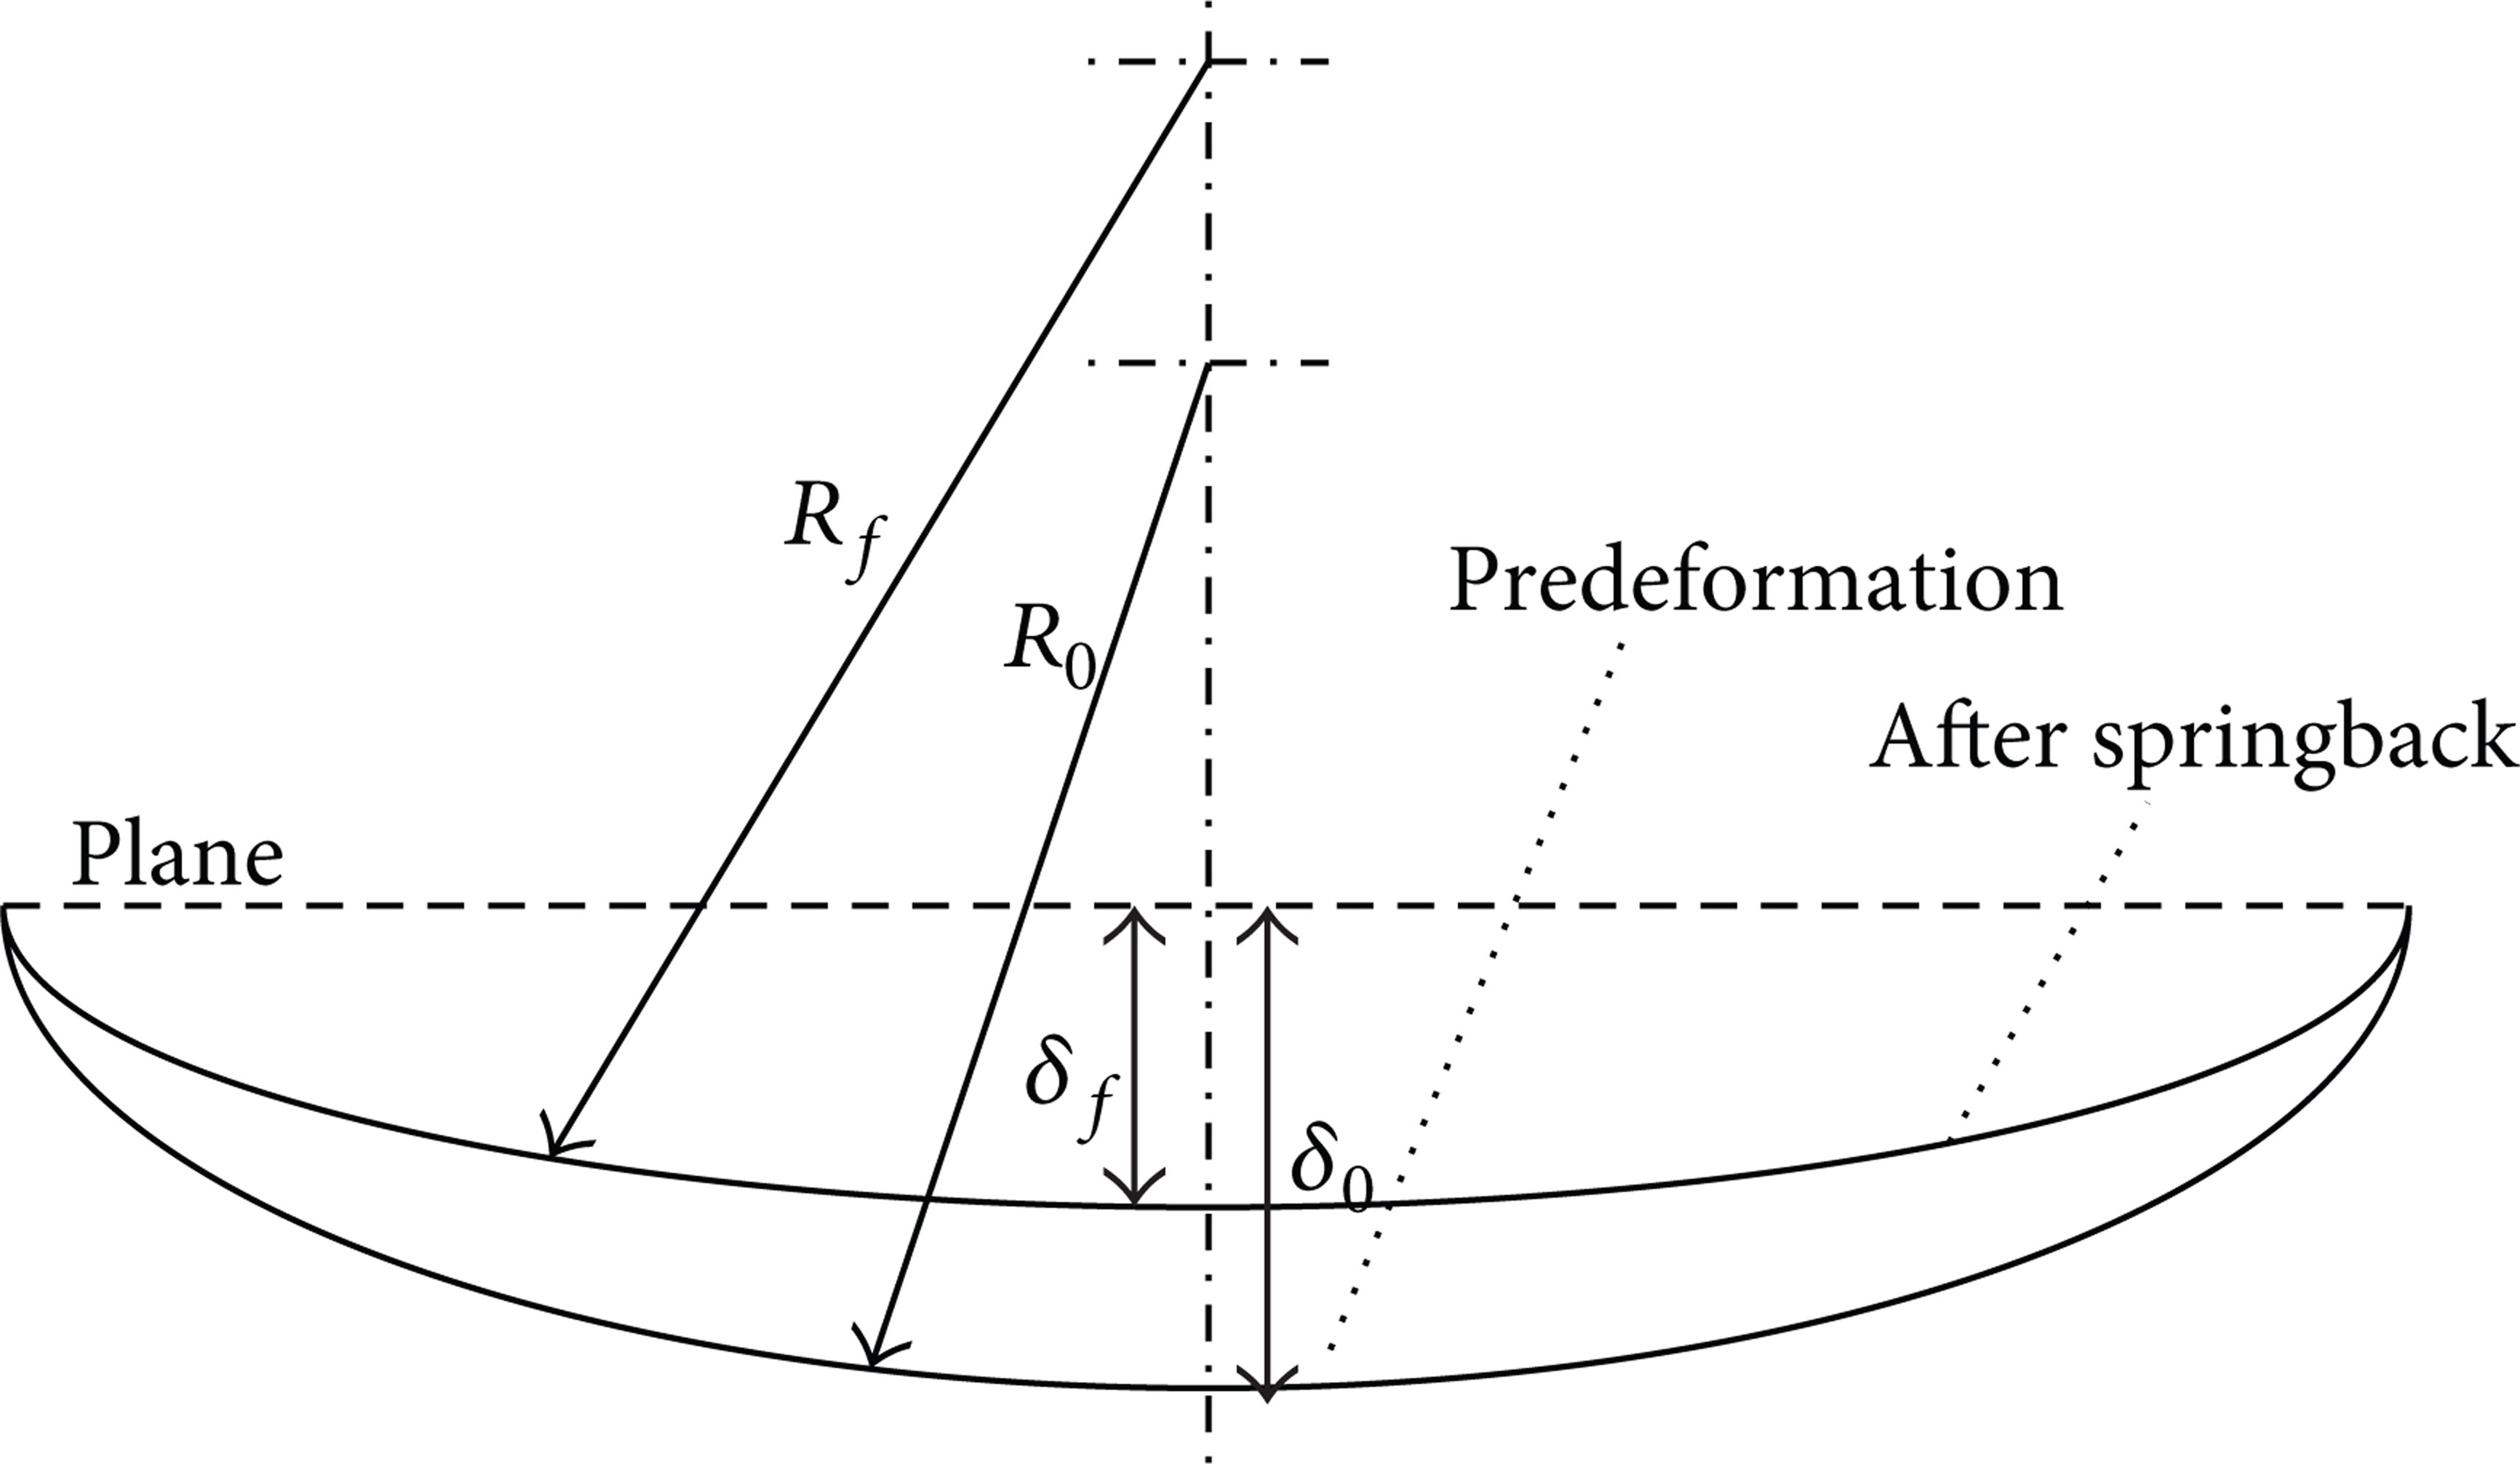
Schematic diagram for springback definition.
3.2. Springback Prediction Models
Several previous investigations [5, 6] have revealed that the springback value of the formed sheet is directly related to process parameters, such as aging temperature, part thickness, holding time, and predeformation radius. By means of orthogonal testing and extreme difference analysis of experimental results, Zhan et al. [12] pointed out the weight sequence of four main process parameters on springback in accordance with the following order: aging temperature, holding time, part thickness, and bending radius. Due to the complications of the mechanism of springback, there is by far no springback prediction model consisting of these parameters. For this study, the quantitative relationship between springback and the four parameters described above is developed.
A series of orthogonal tests designed with aging temperature, holding time, sheet thickness, and bending radius/deflection were carried out and the values of springback calculated by SP(R) and SP(δ) in (1) and (2) are listed in Table 2. On the basis of experimental results and the multiple linear regression method, two springback prediction models involving four principal process parameters were derived by the following forms:


where t is forming time, Tis temperature, H is sheet thickness, and the other symbols have the same meanings defined in (1) and (2). From a mathematics point of view, (3) and (4) are highly justified by the use of F-test and the determination coefficient, r2. For example, in (3) the value of the F-test calculated from experimental data in Table 2 is 34.39, which is much larger than the critical value of 3.36 (F0.05 (4, 11) = 3.36); and the determination coefficient is 0.945. These provide an indication of strong reliability for the springback prediction model. From (3) and (4), it is evident that the springback value increases with the increasing initial bending radius and decreasing holding time, temperature, part thickness, and initial bending deflection, which is consistent with the previous investigations [5, 6].

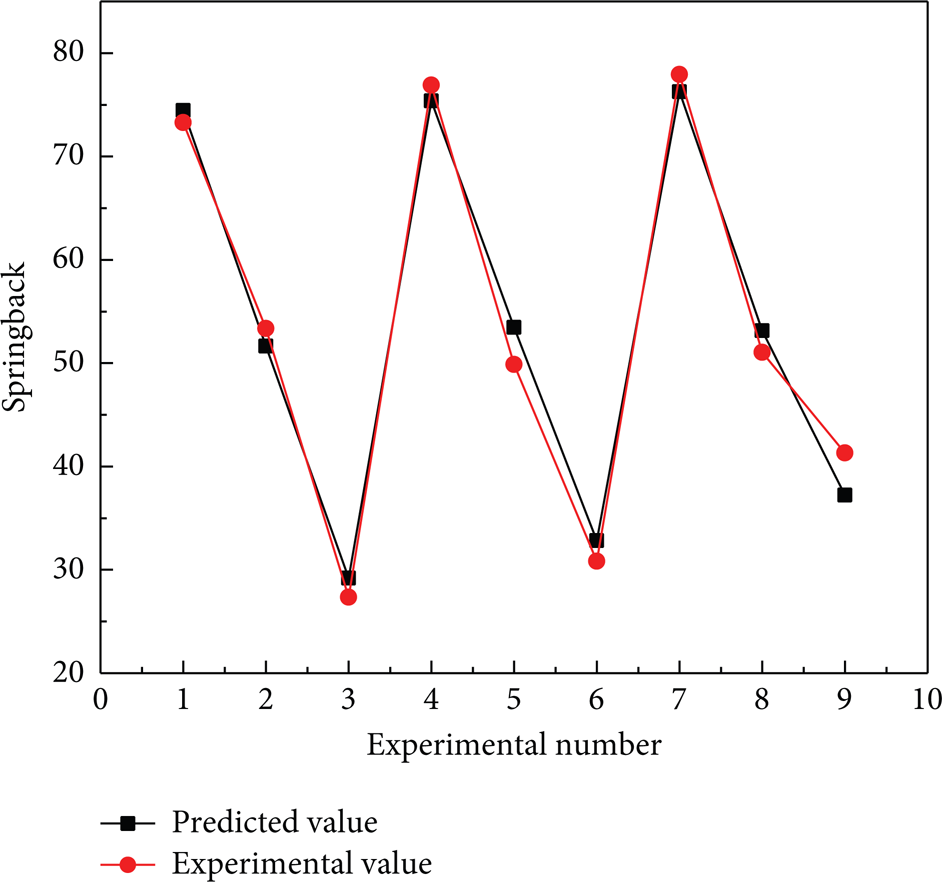
Using these two models, springback can be estimated simply and precisely only by taking the values of four parameters into equations. For instance, springback radius model's (3) capacity to predict springback was demonstrated in comparison with experimental springback values, as shown in Figure 3. The values of the four process parameters for springback prediction were listed in Table 3. Generally, a close agreement between predicted and experimental data is obtained in Figure 3, which indicates that the model is suitable to predict the springback of creep age forming of the aluminum alloy sheet. In Figure 3, the maximum error of springback between theoretical and experimental values is 4.1% at the experimental number of 9, and the average error is 2.2%. Therefore, this model has very high reliability and could be useful for engineers in estimating springback after springback.
Parameters for testing the capacity of model 1.

3.3. Effect of Stress Gradient on Springback
It is well known that the existence of stress during the creep age forming process can strongly affect the creep deformation of materials. In a CAF process, the stresses vary linearly across the sheet thickness during the initial loading stage to reach their maximum values at the outer surfaces of the sheet. Figure 4 shows the schematic representations of the stress gradient along the sheet thickness under the pure bending moment condition. For better analysis, the shear stresses of the sheet have been ignored in this study. Referring to Figures 4(a) and 4(b), the ratio of bending radius to thickness is identical, that is, R1/H1 = R2/H2, while the bending radius and thickness in Figure 4(a) are consistently larger than those in Figure 4(b), that is, R1 > R2 and H1 > H2. According to the theory of pure bending deformation, the maximum stresses at the outer surfaces of the sheets in Figures 4(a) and 4(b) are equal. However, it is evident from Figure 4 that the stress gradients along the sheet thickness are different because of different sheet thicknesses, H. The larger the sheet thickness is, the smaller the stress gradient.
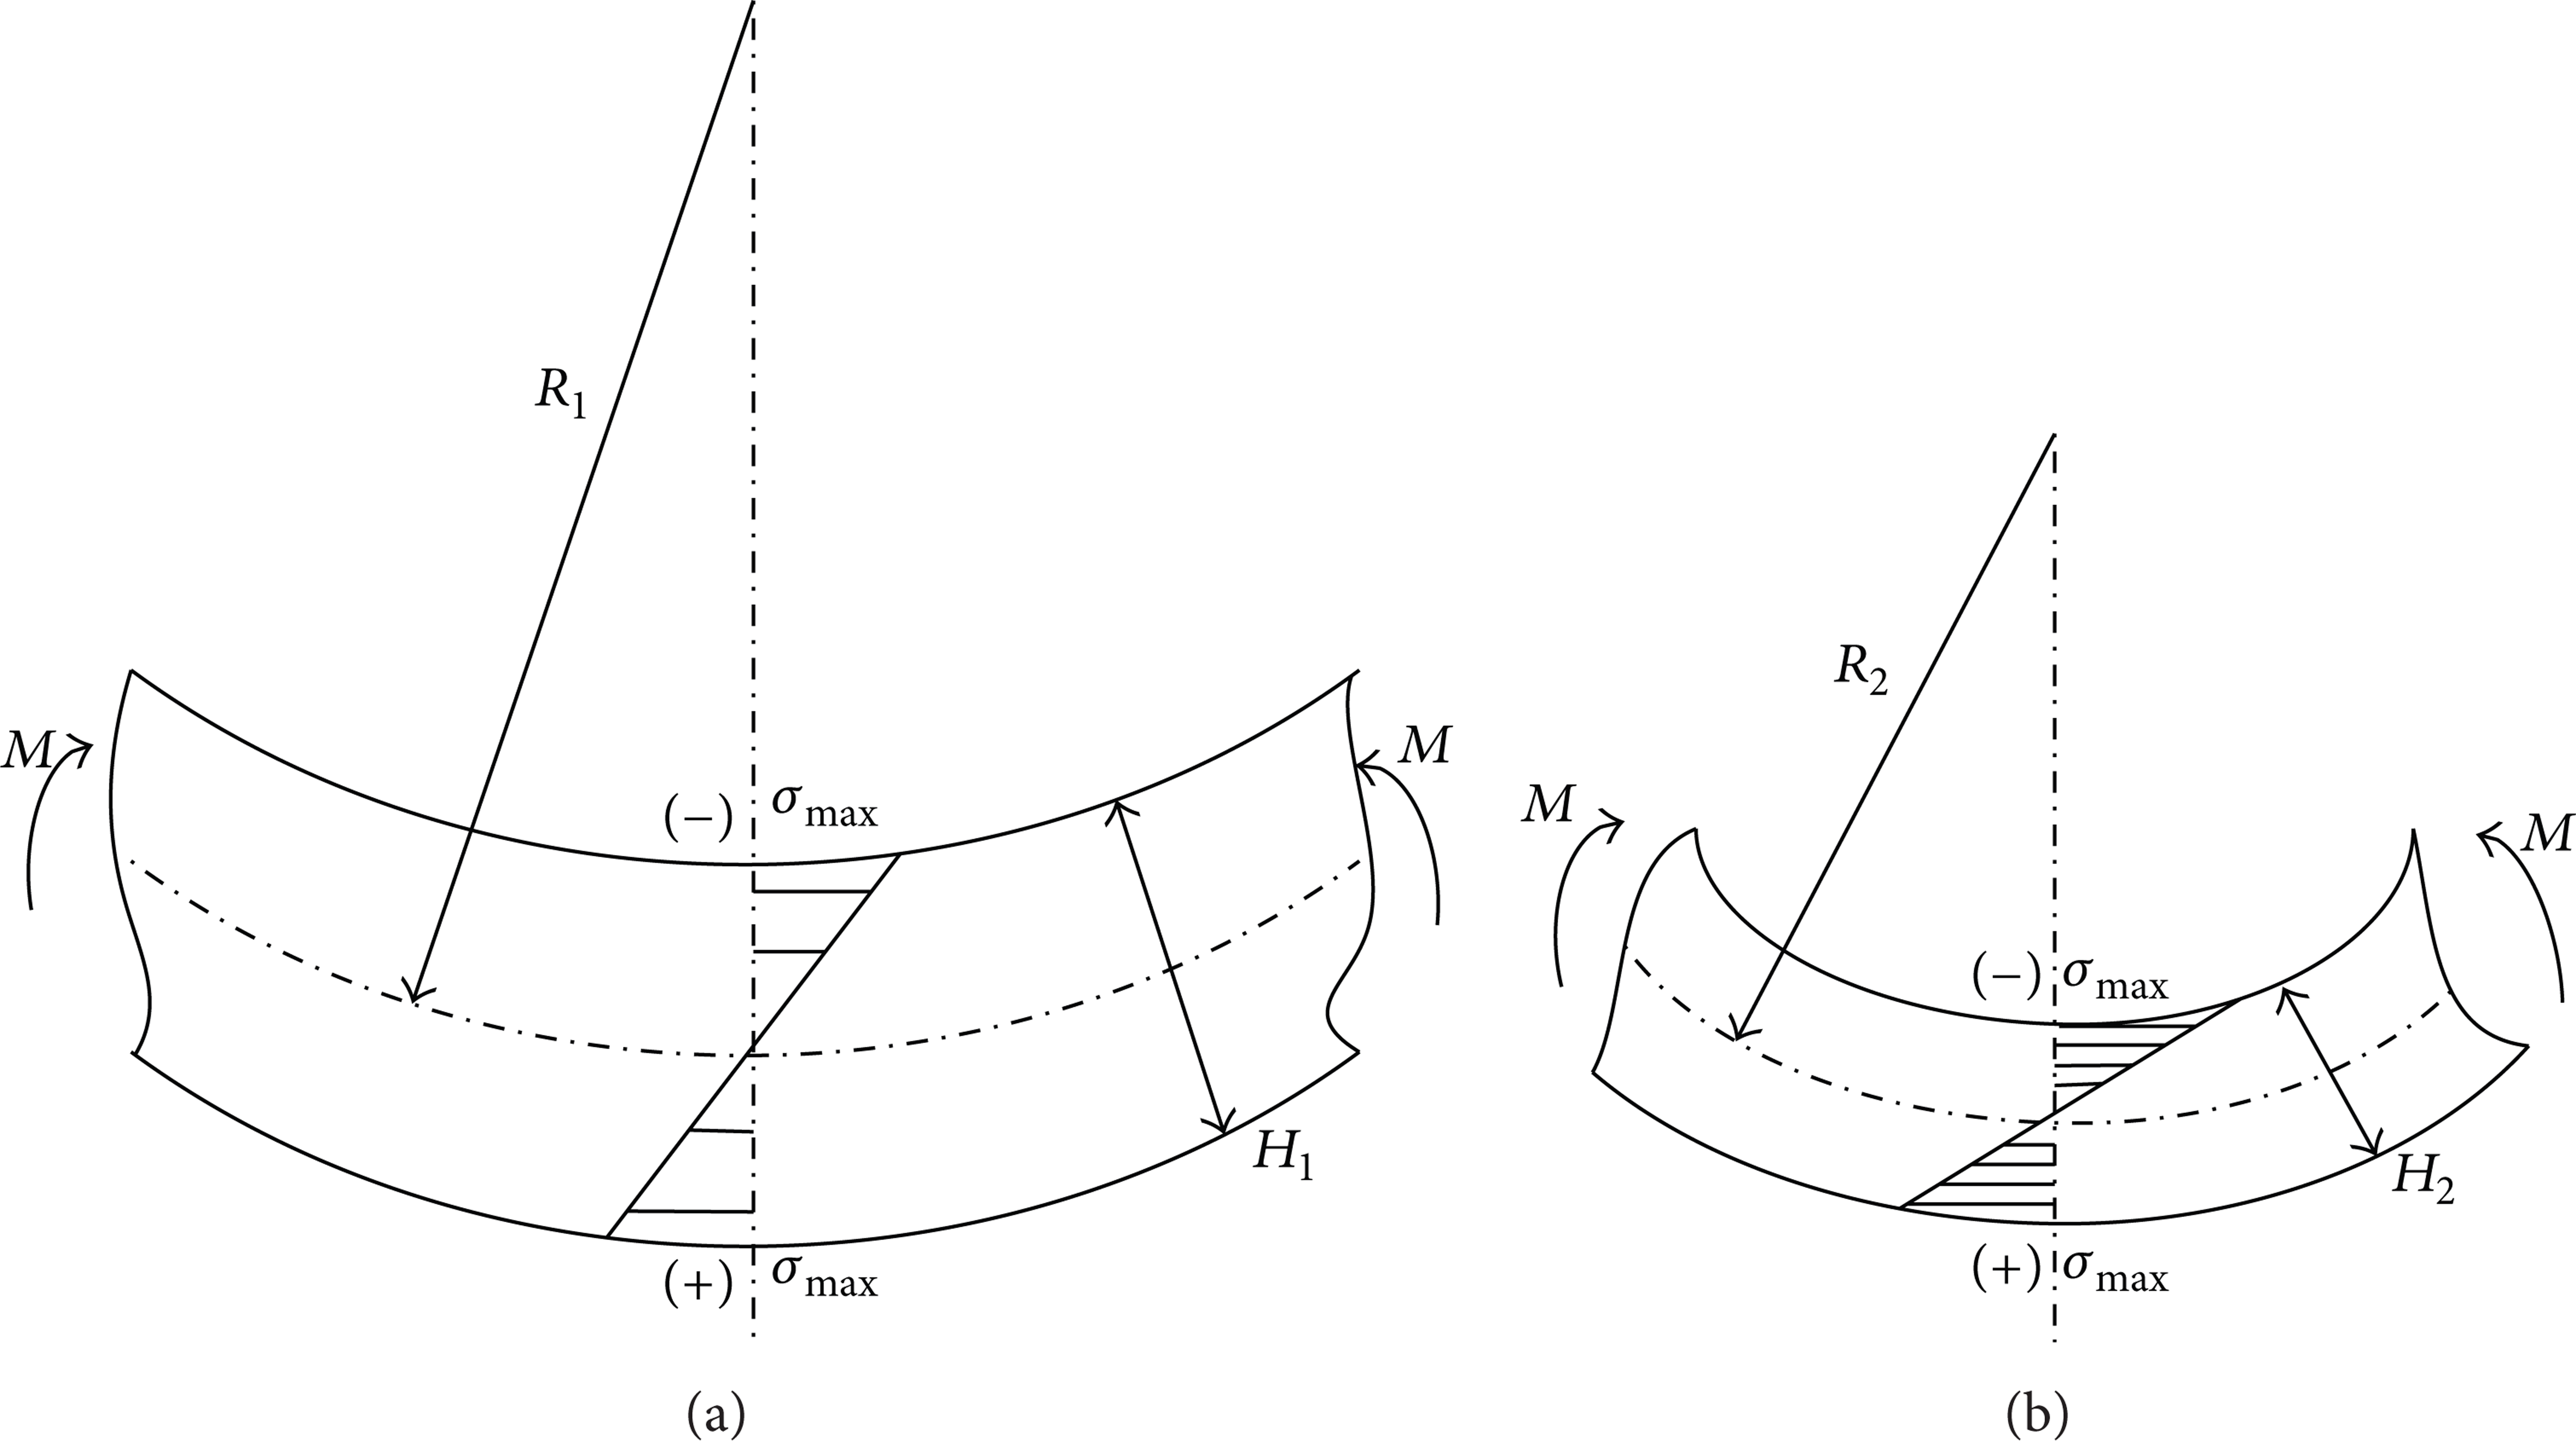
Schematic representations of stress gradient at constant ratio of bending radius to thickness (R1/H1 = R2/H2).
According to the discussion above, it can be seen that the stresses of the sheet in the CAF process are related to the initial bending radius and sheet thickness. Literature review shows that previous researches focused on the effect of ratio of initial bending radius to thickness (R0/H) on springback. Gardiner [9] showed that the springback is proportional to bend ratio, R0/H. This means springback is only influenced by R0/H when keeping other parameters identical, neglecting the variation of the stress gradient through the part thickness. Therefore, the effect of the stress gradient on springback was fully researched in this section.
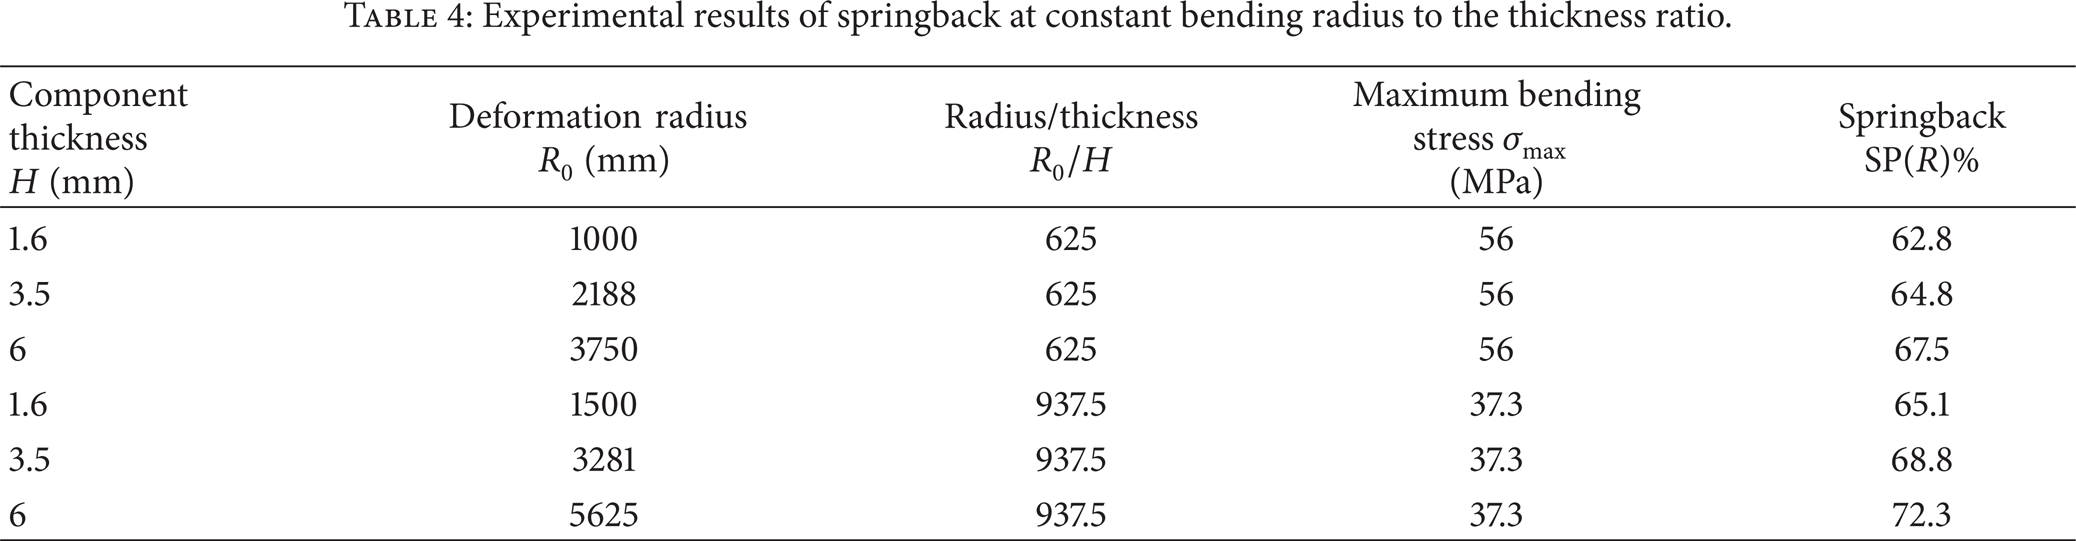
A set of tests were carried out at 160°C for 8 h and experimental results are given in Table 4. With regard to Table 4, the value of springback increases with the increasing sheet thickness H and deformation R0 while keeping constant R0/H. Maintaining R0/H = 625, the springback value increases from 62.8 to 67.5% with the increasing sheet thickness from 1.6 to 6 mm. This demonstrates that springback is not only associated with levels of stress, but also with stress gradient through the sheet thickness. Springback occurs due the fact that not all stresses produced by forming are relaxed in the CAF process. The stress reaches its maximum value at the end of the initial loading stage and drops quickly at the beginning of aging stage (primary creep stage). This significant decrement of stress is mainly controlled by the mechanism of grain boundary diffusion. Based on diffusion theory, the diffusion rate of grain boundary is proportional to stress gradient across the thickness of the sheet. Thus, the smaller the stress gradient is, the lower the decrement in internal stress. Springback, therefore, increases with the decreasing stress gradient across the sheet thickness.
Experimental results of springback at constant bending radius to the thickness ratio.
3.4. Effects of Stress States on Mechanical Properties and Microstructures
In Figure 4, when the material sheet is elastically loaded onto a tool surface, there exist compression in the upper surface of the sheet and tension in the lower. This indicates that two stress states (compression and tension) take place simultaneously along the thickness sheet. Some investigations were carried out with respect to the effect of individual stress state (compression or tension) on the mechanical properties and microstructures in the artificial aging of materials. Zhu and Starke [13] claimed that, for 2xxx series Al-xCu aluminum alloy, compressive stress applied during the aging process led to the precipitation of θ″/θ′-plates being perpendicular to stress direction whereas tensile stress favored formation of parallel θ″/θ′-plates. But no literature has been reported concerning the effect of simultaneous tensile and compressive stresses along the sheet thickness on the mechanical properties and microstructures of the sheet in CAF process.
For this study, specimens for mechanical property tests, with the thickness of 3 mm, were machined from the upper and lower surfaces of aluminum alloy sheets, as shown in Figure 5. These sheets had undergone creep forming tests at the experimental numbers of 3, 5, and 10 in Table 2. The maximum stresses at the outer surfaces of the sheets are calculated by
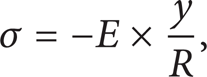
where E is the elastic modulus and is specified as 70 GPa for aluminum alloy, y is the vertical distance of 3 mm from the sheet surface to its neutral surface, and R is the curvature radius of the neutral surface. Substituting the initial bending radii at the experimental numbers of 3, 5, and 10, that is, 1000, 2000, and 3000 mm, into (5) gives the maximal stresses of 210, 105, and 70 MPa, which are well below the yield strength of 264 MPa. This provides an indication that all specimens lie in elastic range.
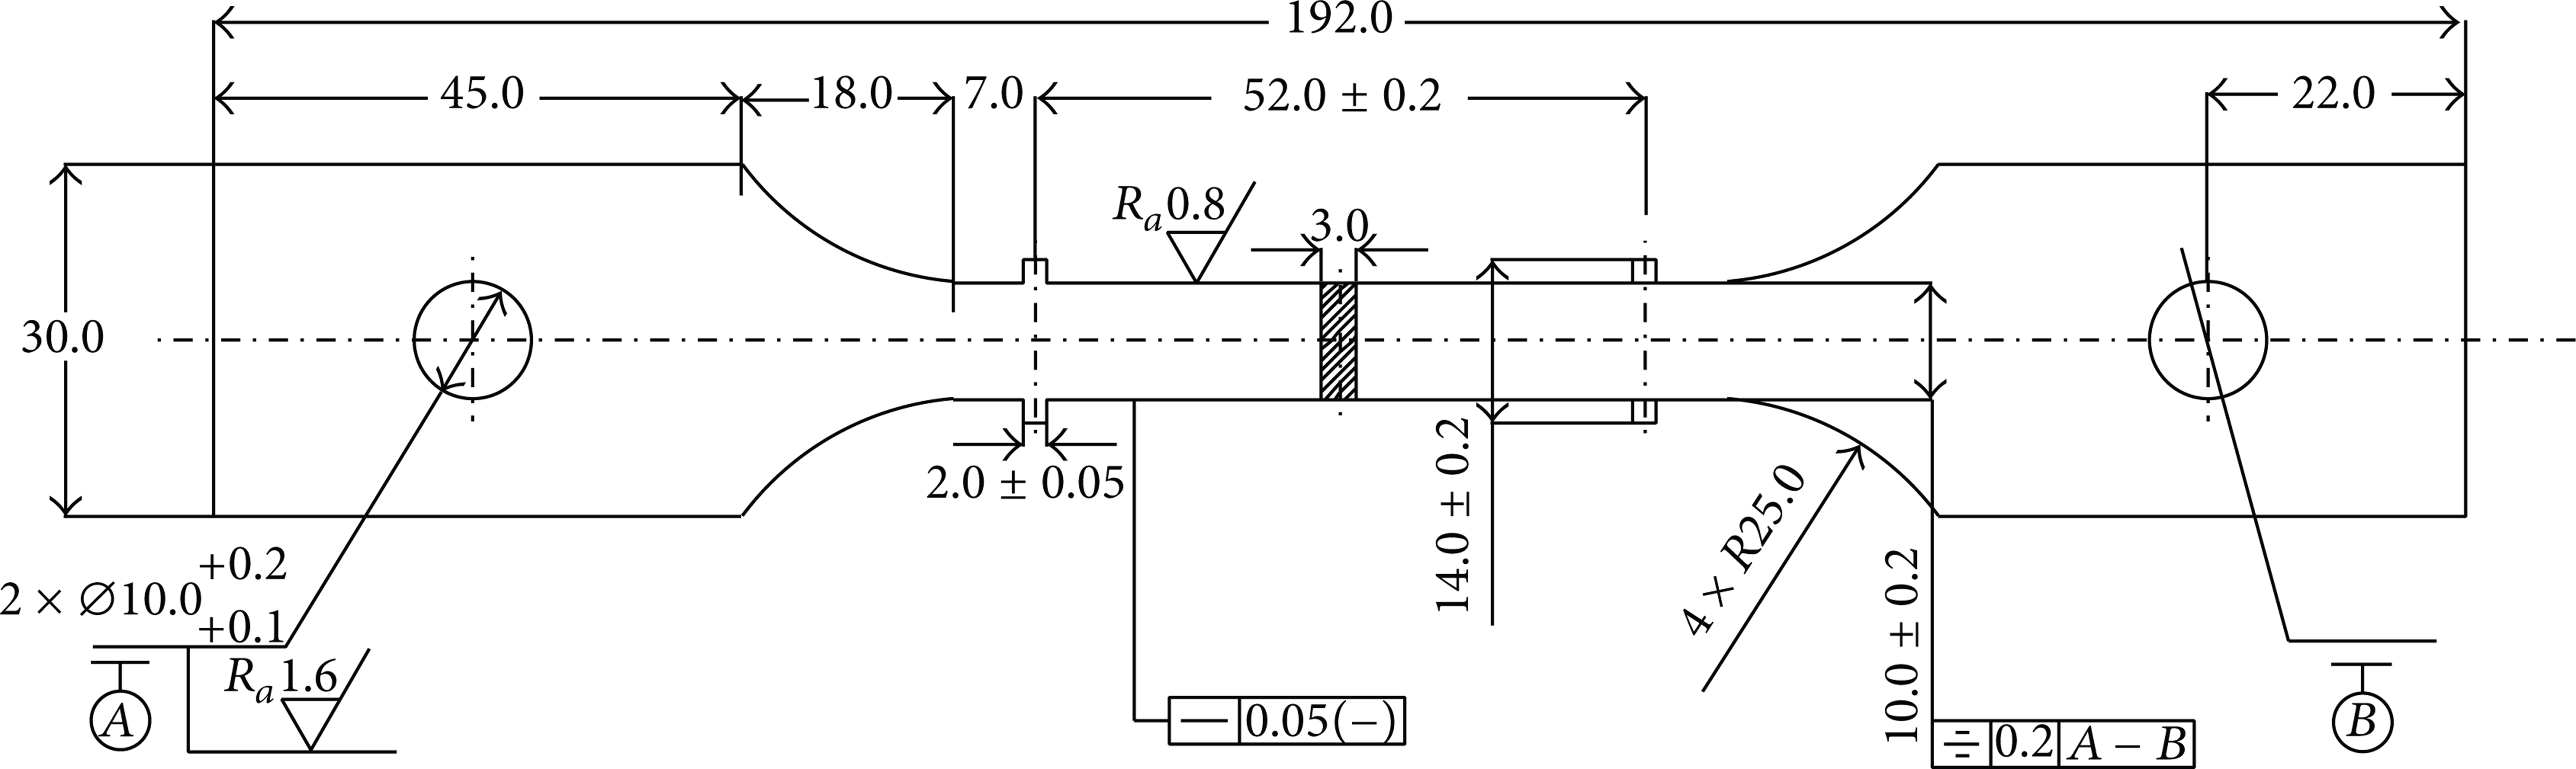
Geometry of the specimen (unit: mm).
The mechanical properties of these specimens are determined and given in Table 5. From Table 5, it is found that specimens machined from the compression side of the sheets have higher UTS, yield strength, and hardness but lower elongation in contrast with specimens from the tension side. These differences are dependent on the nature of precipitates, such as size, quantity, and distribution of precipitates. It can be concluded that the mechanical properties along the part thickness are not uniform due to the simultaneous tensile and compressive stresses in the CAF process.
Comparison of the mechanical performance in the tension and compression sides.
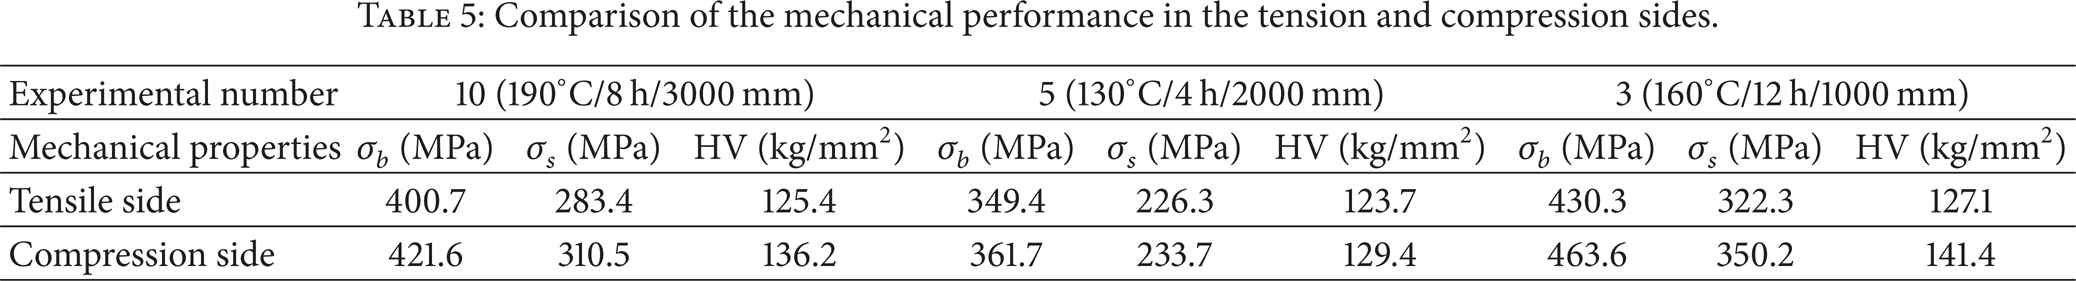
Figure 6 displays the TEM micrographs showing the intragranular morphologies of specimens creep aged at the experimental numbers of 3, 5, and 10. As seen in Figure 6, the size, quantity, and distribution of precipitates in grains are associated with aging temperature, time, and bending radius. For specimen creep aged with 130°C/4 h/2000 mm (bending radius), few needle-like precipitates were observed in the grains of the tension side of the specimen (Figure 6(c)), but some precipitates existed in the grains of the compression side (Figure 6(d)). While the intragranular morphologies were characterized by numerous needle-like precipitates in the other four TEM micrographs, particularly in Figures 6(e) and 6(f), these precipitates are identified as the strengthening phase S′(Al2CuMg) of 2524 aluminum alloy in CAF process, which can increase the strength of material. Coarser, rod-like precipitates were found in all micrographs. Sun [14] inferred that they are T phase (Al20Cu2Mg3) distributed dispersedly in the 2xxx aluminum alloys and play a role in prohibiting the recrystallization of grains.

TEM images of 2524 aluminum alloy sheets aged under different conditions. (a, b): T = 190°C, t = 8 h, R0 = 3000 mm; (c, d) T = 130°C, t = 4 h, R0 = 2000 mm; (e, f): T = 160°C, t = 12 h, R0 = 1000 mm. The left images represent the intragranular morphologies of specimens cut from the tension side of sheets and the right images denote that of the compression side.
From Table 4, it can be seen that both the strength and hardness increase first and then decrease with increasing temperature. At 130°C, few needle-like precipitates could be found in grains (Figures 6(c) and 6(d)), which provided an explanation for the specimen's lower mechanical performance and indicated that the specimen was in an under-aged stage. As temperature increased to 160°C, due to the effect of higher level of stress and longer aging time, the quantity and size of needle-like S′ phase noticeably increased (Figures 6(e) and 6(f)). At this stage, the performance of the specimen continued to increase up to maximum value. When the temperature increased up to 190°C, the precipitates in grains decreased and coarsened (Figures 6(a) and 6(b)) and the specimen was in over-aged condition. Thus, the strength and hardness fell generally.
It is obvious from Figure 6 that the number of precipitates in the compression side of specimens (the right images) is much greater than that of the tension side (left images). These result in a better mechanical performance in the compression side of the specimens, which is in agreement with the previous test results in Table 4. For specimen creep aged with compressive stress, the size of crystal lattice is relatively smaller, and hence the diffusion rate of solute atoms is slower, as compared to the tensile creep aged one. The crystal defects, such as dislocations, produced by the compressive or tensile stress provide plenty of heterogeneous sites for the nucleation of precipitates. Assume that the nucleation rate of precipitates is identical; then the growth rate of S′ depends largely on the diffusion rate of solute atoms from the matrix to new phase. Under the condition of compressive stress, the slower diffusion rate of solute atoms prohibits the growth rate of S′ phase, which makes the S′ phase more uniformly distributed in the matrix. It is generally accepted that finer and more precipitates in grains improve the mechanical properties of the material. As a result, the compression side of sheet has higher mechanical properties due to more and finer precipitates in grains as compared to tensile side.
4. Conclusions
Two springback prediction models, which enable the combined effects of aging temperature, time, part thickness, and predeformation to be captured, are developed based on experimental results and multiple linear regression. Their capacities to predict springback are justified by a set of tests. A close agreement between predicted and experimental data is achieved.
The springback increases with the decrease in stress gradient along the part thickness while maintaining the ratio of the initial bending radius to part thickness constant.
Two different stress states (tension and compression) occur simultaneously in CAF process and their effects on the mechanical properties are clarified. The compression side of the formed part possesses better mechanical performance due to the more and finer precipitates in grains, compared to tensile side.
Conflict of Interests
The authors declare that there is no conflict of interests regarding the publication of this paper.
Footnotes
Acknowledgments
This research was supported by the Key Program of National Natural Science Foundation of China (Grant no. 51235010) and the Major State Basic Research Program of China (973 Program) (Grant no. 2014CB046602).