
Abstract
Aiming at the new die steel quenching equipment, using Fluent software, the effects of the nozzle spacing, height, injection pressure, and comprehensive factors on the heat transfer characteristics are studied. The results show that when the nozzle spacing and injection pressure are given, the heat transfer coefficient increases first and then decreases with the injection height increase, and the cooling uniformity is better; when the injection pressure is given, the injection height increases with the nozzle spacing increase under the maximum heat exchanger capability; when the nozzle spacing is given, the injection height increases with the injection pressure under the maximum heat exchanger capability; for the nozzle arrangement in the paper, there is a relationship between the injection height and nozzle spacing when the heat transfer is uniform, H ≈ 8S. The results have important reference value for optimization design of the equipment and actual production process.
1. Introduction
Plastics have become one of the important industrial materials, and plastic products are produced by plastic moulds. To avoid quenching defects, such as distortion, cracking, and decarbonization, plastic moulds which have complex cavity and high accuracy need prehardening treatment. Spray cooling is used in order to increase the controllability in the cooling process and reach the best cooling effect. The online prehardening equipment newly developed is shown in Figure 1. According to the cooling medium and flow, the coolers are divided into strong cooling (W1, W2), aerosol cooling (Q), weak cooling (R1, R2), moderate cooling (Z), and so forth. Q, R1, R2, and Z form a group of nozzles. The cooling medium of strong cooling, weak cooling, and moderate cooling is water and that of the aerosol cooling is the mixture of air and water.

Cooling system.
In addition, the high pressure air jet equipment (A1, A2) and infrared thermometer (T1, T2) are, respectively, installed at the inlet and outlet of the cooling zone. Some researches on the process of heavy plate are shown in [1], but, for thin plates, air impingement jet cooling can meet the cooling requirement; namely, the aerosol jet just sprays air, as shown in Figures 1 and 2(a). One group of aerosol cooling contains six nozzles along the width direction of the steel plate.
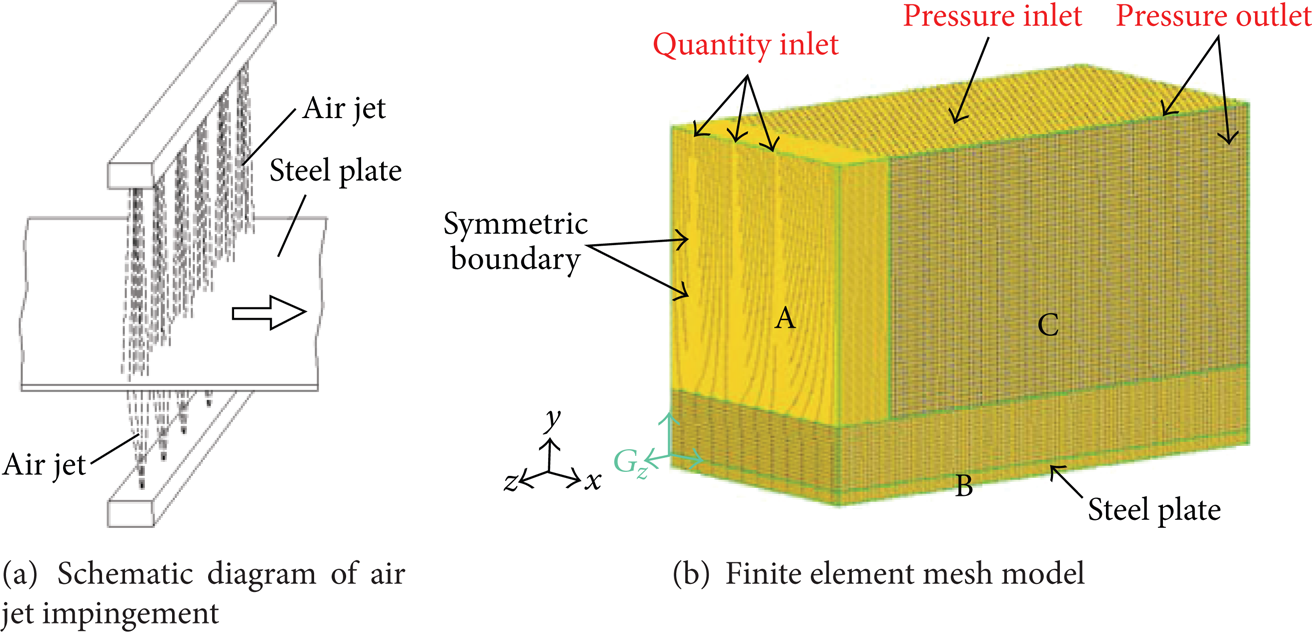
Schematic diagram and finite element mesh model of multinozzle air impingement jet.
The heat transfer characteristics of the air jet impingement cooling have been extensively studied. The flow and heat transfer of single slit and multiple slot jet impingement on the cylindrical surface were studied by two-dimensional model [2, 3]. In [4], the study results show that the direction of the horizontal flow has important effect on the distribution of heat transfer coefficient. Ekkad et al. studied the situation of impingement cooling and air film cooling when the staggered-array arrangement and systematic arrangement of impinging jets were used, respectively [5]. Chougule et al. found that shear-stress (SST) k-w turbulence model could better predict fluid flow and heat transfer characteristics [6]. LIU studied the reliability of shear-stress (SST) k-w turbulence model applied to the impingement jet [7]. In [8], based on turbine blade cooling technology, the heat transfer characteristics of array jet impingement cooling are studied. And the effect of Reynolds number, spray spacing, and the initial transverse flow and impact of hole arrangement are analyzed. Zhang et al. studied the effect of the distance and different Reynolds numbers on the local heat transfer characteristics with the four round nozzles being distributed in square [9]. In [10], gamma-theta turbulence model of the shear-stress transport format is used to study the heat transfer characteristics of array jet impingement cooling with the initial transverse flow. The work reported in [11] is an attempt to enhance heat transfer in electronic devices with use of multiair jet impingement on pin fin heat sinks with effusion slots on the nozzle plate. Aiming at the new die steel quenching equipment, using Fluent software, the effects of the nozzle spacing, height, injection pressure, and comprehensive factors on the heat transfer characteristics are studied in this paper. The study results provide the reference for the online prehardening process of thin die steel plate.
2. Heat Transfer Model of Multinozzles Air Impingement Cooling
Three-dimensional finite element model of the multinozzle air impingement jet is established. Because computational field is symmetric from top to bottom, from left to right, or from front to back, 1/8 of the computational field is used. After a large number of calculations, the model is meshed by the meshing software Gambit. The finite element mesh model is shown in Figure 2(b). The fluid regions include A, B, and C. In order to ensure the accuracy of calculation, the jet region (A) and the wall jet region (B) are refined.
The diameter of the nozzles is 4 mm. The steel plate thickness is 10 mm. The nozzle spacing and the height are given according to the practical conditions. The computational domain length (along the z-axis direction) is 400 mm, that is, half the length of the roller spacing. The computational domain length (along the x-axis direction) is 200 mm. The boundary of the nozzles is quantity entrance. Discrete format is second-order upwind scheme. The coupling equations of pressure and velocities are solved with the SIMPLE algorithm. The relative residual error is less than 10−3. Shear-stress transport (SST) k-w turbulent flow model is used by [8].
3. Computational Results Analysis
3.1. Effects of the Spacing from Nozzles to Steel Plate on Heat Transfer
The nozzle spacing is 30 mm, and injection pressure is 0.5 MPa. The spacing from nozzles to steel plate (H) is 50 mm, 100 mm, 150 mm, 200 mm, 250 mm, and 300 mm, respectively.
Velocity contours of multinozzle air impingement jet cooling high temperature steel are shown in Figure 3. When H is 100 mm, the diffusion degree of the air flow is low on steel plate surface. On the connecting line of stationary points, impact region and wall jet zone both exit, and the heat transfer distribution around the line along the width direction of the steel plate is extremely nonuniform; when H = 200 mm, the diffusion degree is increased and air flow from adjacent nozzles interacts, but the impact around every stationary point is much stronger than that of intermediate region of adjacent stationary points, so the distribution is still uneven. When H = 300, air flow from adjacent nozzles is joined together completely, and impact on the area close to the line between stationary points is uniform.

Velocity contours (m/s) at different injection heights.
The heat transfer coefficient contours at different injection heights are shown in Figure 4. From the figure it can be seen that the heat transfer distribution is more even with the injection height increase, which illustrates that the heat transfer distribution on steel plate surface is strongly uniform along the width direction.

Heat transfer coefficient contours (W/(m2·K)) at different injection heights.
The average values of the heat transfer coefficient along width direction of the plate are obtained, and the average value curves along the length direction of the plate are shown in Figure 5. From the figure, it can be seen that when H is lower, for example, H is 50 mm or 100 mm, the heat transfer coefficient close to the line of stationary points connecting is much bigger. When the spray height is high, for example, H is 300 mm, the heat transfer coefficient in the whole area is lower than that when H is 250 mm, so the heat transfer capacity when H is 300 mm is lower than when H is 250 mm.
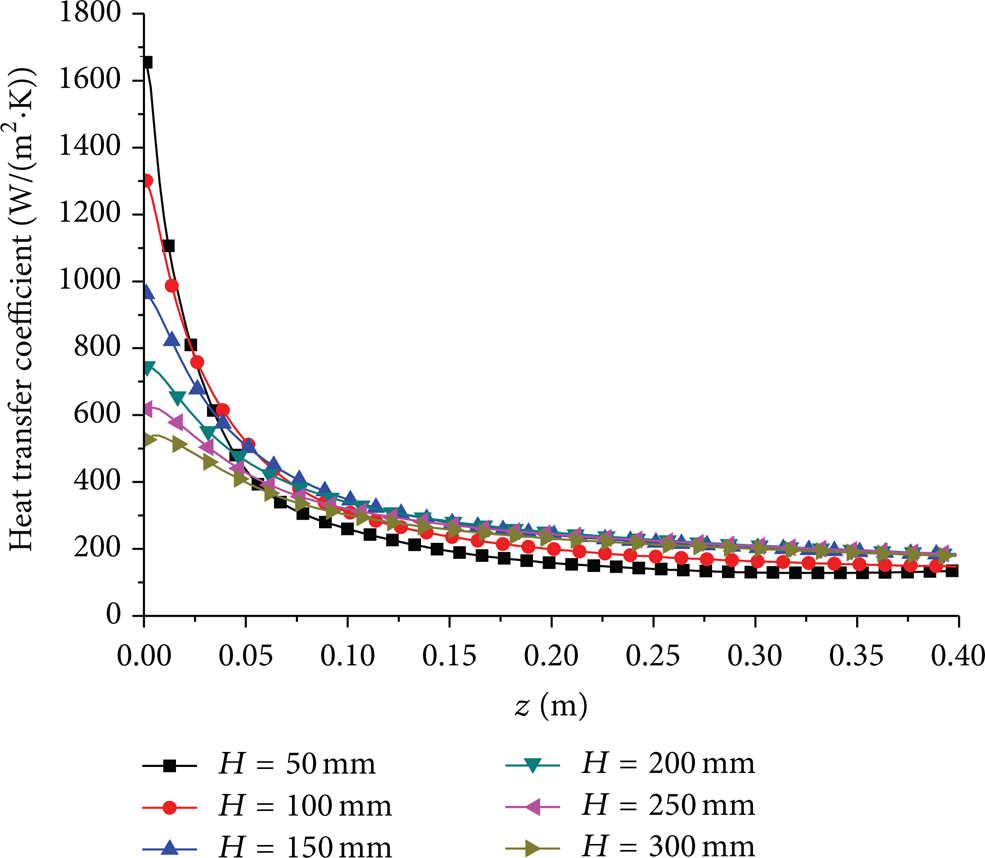
Average value curves of heat transfer coefficient.
As the nozzle spacing (S) is 30 mm and injection pressure (P) is 0.5 MPa, the average heat transfer coefficient curves in the whole cooling area with the injection height are shown in Figure 6. The average heat transfer coefficient increases and then decreases with the increase of the injection height. When H is 150 mm, the average heat transfer coefficient reaches a maximum; when H is from 120 mm to 180 mm, the average heat transfer coefficient change is small and the heat transfer is strong. When H is 250 mm, the heat transfer distribution is uniform. And the average heat transfer coefficient in the whole cooling area is 286 W/(m2·K), which is about 91% of the maximum. When H is 300 mm, the distribution is more even and the average heat transfer coefficient is about 85% of the maximum.

Average value curves of heat transfer on whole area.
3.2. Effects of the Nozzle Spacing on Heat Transfer
The injection pressure (P) is 0.5 MPa. The nozzle spacing is 30 mm, 50 mm, and 70 mm, respectively.
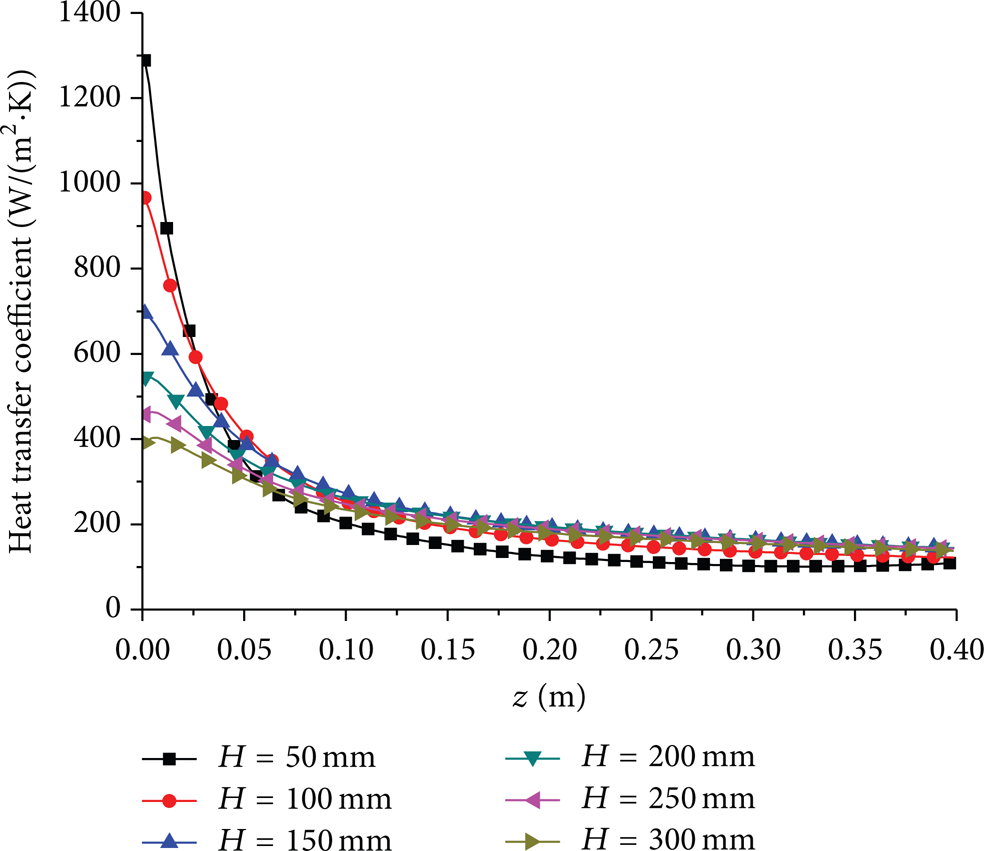
When the nozzle spacing S is 50 mm, the average values of the heat transfer coefficient along width direction of the plate are obtained, and the average value curves along the length direction of the plate are shown in Figure 7. The average heat transfer coefficient curves in the whole cooling area with the injection height are shown in Figure 8.

Average value curves of heat transfer coefficient.

Average value curves of heat transfer on whole area.
The change rule of the heat transfer capacity and uniformity is the same as that when S is 30 mm. When H is 180 mm, the average heat transfer coefficient reaches a maximum 245 W/(m2·K); when H is 400 mm, the heat transfer coefficient change is small along plate width direction and the heat transfer distribution is in a good uniformity and the average heat transfer coefficient in the whole cooling area is 205 W/(m2·K), which is about 84% of the maximum.
When the nozzle spacing S is 70 mm, the average values of the heat transfer coefficient along width direction of the plate are obtained, and the average value curves along the length direction of the plate are shown in Figure 9. The average heat transfer coefficient curves in the whole cooling area with the injection height are shown in Figure 10. The change rule of the heat transfer capacity and uniformity is the same as that when S is 30 mm and S is 50 mm. When H = 200 mm, the average heat transfer coefficient reaches a maximum of 210 W/(m2·K); when H is 500 mm, the heat transfer coefficient changes are small along plate width direction and the heat transfer distribution is in a good uniformity and the average heat transfer coefficient in the whole cooling area is 167 W/(m2·K), which is about 80% of the maximum.

Average value curves of heat transfer coefficient.
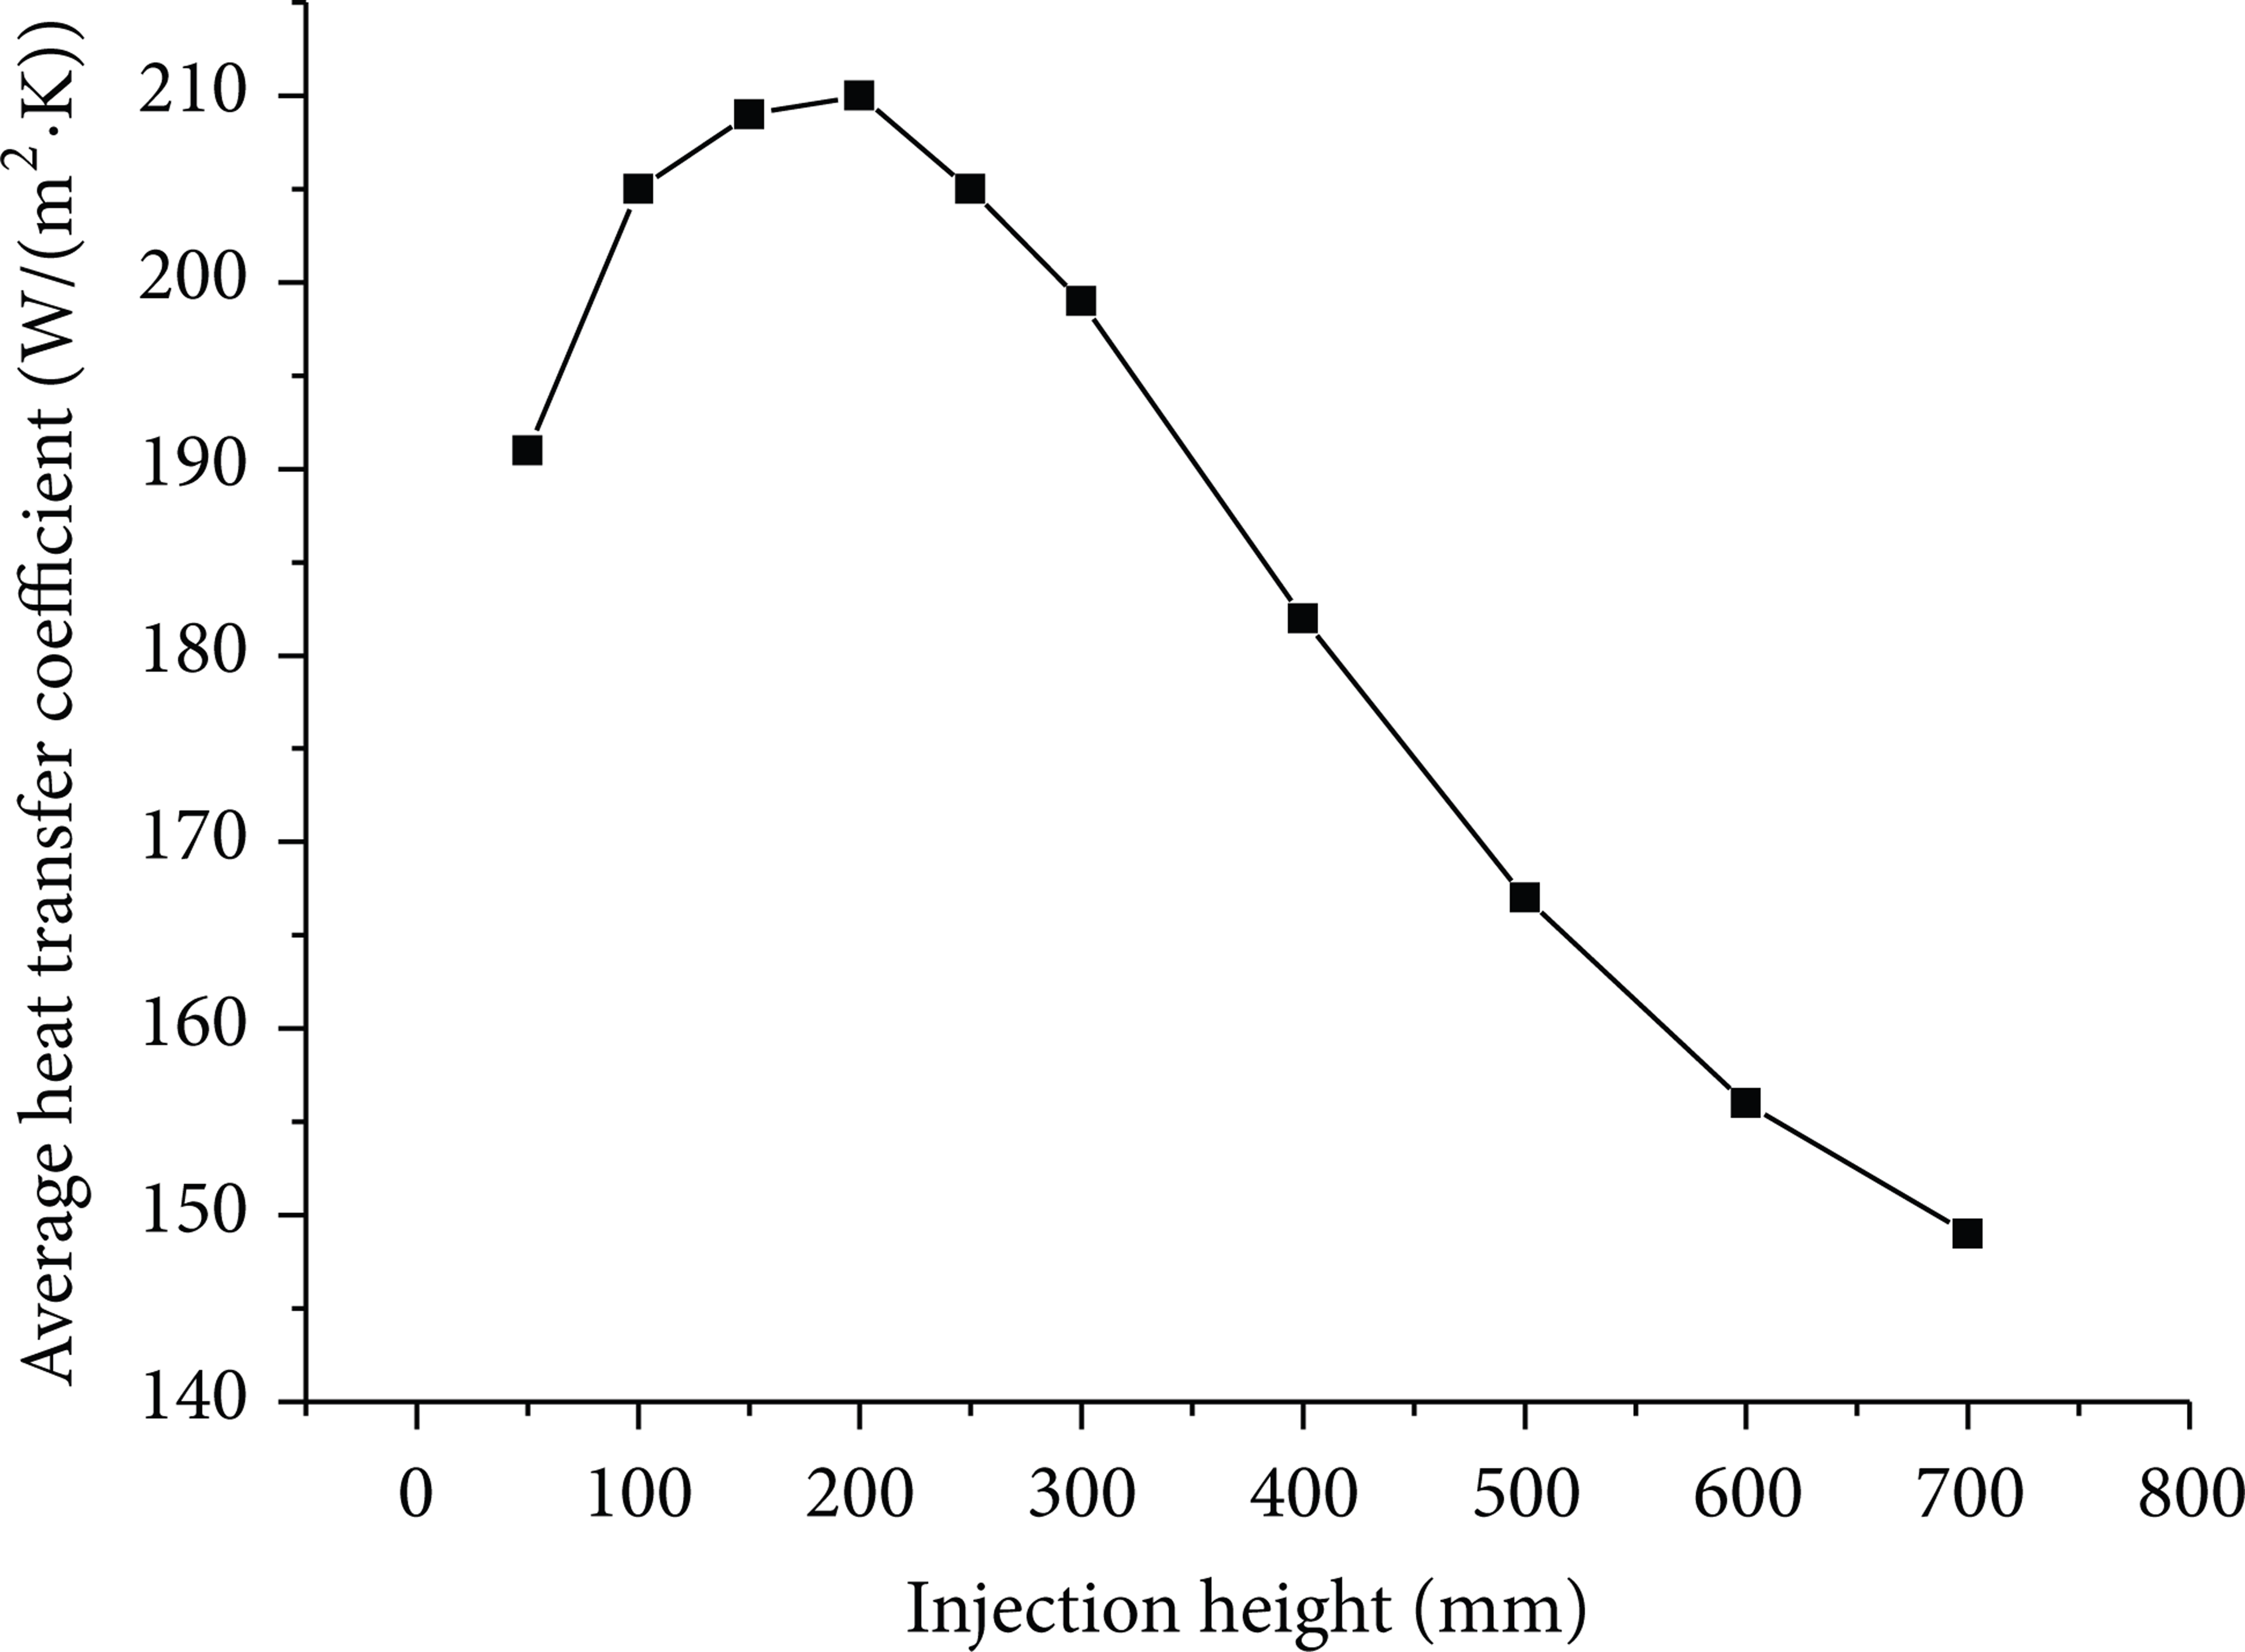
Average value curves of heat transfer on whole area.
Through the above analysis, it can be seen that the change rules of the heat transfer capacity and uniformity of different nozzle spacing with injection height are the same. The injection height is 8 times the nozzle spacing when the heat transfer is uniform.
The average heat transfer coefficient change curves of different nozzle spacing in the whole area with the injection height increase are shown in Figure 11. The heat transfer coefficients under different nozzle spacing change in the same way with the injection height increase. The average heat transfer coefficient increases at first and then decreases. When the injection height is fixed, the average heat transfer coefficient is smaller when the nozzle spacing increases.

Average heat transfer coefficient change rules under different nozzle spacing.
3.3. Effects of the Injection Pressure on Heat Transfer
The nozzle spacing (S) is 30 mm, and the injection pressure P is 0.2 MPa, 0.5 MPa, and 0.8 MPa, respectively.
When the injection pressure P is 0.2 MPa, the average values of the heat transfer coefficient along width direction of the plate are obtained, and the average value curves along the length direction of the plate are shown in Figure 12. The average heat transfer coefficient curves in the whole cooling area with the injection height are shown in Figure 13.
Average value curves of heat transfer coefficient.
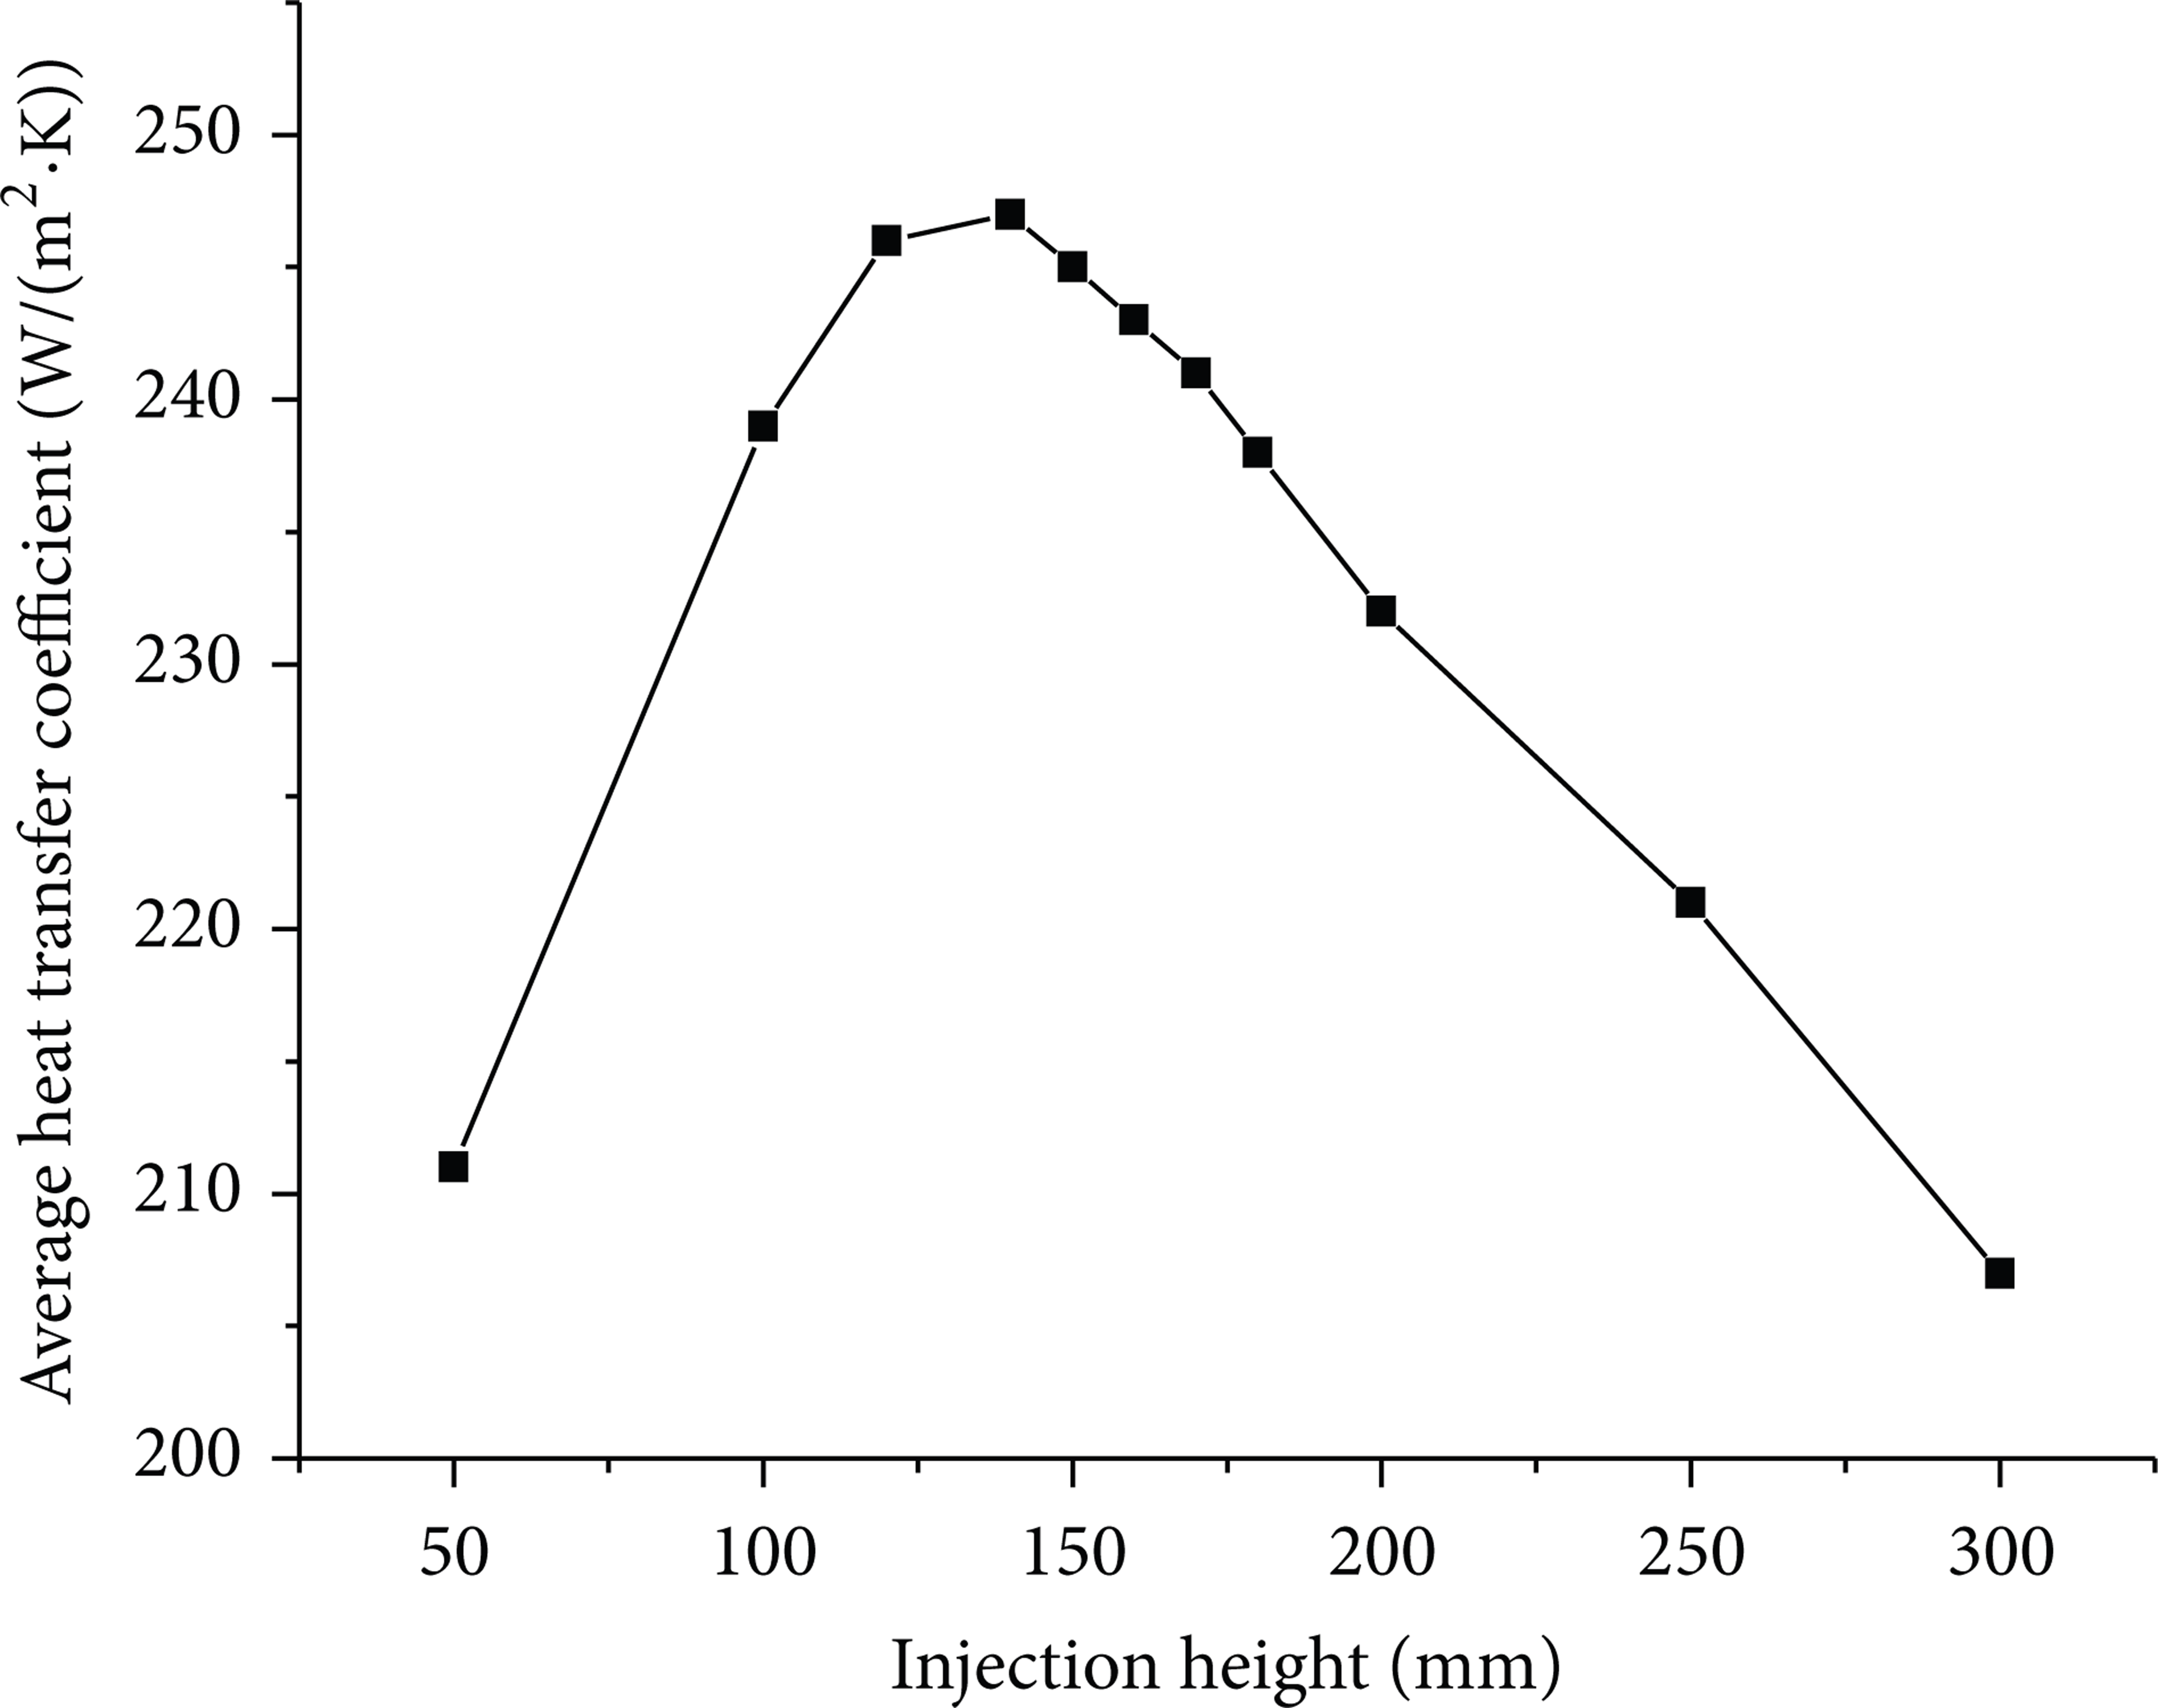
Average value curves of heat transfer on whole area.
The change rule of the heat transfer capacity and uniformity is the same as that when P is 0.5 MPa. When H is 140 mm, the average heat transfer coefficient reaches a maximum 247 W/(m2·K); when H is 250 mm, the heat transfer coefficient changes are small along plate width direction and the heat transfer distribution is in a good uniformity and the average heat transfer coefficient in the whole cooling area is 221 W/(m2·K), which is about 89% of the maximum.
When the injection pressure (P) is 0.8 MPa, the average values of the heat transfer coefficient along width direction of the plate are obtained, and the average value curves along the length direction of the plate are shown in Figure 14. The average heat transfer coefficient curves in the whole cooling area with the injection height are shown in Figure 15.

Average value curves of heat transfer coefficient.
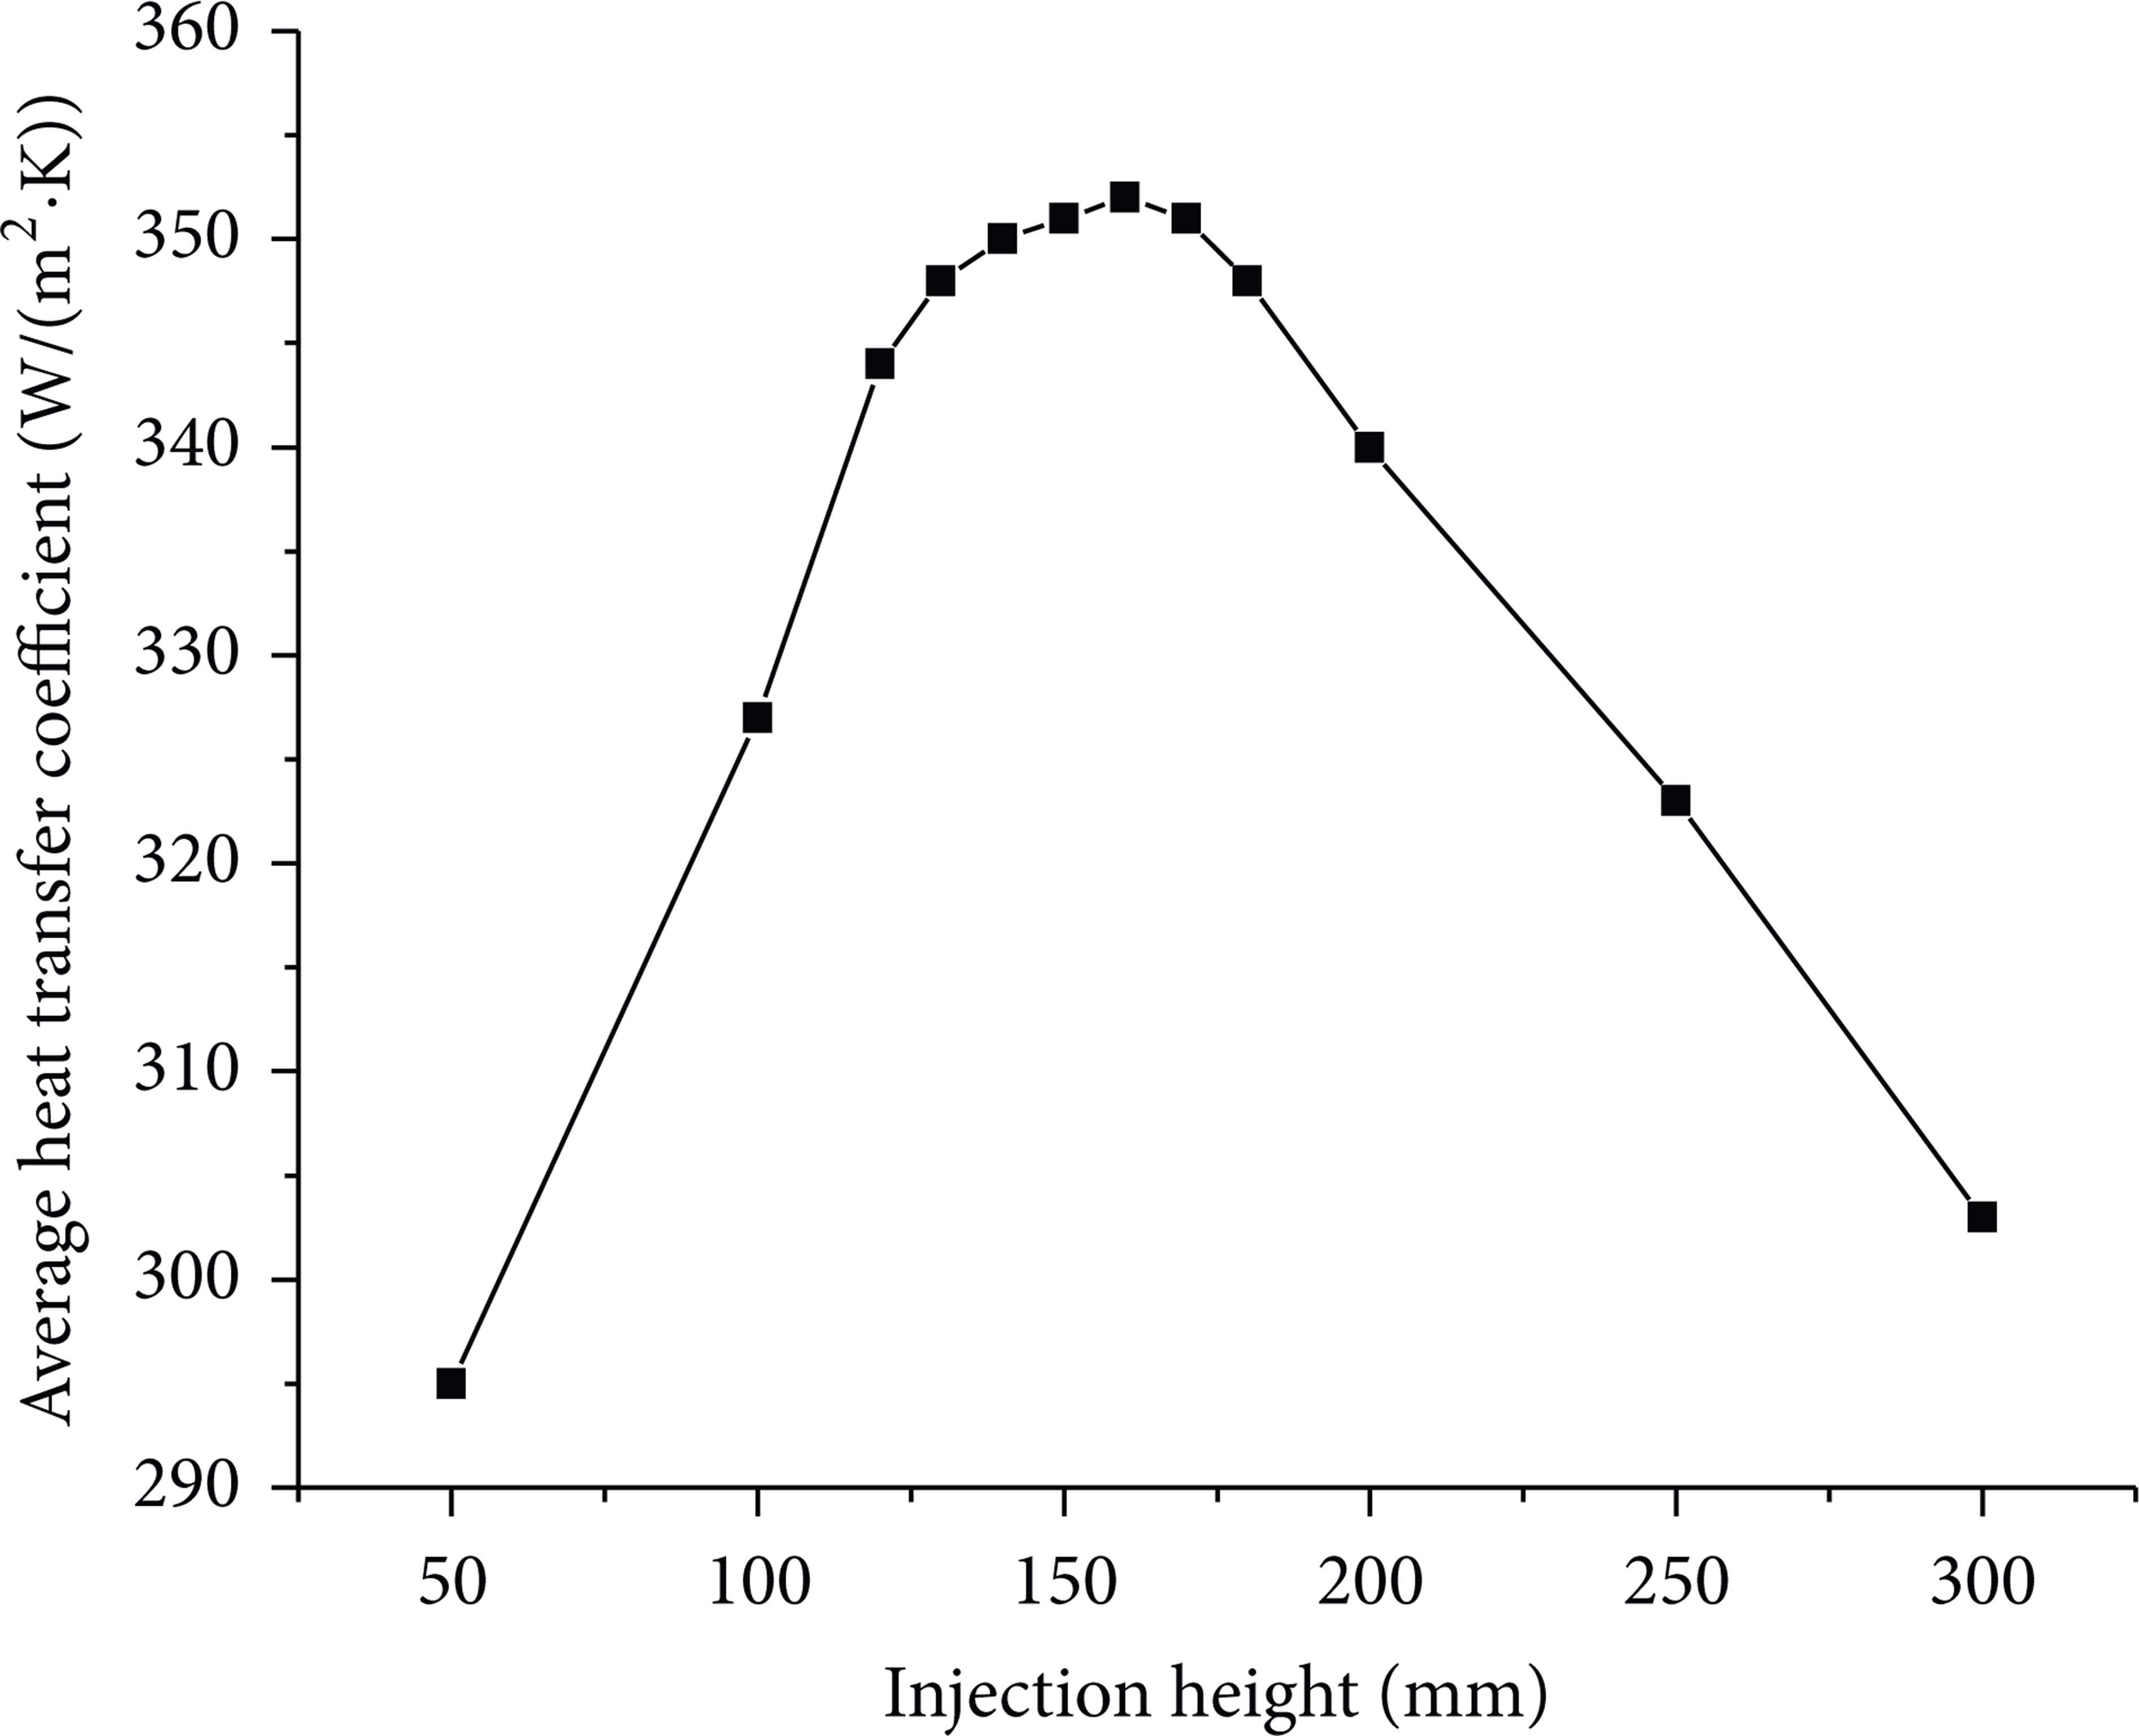
Average value curves of heat transfer on whole area.
The change rule of the heat transfer capacity and uniformity is the same as that when P is 0.2 MPa and P is 0.5 MPa. When H is 160 mm, the average heat transfer coefficient reaches a maximum 352 W/(m2·K); when H is 250 mm, the heat transfer coefficient change is small along plate width direction and the heat transfer distribution is in a good uniformity and the average heat transfer coefficient in the whole cooling area is 323 W/(m2·K), which is about 92% of the maximum.
From the above analysis, it can be seen that the heat transfer capacity and uniformity under different injection heights change in the same way with the injection height increase. When the heat transfer distributes evenly, the nozzle spacing is 1/8 of the injection height.
When P is 0.2 MPa, 0.5 MPa, and 0.8 MPa, respectively, the average heat transfer coefficient change curves in the whole area with the injection height increase are shown in Figure 16. It can be seen that the heat transfer coefficient under different injection pressure changes in the same way with the injection height increase which leads to the average heat transfer coefficient increasing at first and then decreasing. When the injection height is fixed, the heat transfer capacity is better when the injection pressure is bigger in the whole area.

Average heat transfer coefficient change rules under different injection pressure.
4. Conclusions
When the nozzle spacing and injection pressure are given, the heat transfer coefficient increases at first and then decreases with the injection height increase, and the cooling uniformity gets better.
When the injection pressure is given, the injection height increases with the nozzle spacing increase when the heat transfer capacity is maximum. The injection height is 8 times the nozzle spacing when the heat transfer distribution is even.
When the nozzle spacing is given, the injection height increases with the injection pressure increase when the heat transfer capacity is maximum. The injection height is 8 times the nozzle spacing when the heat transfer distribution is even.
When the injection height is fixed, the average heat transfer coefficient is smaller when the nozzle spacing increases, and the heat transfer capacity is better when the injection pressure is bigger in the whole area.
Conflict of Interests
The authors declare that there is no conflict of interests regarding the publication of this paper.