
Abstract
A vehicle group is a dynamic spatial layout comprising a target vehicle and surrounding vehicles in the process of driving. It partly affects driving behavior states and guides driver propensity. Its formation and transformation mechanism are affected by driving behaviors all the time. It plays a significant role in research on active driving and autodriving systems by revealing the exact vehicle group transformation mechanism in a complex environment. Taking the three-lane condition as an example, a vehicle group is analyzed with the target vehicle running in different lanes. In addition, its state is recognized and a change rule is researched to reveal the transformation mechanism of a vehicle group in a time-varying environment. The current study establishes the basis for subsequent studies on the driver propensity transformation mechanism under complex, evolving environmental conditions.
1. Introduction
A vehicle group is a dynamic spatial layout formed of target vehicle and surrounding vehicles in the process of driving. It affects partly the states of driving behaviors and guides the driver's propensity. Its formation and transformation mechanism are affected by driving behaviors all the time [1]. In recent years, scholars have researched relevant fields of vehicle group relationships with the aim of relieving traffic congestion and solving other related problems. A microwave radar was used for tracking the preceding vehicle in Park et al.'s study [2]. Vehicle position and running trajectory were tracked. However, the scanning field of the microwave radar was limited to the preceding vehicle. Haag and Nagel [3] attempted to recognize the vehicle position through video images when it was driven toward an intersection, into an intersection, and off an intersection. However, the influence of vehicles on each other was not considered. Ma and Kaber [4] investigated the effect of electronic communication with adjacent vehicles in the process of driving. Research shows that good cooperation can be achieved through communication among vehicles, but the communication channel used in such studies is single, hysteretic, and unstable. Borge et al. [5] pointed out the maximum velocity and acceleration of the vehicle group under different road service levels. Zhang et al. [6] used GPS to detect vehicle position and to calculate travel times with vehicle coordinates and velocities with the aim of reducing traffic jams. Huang and Chan [7] discussed the effect of auto exhaust dispersion in a vehicle queue and pointed out that the effects of airflow differ based on various arrangements of preceding vehicles and following vehicles.
Previous studies have mostly focused on vehicle group recognition and its impact on traffic from a relatively macrocosmic and static perspective. However, methods for microcosmic measurement and dynamic computation of the vehicle group transformation mechanism and for forecasting under time-varying conditions are relatively few. Therefore, Wang et al. [8] put forward a dynamic feature extraction method of driver's propensity. Then, the transformation mechanisms of driver's propensity were studied by Wang et al. [9]. However, the relationships among vehicle groups are considerably more complex under three-lane conditions. A greater number of factors need to be considered. Based on a study of two-lane road conditions, vehicle groups under three-lane conditions can be divided into three types: target vehicle in left lane, target vehicle in middle lane, and target vehicle in right lane. The groups with the target vehicle in the left or right lane are somewhat similar to the two-lane condition, but not the same. For example, the lane-changing behavior of the target vehicle will be influenced by lane changes made by the vehicle on the interval lane. When the target vehicle is in the middle lane, the driver has to consider not only the middle lane but also the adjacent lanes. The driving process is more complex than in the other two lanes. Therefore, it is necessary to study the transformation mechanism of vehicle group relationships under the three-lane condition. Traffic entities are linked organically through a dynamic vehicle arrangement during driving. It plays a significant role in research on active driving and autodriving systems by revealing the exact transformation mechanism of a vehicle group in a complex environment. Therefore, the vehicle cluster layout topology and its relationship with driving behaviors should be researched. Therefore, the three-lane condition is taken as an example, and the vehicle group relationship is analyzed when the target vehicle runs in different lanes. Its state is recognized and the time-varying parameter is studied as well. The research establishes a basis for subsequent studies on driver's propensity transformation mechanism under the evolution of complex environmental conditions.
2. Complexity Analysis of Vehicle Group under Dynamic Three-Lane Condition
2.1. Vehicle Group Types
A vehicle group is constituted of dynamic traffic entities. It has a decisive influence on driver behavior [10]. It is time-varying and shifts with the state of the surrounding vehicles during driving. Different information is reflected by a vehicle group at different times. The movement characteristics of vehicle clusters are considered in this paper, such as speed, acceleration, acceleration and deceleration frequency, acceptance spacing, and lane-changing frequency. The following seven regions surrounding target vehicle are considered: front, left front, right front, left, right, left rear, and right rear (because the vehicle following the target vehicle in the same lane has a relatively small influence on the target car, the rear vehicle is not considered temporarily to simplify the model). The most general vehicle group that can be obtained is shown in Figure 1.
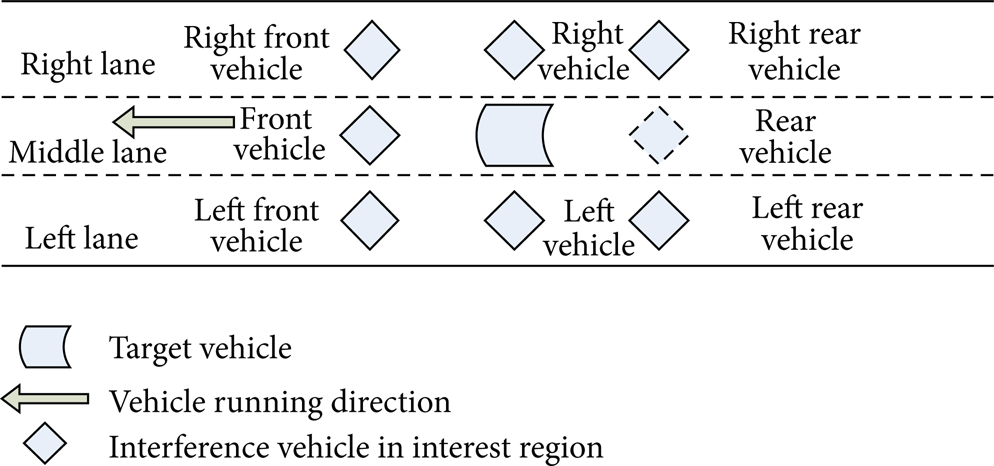
General vehicle group under three-lane conditions.
Different vehicle group types have different influences on the target vehicle's driver. The vehicle groups can be divided into three cases: target vehicle located in the left lane, middle lane, and right lane. Thus, there are 128 (27 = 128) separate vehicle groups each for when the target vehicle is located in the left, middle, and right lanes, and the total number of vehicle group types is 384 under three-lane condition. Due to space limitations, only a few of these 384 groups are shown in Figures 2, 3, and 4.

Vehicle groups when target vehicle is located in left lane.

Vehicle groups when target vehicle is located in middle lane.
Vehicle groups when target vehicle is located in right lane.
2.2. Vehicle Group Simplification
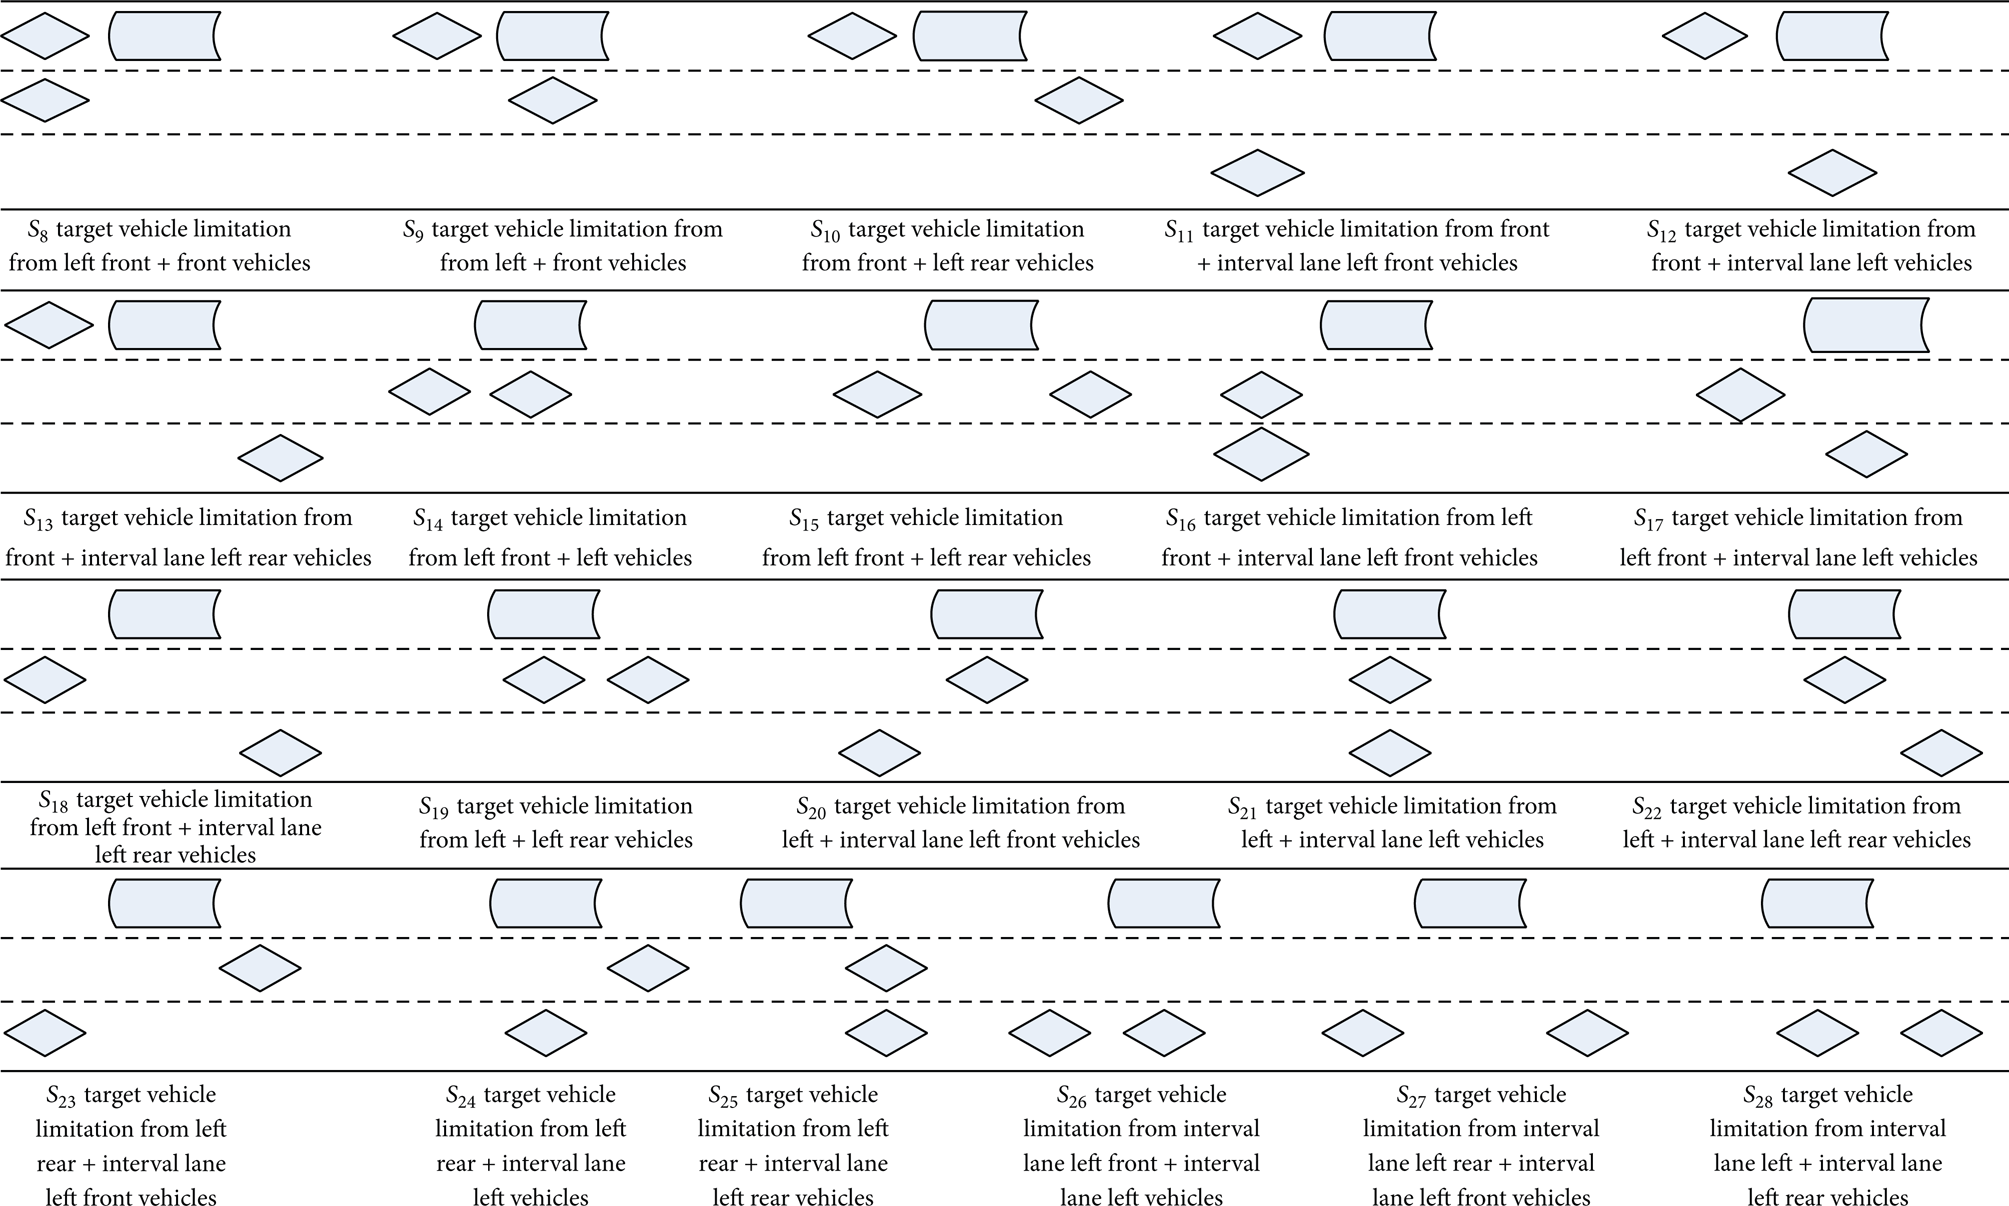
For the vehicle group shown in Figure 1, the position of the vehicles in left front, left, left rear, right front, right, and right rear can be divided into two types: interference vehicles on the left and those on the right. As the target vehicle runs in the middle lane, when there is more than one interference vehicle on the left (or right) and the distance between them meets the minimum gap acceptance conditions, it is assumed that the left (or right) vehicle, whose spatial distance (distance along the direction of speed of the target vehicle) to the target vehicle is the minimum, can restrict the target vehicle. If the distance is greater than the minimum gap acceptance condition, then the two vehicles are combined and considered as one interference vehicle. In addition, when the target vehicle is driving in the left lane or the right lane in a free state or in the car-following state, the situation can be regarded as vehicle group under two-lane conditions. If the target vehicle changes lanes, behavior of the vehicle in the interval lane moving along the same direction should be considered to avoid any traffic conflict due to lane-changing. For simplifying the model, the vehicle in the interval lane, moving in the same direction as the target vehicle, is not considered in this paper. Thus, the original vehicle groups are simplified further and shown in Figures 5 and 6.

Simplification of vehicle group when target vehicle is located in left and right lanes.
Simplification of vehicle group when target vehicle is located in middle lane.
The target vehicle may change lanes in the process of driving, so there are 16 vehicle group types after simplification and aggregation under different lane conditions.
3. Recognition of Vehicle Group under Dynamic and Complex Three-Lane Conditions
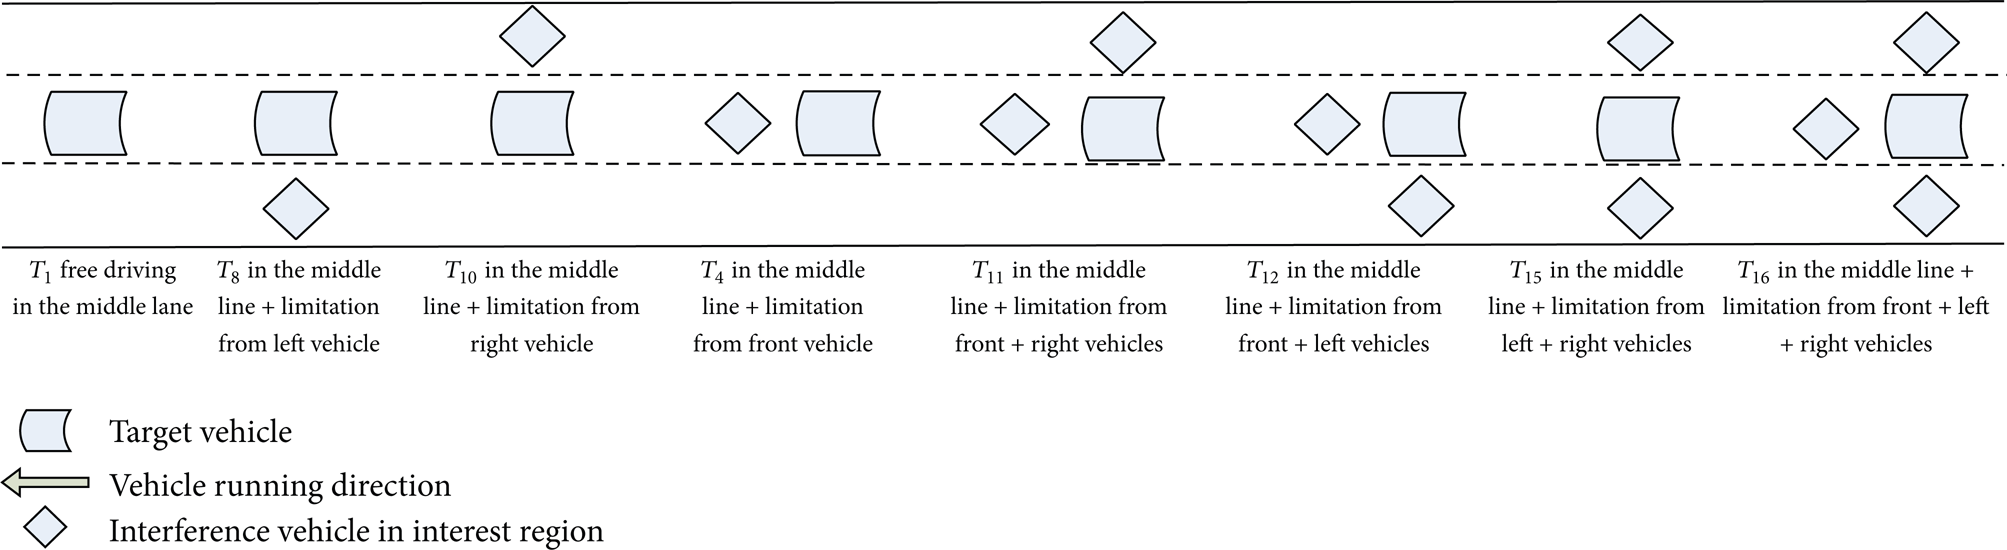
The vehicle group type at each moment needs to be recognized because of the group type's variability. Vehicle group recognition depends on vehicles' relationships in groups with different spatial locations and distances along the direction of speed. Studies show that when the spacing between the target vehicle and the front vehicle meets the condition dfront< 70 m [11–15], the front vehicle has an effect on the target vehicle. Similarly, many experiments show that when dleft (or dright, dleft is the straight distance between the target vehicle and the vehicle in the left lane along the direction of motion of the target vehicle, and there is dright) is less than (or equal to) a threshold value, the target vehicle will be affected. Data from different drivers show that the interval of dleft is around [−65 m, 60 m] and the interval of dright is [−50 m, 55 m]. A vehicle group recognition and identification model is shown in Figure 7.

Vehicle group recognition and identification model.
4. Vehicle Group Transformation Mechanism under Dynamic and Complex Three-Lane Conditions
The vehicle group will transform with changes in the surrounding vehicles. The future state of a vehicle group can be predicted by elucidating a vehicle group evolution rule.
4.1. Vehicle Group Transformation Graph Based on Finite Automaton
There are 16 vehicle group types under three-lane conditions (shown in Figure 7). Each vehicle group state may transform into another during driving. Driver propensity and preference will be represented in the process of lane-changing or car-following, and the situation will be reflected during vehicle group transformation. The vehicle group transformation graph can be obtained from the lane-change data of the target vehicle and the preceding vehicle (resp., denoted as a and b). Through the observed changes in the target vehicle and/or the preceding vehicle, the transfer law from the current vehicle group to another one is studied by finite automaton.
The meaning of the parameters in a 5-tuple (T, Σ, δ, T1, F) of the finite automaton-based vehicle group is as follows [16–18].
T is the finite set of states. There are 16 vehicle group types (shown in Figure 7); namely, T = {T1, T2, …, T16}.
Σ represents the finite set of input symbols. Each of its parameters is an input character; Σ = {a, b}.
δ: T × Σ → T is the state transformation function; namely, δ(T i , x) = T j ; it implies that an accepting state T j is reached after string x has been read when the state of automata is T i .
T1 ∈ T is the initial state.
F ⊆ T is the set of accepting (termination) states.
Any finite state automaton can be described using a directed graph G M (also known as state transform diagram), as shown in Figure 8. T represents the set of nodes of G M ; for any T i ∈ T and x ∈ Σ, if δ(T i , x) = T j , T j ∈ T, a directed arc is drawn from node T i to node T j , and the input string x is denoted on the arc. If δ(T i , x) = φ, the directed graph is not treated in any manner.
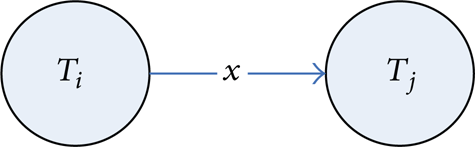
Directed graph of finite state automata.
Here, T i , T j are states, and a is an input string in Σ. Figure 8 illustrates the transformation of state T i to state T j with some rules, where i, j ≤ n.
When a vehicle group is in one state and the corresponding transform rules are input, the corresponding vehicle group transformation diagram is obtained [19], as shown in Figure 9.

Transformation graph of vehicle group under three-lane conditions.
The corresponding transformation table is shown in Table 1.
Transformation table of vehicle group under three-lane conditions.
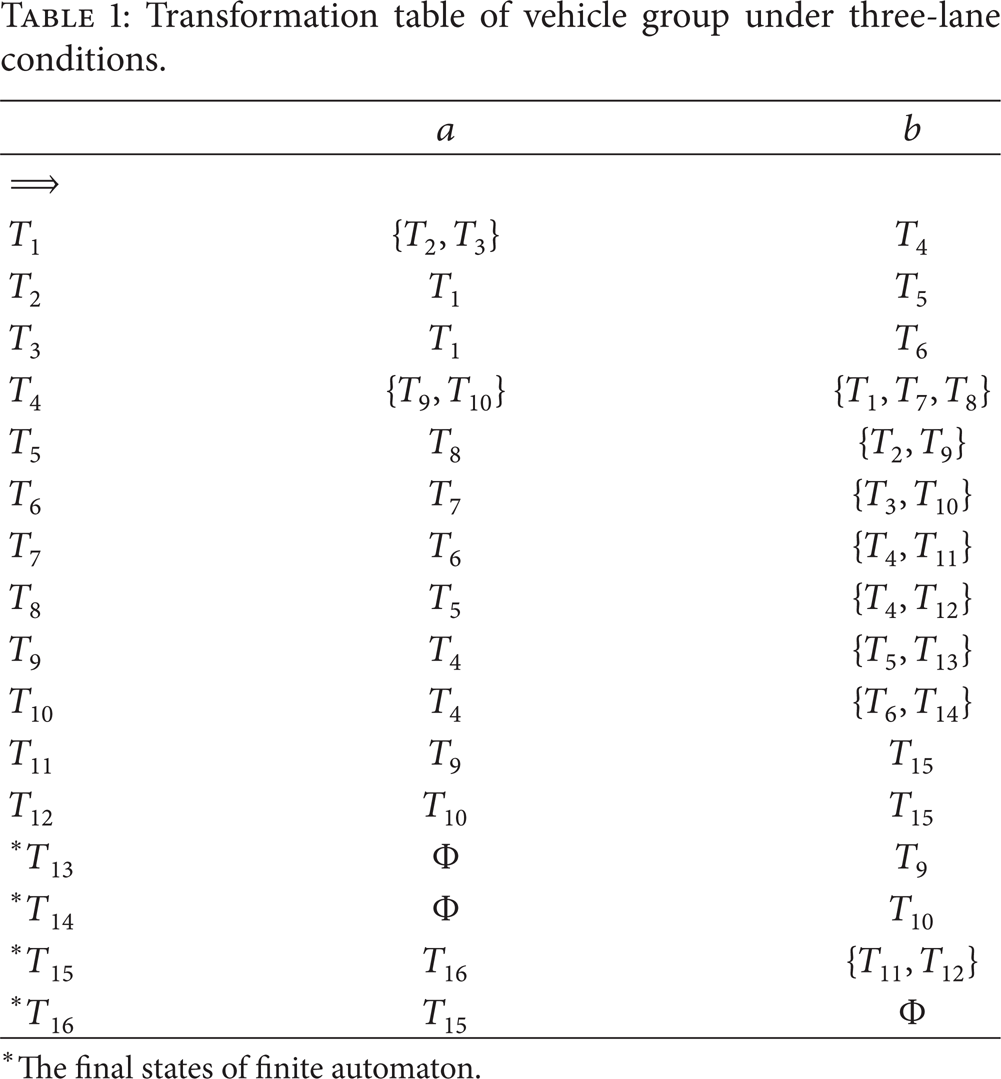
The final states of finite automaton.
4.2. Vehicle Group Transformation Probability Based on PageRank Algorithm
PageRank is a page ranking algorithm based on current web links [20–22]; it can be seen as a Markov random walk model.
A state transform diagram is usually represented as the directed graph G M = [T, E], in which T = {T1, T2, …, T16} is the set of vertices corresponding to vehicle group type and E is the set of edges representing the links among vehicle group types in the directed graph. The adjacency matrix A = (a ij ) describes the graph structure. When vehicle group T i transforms to T j , the corresponding relationship is a ij = 1; otherwise a ij = 0. Therefore, A = (a ij ) is available; the initial probability transformation matrix is M = (m ij ), where

Column vectors R t (T i ) and Rt + 1(T i ) are introduced; their elements are instantaneous rating values (rating value is the weight of a vehicle group relationship itself; it indicates the degree of importance in the transfer process) of vehicle group relationships at times t and t + 1. At time t, the kth vehicle group will transfer its own rating scale R t (T k ) to the ith vehicle group with the ratio m ki , represented as m ki R t (T k ). The accumulation of rating scales of which all vehicle groups transfer to the ith vehicle group at time t is Rt + 1(T i ), and its computation formula is as follows:

Therefore, the following dynamic equation is established: MR t (T i ) = λRt + 1(T i ). The meaning of this equation can be comprehended as the process that the eigenvector R t (T i ) at time t transforms into the eigenvector Rt + 1(T i ) at time t + 1, and λ is the amplification coefficient for this transformation. Besides, the initial vector is R0(T i ) at time t = 0, and its calculation involves determining M's characteristic root, for which the absolute value is maximum and corresponds to the eigenvector; then, the initial vector of the vehicle group relationship can be obtained by uniting the above eigenvectors.
If there exists a constant λ and t → + ∞, R t (T i ) will infinitely approach R(T i ), i = 1,2, …, 16. Then, the following formula is established:

where R(T i ) is the fixed point of the formula and λ is the eigenvalue of the probability transformation matrix.
The algorithm is improved to overcome some drawbacks. To attain the transformation probability of vehicle group T i , the first step is to find the set T′ of vehicle groups to transform to T i . Then, the probability of vehicle group T j ∈ T′ transforming to T i is as follows:

where R(T i ) is the rating value of vehicle group T i and ∑R(T j ) is the sum of all rating values transformed from vehicle group T j . The transformation matrix of the vehicle group state is P Tij , and the transformation probability between vehicles groups is given as follows:

In the vehicle group transformation probability matrix P Tij , pi − j denotes transformation probability, and i, j = 1,2, …, 16 represents sixteen types of vehicle groups; i denotes a vehicle group before transformation, and j denotes the corresponding vehicle group after transformation.
Vehicle groups comprising a target vehicle and the surrounding traffic entities can be obtained by real vehicle experiments under three-lane conditions. The transformation probability matrix can be obtained by studying its transformation laws, as shown below:

4.3. Verification
Simulation experiments (shown in Figure 10) were conducted using the simulator developed by FORUM8, a Japan-based enterprise. The software UC-Win road ver.4 is used in the driving simulator. A simulated three-lane driving scene is used in the experiments. Urban roads and corresponding road facilities were set according to the traffic standards of China. Drivers were trained to use the simulator before the experiments. The experiments were concerned with the sixteen groups listed above. The corresponding data can be obtained from the simulation experiments. Vehicle group relationship recognition results can be analyzed based on the obtained data.
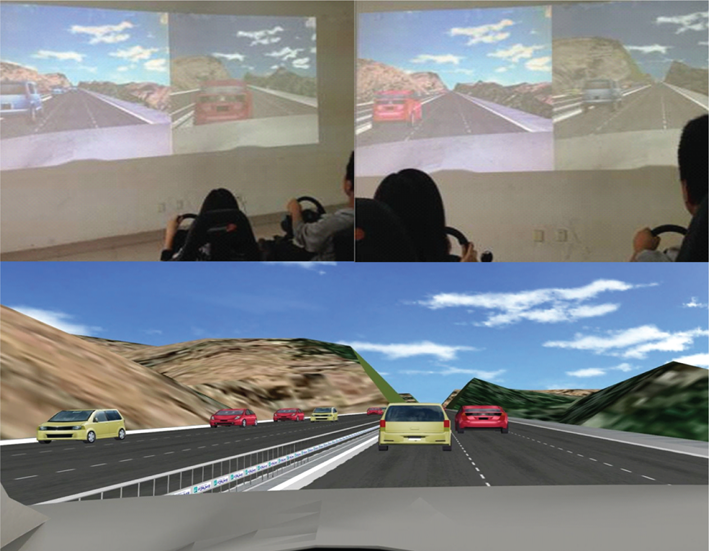
UC-Win road driving simulation experiments.
Corresponding data is analyzed using the prediction model established in this paper, and only the transformation probabilities of vehicle group relationships can be obtained from the above process. Therefore, the vehicle group relationship corresponding to the maximum probability is eventually regarded as the prediction result, and it is compared with the dynamic recognition result. The simulation results are summarized in Table 2.
Simulation results.
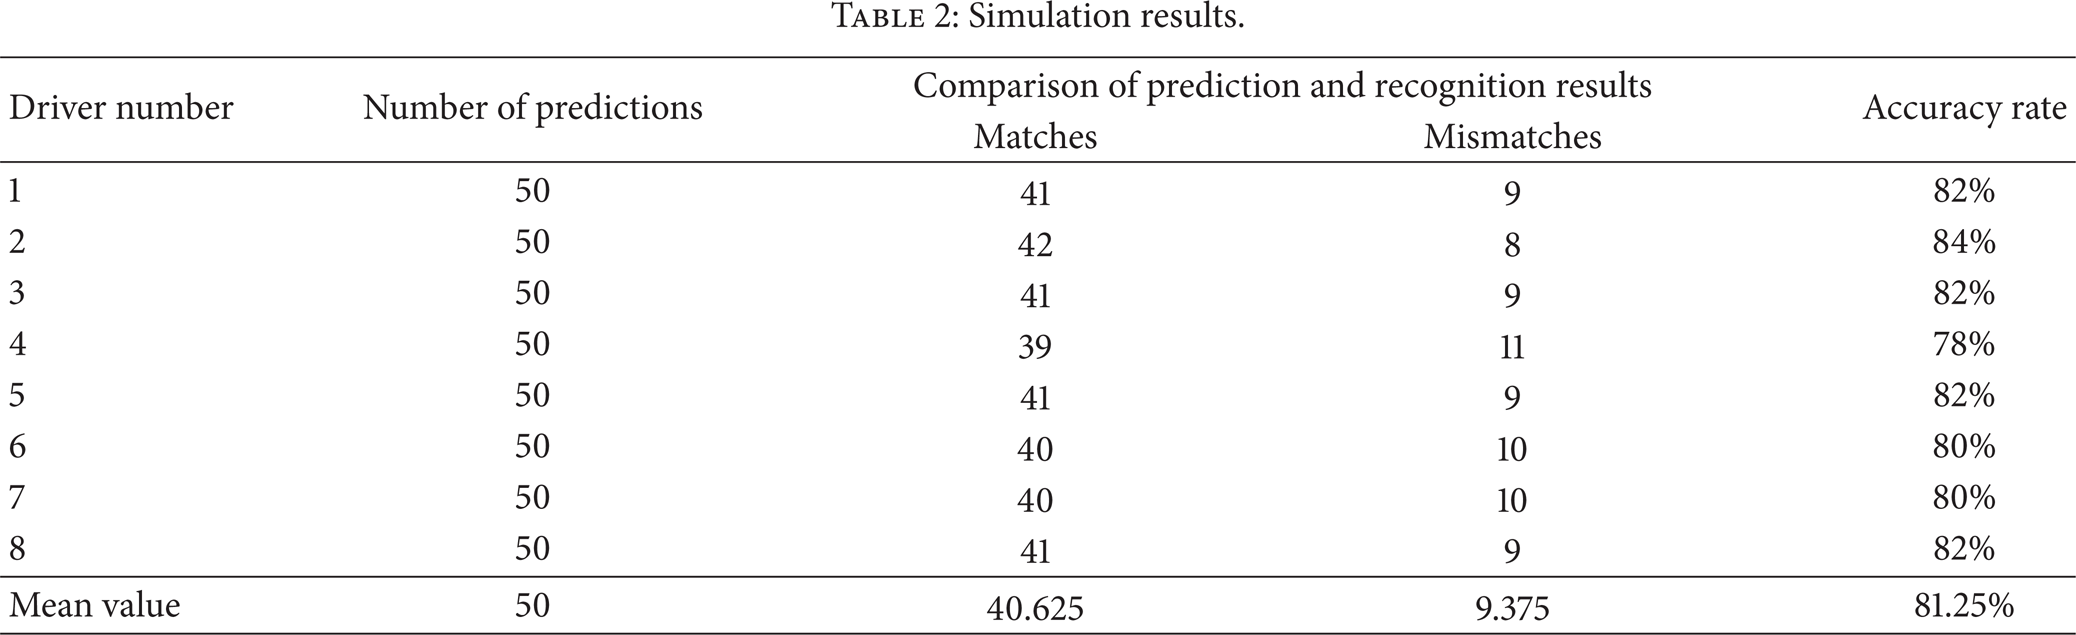
According to Table 2, the results obtained with the established prediction model agree well with the dynamic recognition results.
5. Conclusion
Vehicle group relationships partly affect driving behavior states and guide the evolution of driver's propensity. Its formation and transformation mechanism are affected by driving behaviors all the time. It plays a significant role in research on active driving and autodriving systems by precisely revealing the vehicle group transformation mechanism in complex environments. In this paper, the mechanism of transformation among different vehicle group types is revealed based on a complexity analysis and recognition of possible vehicle group types under three-lane conditions. The verification results show that the vehicle group relationship model under three-lane conditions can predict accurately future vehicle group types. The study establishes a basis for further work on driver propensity evolution and driver propensity-centered automobile active safety systems. Because only distance was considered to determine if a vehicle had effect on the target vehicle, and the influence of following vehicle was ignored, the accuracy of the model is not high. For further studies, we will consider all surrounding vehicles and calculate their influence by speed, distance, and vehicle types. It should be pointed out that the influence of a complex environment on a driver involves more factors than those mentioned above. In addition, other factors profoundly influence vehicle group formation: driver's emotion, intention, and behavior, such as road capacity and service levels; proportion of vehicles' types, especially the number of large vehicles; sequential activities of moving entities on the adjacent lane. The number of restrictive factors needs to be increased gradually in subsequent research. According to the different types of vehicles and their driving characteristics, vehicle group evolution should be explored further for fully and accurately revealing the transformation mechanism in more complex environments.
Conflict of Interests
The authors declare that there is no conflict of interests regarding the publication of this paper.
Footnotes
Acknowledgments
This study was supported by the National Natural Science Foundation of China (61074140), Natural Science Foundation of Shandong Province (ZR2010FM007, ZR2011EEM034), Key Disciplines (Lab) Excellent Skeleton Teachers International Exchange Visitor Program of Shandong Province, and Young Teacher Development Support Project of Shandong University of Technology.