
Abstract
The skyline query processing technique plays an increasingly important role for multicriteria decision making applications in wireless sensor networks. The technique of saving energy to prolong the lifetime of sensor nodes is one of the dominating challenges to resource-constrained wireless sensor networks. In this paper, we propose an energy-efficient skyline query processing algorithm, called the histogram filter based algorithm (HFA), to efficiently retrieve skyline results from a sensor network. First, we use historical data at the base station to construct histograms for further estimating the probability density distributions of the sensor data. Second, the dominance probability of each tuple is computed based on the histograms, and the optimal tuple which has the largest possibility of dominance/filtering capability is obtained using in-network aggregation approach. After that, the base station broadcasts the optimized tuple as the global filter to each sensor node. Then, the tuples which do not satisfy the skyline query semantics are discarded to avoid unnecessary data transmissions. An extensive experimental study demonstrates that the proposed HFA algorithm performs more efficiently than existing algorithms on reducing data transmissions during skyline query processing, which saves the energy and prolongs the lifetime of wireless sensor networks.
1. Introduction
Rapid advances of embedded systems, sensing, and wireless communication technologies have fostered the developments of wireless sensor networks. The sensor nodes perceive, gather, and process information of monitoring area, such as light, temperature, and humidity, and transmit the information to remote users via wireless communication. Wireless sensor networks have been widely applied to many fields, such as defense military, environmental monitoring, and traffic management. The sensor nodes are generally battery powered and have limited energy. In real applications, sensor nodes are often deployed in harsh environments, which makes changing batteries unpractical. Therefore, applications over wireless sensor networks need an energy-efficient method to process data gathered by sensor nodes [1].
To support data query processing in wireless sensor networks, TinyDB [2] and Cougar [3] systems have been proposed which developed some basic aggregation operations, such as MAX and MIN. Other types of user queries for a wireless sensor network such as Join queries [4, 5], kNN queries [6], top-k queries [7–9], and skyline queries [10, 11] which have been widely studied in recent years are not supported by these systems. In this paper, we focus on the skyline query as it is one of the important means of multicriteria decision making problems. Börzsönyi et al. [12] first proposed skyline queries and introduced a classic example to describe it in database community. Suppose one person is going on holiday to Nassau and queries the hotel database to find one that is cheap and close to the beach. Generally, the hotels near the beach tend to be more expensive and ones with low prices are far from the beach, which lead to the fact that the database cannot return one best result to the user. However, there may exist some interested hotels not worse than any other hotel considering both distance and price. The set of interesting hotels forms a skyline. Specifically, skyline query is to select tuples which are not dominated by any other tuple from a given set of tuples T of D dimensions space. A tuple dominates another one if it is as good or better in all dimensions and better in at least one dimension. Take Table 1, for example; there are six hotels listed in the table. Although
Information of hotels.


Example of Nassau beach.
The skyline query can be used in many applications in wireless sensor networks. Take monitoring wild animal's behavior, for example. Outdoor biologists can collect information of birds to analyze birds' behavioral habit through wireless sensor networks. If a biologist wants to study the ecological relationship between the groups of birds in a region, he may hope that the observation area has more species and lager quantity of birds. Sensors can be deployed to monitoring these conditions in the forest to find the most suitable area for monitoring birds' behavior. Besides, scientists can also use wireless sensor networks to study wild fish. Sensors can be deployed to monitor river regions with specific water temperature and water flow speed, so that these regions can be used to study the specific kind of fish.
In wireless sensor networks, each sensor node collects data continually, so there is a mass quantity of data in the network. Sensors cannot deal with such a large amount of data due to their limited computing ability. Besides, there is no significance to computing the skyline over the whole time. Therefore, we use a sliding window to constrain the data and retrieve the skyline from the latest data in the sliding window. Most previous studies have resolved the skyline query problem in a centralized way. However, if all sensor data is collected to the base station to conduct a skyline query, it will greatly increase the number of data transmissions. Because the wireless transmission in sensor networks is the main aspect of energy consumption, the large number of transmissions will spend a lot of energy, which leads to the sensor nodes malfunction. If we install a filter in each sensor node to discard tuples which will not be included in final skyline results, it will avoid a large amount of data to transmit so as to reduce the energy consumption and prolong the lifetime of the sensor network. In this paper, we propose a histogram filter based algorithm (HFA) to handle a sliding window skyline query problem. First, we use the historical data at the base station to construct histograms for further estimating the probability density distributions of the sensor data. Second, the optimal tuple is computed based on the histograms and a maximal dominance region mechanism. After that, the base station broadcasts the optimal tuple as a global filter to each sensor node. Then, the tuples which do not satisfy the skyline query semantics are discarded to avoid unnecessary data transmission. The contributions of this paper can be summarized as follows.
We take a sliding window skyline query into account, which does not need to collect all sensor data to answer a skyline query and is more practical in real applications. We take advantages of the multivariate histograms to estimate the distribution of sensor data, thus, capture tuples with the largest capability of the dominance. And a maximal dominance region mechanism is used to compute the optimal tuple. The base station broadcasts the optimal tuple as a global filter to each sensor node so as to prune dominated tuples. We conduct extensive experiments to evaluate our proposed method. And the experimental results show that the HFA algorithm is energy-efficient.
The rest of this paper is organized as follows. Section 2 introduces the related work of skyline query processing algorithms. In Section 3, a sliding window mechanism is described and a multivariate histogram constructing policy is introduced. In Section 4, we propose an energy-efficient skyline query algorithm based on multivariate histograms. Experimental results are illustrated in Section 5 and Section 6 concludes this paper.
2. Related Work
The skyline query processing techniques have been widely studied in recent years. After Börzsönyi et al. [12] introduced the skyline operator into the database community, a lot of improved algorithms were proposed, which can be divided into two types: with/without indexes. The block-nested-loop algorithm (BNL) and divide-and-conquer algorithm (D&C) [12] are two typical methods without indexes. Tan et al. [13] proposed a Bitmap algorithm to compute skyline, which progressively return the interesting points. Bitmap exploits a bitmap structure to quickly identify whether a point is an interesting point or not. As the mapping way Bitmap utilizes may cause the length of string to increase rapidly due to increasing values of different dimensions, it will take up a lot of storage space. Chomicki et al. [14] proposed an algorithm named sort-filter-skylines (SFS) as a variant of BNL. And Godfrey et al. [15] introduce the linear elimination sort for skyline (LESS) based on SFS. Börzsönyi et al. [12] also proposed methods with indexes using B-tree and R-tree to handle skyline query problem. Tan et al. [13] introduced Index algorithm. The algorithm exploits a transformation mechanism and a B+-tree index to return skyline points in batches. Each point is transformed into a single dimensional space and stored in a B+-tree structure. Points with some common features are clustered together. Kossmann et al. [16] proposed nearest neighbor algorithm (NN), and it is the first user-friendly skyline computation method. Papadias et al. [17] took advantage of R-tree to establish index for the data and proposed a progressive algorithm called BBS (branch and bound skyline) which is optimal in terms of node accesses.
In addition to a centralized environment, the skyline query has been widely used in distributed, peer-to-peer (P2P), Web, and road network environment. Hose and Vlachou [18] described in detail the skyline query processing algorithm in the distributed environment. Wang et al. [19] proposed Skyframe, which consists of two querying methods for efficient skyline processing in Peer-to-Peer systems. And they introduced a method to balance the query loads among the peers in Skyframe through both load induced data space partitioning and dynamic load migration. The Skyframe algorithm can quickly respnd to a query and has lower communication cost. Tao and Papadias [20] studied skyline computation in stream systems that consider only the tuples that arrived in a sliding window covering the W most recent timestamps. Balke et al. [21] put forward an effective distributed skyline algorithm in Web information systems for the first time according to the characteristics of the independent Web resources distribution. Deng et al. [22] considered multisource relative skyline queries in road networks for the first time. Three algorithms are proposed to process multisource skyline queries in a constrained space.
In the past years, the skyline query problem in wireless sensor networks has been studied in the literature. Huang et al. [23] proposed a filter-based approach (FA) to retrieve skyline results from mobile ad hoc networks, which aims to reduce the cost of the communication among the mobile devices and the cost of query execution on the devices. And this method can be easily extanded to wirelss sensor networks. Kwon et al. [24] proposed a MFT-applied aggregation approach (MFTA) for in-network processing for skyline queries. Chen et al. [25] studied the problem of continuous skyline monitoring in wireless sensor network for the first time. They proposed an advanced approach that employs hierarchical thresholds at nodes and a sophisticated MinMax-threshold approach (MINMAX), which aim to minimize the transmission traffic of the entire network. Xin et al. [26] put forward a sliding window skyline monitoring algorithm (SWSMA) to continuously maintain skyline in the network. There are two filter methods, one is tuple filter approach and another is grid filter approach. Su et al. [10] proposed a skyline sensor algorithm (SkySensor) to efficiently retrieve skyline results from a sensor network. A cluster-based architecture is designed in SkySensor to collect all sensor readings from sensor nodes. Chen et al. [11] studied skyline query optimization and maintenance problems in wireless sensor networks.
The energy consumption of wireless communication has a great effect on the lifetime of sensor networks. It is not practical to collect all sensor readings to the base station to conduct a skyline query. We observe that the algorithms exploited in centralized, distributed, Web, and data stream environment are not applicable to the wireless sensor networks. Existing skyline query algorithms in sensor networks are generally based on filtering some dominated tuples to efficiently answer the skyline queries, so as to avoid unnecessary wireless communications in order to reduce energy consumption of sensor nodes. These methods mostly focus on the local filters; if all the data of one sensor node does not belong to the final skyline set, the local filter approach will not prevent these data from transmitting, which consumes a certain amount of energy. Therefore, a global filter method is necessary to design to prune nonskyline tuples as many as possible for energy-efficient skyline query processing in sensor networks.
3. Preliminaries
Assume that the tuple set of a sensor network is denoted by T, and every tuple has d dimensions. So each tuple
3.1. The Sliding Window Skyline Queries
In this paper, we focus on the skyline query in a wireless sensor network. The skyline operator is first proposed in [12]. It is represented in Definition 1.
Definition 1.
The skyline query is to find the skyline set of the given database T, which retrieves tuples that are not dominated by any other tuple. Given two tuples
Notice that we consider the smaller value of every attribute as a good one. There is no need that every tuple of the skyline needs to dominate a tuple of T. For instance, in Figure 1, while hotels
In wireless sensor networks, every sensor node collects data periodically. When a skyline query is conducted to a sensor network, if all sensor readings are gathered at the base station to process the query, it will consume a large amount of energy, which is not energy efficient. Therefore, the sensor nodes generally do not transmit mass data to base station. Instead, all sensor data is stored locally. The sensor nodes will generate large amounts of data over time. And it is impossible to store all data due to the limited storage ability of nodes. Besides, the data that is collected earlier makes no sense to the skyline query at current moment. So we don't consider these earlier collected data. On the other hand, it is not viable to process skyline query after all data has been collected because the sensor data are continuously generated. Instead, we consider the skyline of data that is falling in a sliding window. The sliding window skyline based on time stamps is represented in Definition 2 [26].
Definition 2.
When the sensor node collects data, there is a time stamp 
3.2. The Construction of Histogram
We propose a histogram based approach to estimate the distribution of data in a wireless sensor network, as histograms can intuitively show the the distribution status of data. If the probability density function of data is known in advance, the tuple's dominance probability can be calculated [26] to obtain the optimal tuple which has the largest capability of the dominance.
3.2.1. The Construction of Univariate Histograms
A univariate histogram is to construct a histogram for data with one dimension. Assume that, in a wireless sensor network, there are n historical tuples stored in base station: 
The tuples of the sensor network are falling in m bins. Assume that 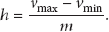
After that, the interval of every bin of the histogram is calculated using (3). The initial position of the kth bin of the histogram 
Then, the number of tuples falling in each bin is computed. And according to (2), the probability of each bin is calculated, so as to obtain the probability density function of the whole sensor network.
3.2.2. The Construction of Multivariate Histograms
Processing multidimension data query is meaningful to skyline queries in a wireless sensor network; so a multivariate histogram is needed. Assume that tuples in the sensor networks have d dimensions, and the base station trains n historical tuples:
Constructing a multivariate histogram for a wireless sensor network is as follows. Firstly, the tuples of the network are divided into d groups. Let 
Assume that 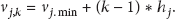
For the tuples of the whole dimensions, let 
After that, the number of tuples falling in each bin is computed using (7), and the probability of each bin is

Figure 2 shows the histogram bins of 2-dimensional data. Assume the sensor data has two attributes, data of 1st dimension is divided into 3 groups while data of 2nd dimension is divided into 4 groups, and

Bins of a multivariate histogram.
4. Histogram Filter Based Algorithm
Many methods focus on pruning nonskyline tuples to efficiently answer the skyline query in a wireless sensor network, so as to reduce the data transmission. In this section, we propose our HFA algorithm. First, a naive approach to carry out a skyline query in a wireless sensor network is introduced. Second, we discuss two methods used to compute the skyline results, known as FA [23] and MFTA [24]. Third, the details of our proposed method are described.
4.1. Basic Approach
The most direct method to compute skyline in a wireless sensor network is to collect all data in the sliding window to the base station and carry out the skyline query utilizing a centralized method. However, only a little part of the tuple set belongs to the final skyline results generally. If all tuples are delivered to the base station, a lot of nonskyline tuples will transmit in the network, which increases the energy consumption of the sensor network.
Because the skyline operator is decomposable [26], the in-network aggregation method can be used to compute skylines, which is called naive approach (NA). A spanning tree is established with the base station as the root. So each intermediate sensor node will not transmit the data to its parent until it has received all its children's skyline results. In this way, the data is combined to a message, so that it reduces the cost of wireless communication. First, each leaf node computes its local skyline and transmits the result to its parents. Second, each intermediate node merges its local skyline and the results delivered by its children and thens send the new results to its parent. Third, after the root node has received all children's results, the final skyline results can be obtained.
4.2. Methods Used to Compute Skyline Results in Wireless Sensor Networks
In the NA approach, each sensor node computes the skyline result locally and prunes some of the nonskyline tuples, so that it reduces the data transmission. However, every sensor node needs to send its local skyline to its parent. It cannot avoid some tuples to transmit because there are some tuples which belong to the local skyline but do not belong to the final skyline. If there is a filter in each sensor node, it will efficiently prevent many of the nonskyline tuples form transmitting and greatly reduce the cost of communication.
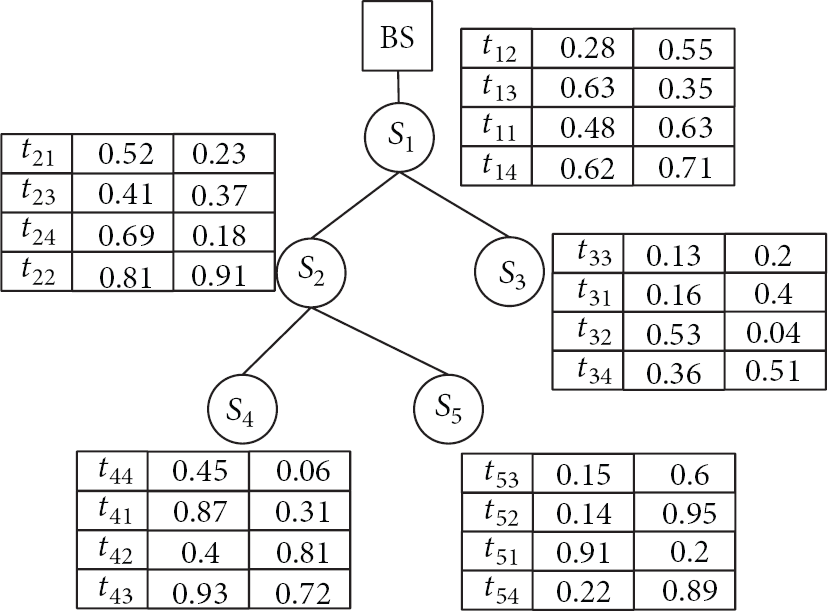
Assume that Figure 3 shows the topology structure of a sensor network. There are five sensor nodes

Topology of a sensor network.
4.2.1. FA Algorithm
In FA algorithm, a tuple
Take Figure 3, for example, assume that the base station conducts a skyline query to
4.2.2. MFTA Algorithm
MFTA algorithm utilizes a min-score filter tuple (MFT) to prune nonskyline tuples so as to avoid these tuples transmitting between sensor nodes. Tuples closer to the original point have bigger chance to dominate other tuples; so the MFTA algorithm chooses the tuple which is closest to the original point as the MFT. Each sensor node sorts the sensor reading locally according to ascending order of
MFTA approach.
In MFTA algorithm, each nonleaf node computes its local MFT. When the root sensor node receives a skyline query, it will send the query as well as its local MFT to its child nodes and compute its local skyline. When the intermediate node receives the skyline query, it will compare the received MFT and its local MFT to determine whether to update the MFT or not. After that, it will send the MFT and skyline query to its child nodes and compute its local skyline. After all leaf nodes have retrieved the local skyline set, the results are gathered to the base station. And the final skyline result is obtained using an in-network aggregation method.
Take Figure 3, for example; the tuples in Figure 4 have been sorted. When the sensor node
It can be seen from the above two examples that although FA algorithm and MFTA algorithm utilize filters at sensor nodes, the pruning effect is not obvious. We observe that the tuple
4.3. Histogram Filter Based Algorithm
If one tuple
4.3.1. The Dominance Probability
Suppose tuple 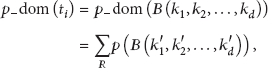
4.3.2. The Maximal Dominance Region Mechanism
Using (9), we can obtain the bin which has the largest capability of dominance because (9) is used to compute the dominance probability of the bin which tuple
Assume that 

The dominance regions of
Finally, the tuple which makes (9) and (10) the largest is chosen as final filter tuple
4.3.3. Description of the HFA Algorithm
Algorithm 1 is the pseudo-code of our proposed HFA algorithm. First, the base station uses the historical data to construct histograms for further estimating the probability density distributions of the sensor data. Second, the dominance probability of every tuple is computed based on the histograms, and the optimal tuple which has the largest dominance ability is obtained using the in-network aggregation approach. After that, the base station broadcasts the optimal tuple as the global filter to each sensor node. Then, the tuples which don't satisfy the skyline query semantics are discarded to avoid unnecessary data transmission. In the end, the final skyline result is calculated using the aggregation approach.
(1) (2) (3) Initialization: (4) sort tuples in node(i) in ascending order of the first dimension (5) (6) (7) (8) insert (9) (10) (11) (12) (13) (14) (15) (16) (17) (18) (19) (20) (21) (22) (23) remove (24) (25) (26)
For example, in Figure 3, the tuples are used to construct a multivariate histogram based on Figure 2. Figure 6 shows the probability density distribution of sensor data. Take sensor node
We can see that
The probability density distribution.
Clearly, when the bin width
5. Experimental Evaluation
In this section, we utilize synthesized datasets and real datasets to compare and evaluate the performances of naive approach NA, filter based approach FA, min-score filter tuple approach MFTA, and our proposed HFA algorithm by MATLAB simulations. All simulations are conducted on a desktop PC running on MS Windows XP Professional. The PC has a Pentium 2.8 GHz CPU and 512 MB memory.
5.1. Experimental Setup
Suppose that a sensor network is monitoring one region whose size is
Parameters used in eExperiments.
5.2. Experimental Results
5.2.1. Experimental Results of Synthetic Datasets
First, we use the synthetic datasets to conduct experiments and compare the effect of our proposed algorithm with other methods. The experiments evaluate the performance of the algorithms by changing the dimension of sensor data, the size of sliding window, and the number of sensor nodes.
Before comparing performance of the algorithms, we study how different datasets affect the size of the skyline set. Figure 7 shows the skyline size under different datasets while changing the size of sliding window, the dimension of sensor data, and the number of sensor nodes. Figure 7 indicates that the skyline size is very large in anticorrelated distribution while the skyline size is very small in correlated distribution. As the dimension of data increases, it mostly influences the skyline size of anticorrelated distribution and has little influence on independent distribution and almost has no influence on correlated distribution. The reason is that the increase of dimension adds the probability of two tuples that are not dominated by each other in anticorrelated distribution data, which makes the size of the skyline set larger. As the sliding window size grows and the number of sensors in the network increases, the size of the skyline set grows. Because the larger the sliding window size and the number of sensors, the more the number of data in the network, resulting in the increase of the skyline set size.
Effect of different synthetic datasets.
Figure 8 shows performance of the algorithms on different datasets while changing the dimension of data. Figures 8(a), 8(b), and 8(c) represent the effect of correlated distribution, anticorrelated distribution, and independent distribution datasets, respectively. It can be observed that the HFA algorithm performs best in each dimension. As the HFA algorithm takes advantage of the historical data to learn the global knowledge of the data distribution, it chooses a filter with the best quality. Therefore, HFA algorithm performs best in the four algorithms. Meanwhile, the total sending packets of the network increase along with the increase of dimension of sensor data for all algorithms, thus, resulting in a higher query processing cost. The reason is that the increase of dimension adds the probability of two tuples that are not dominated by each other, which makes the size of the skyline set larger, as shown in Figure 7(b). Because the strategy of choosing filter tuple in FA algorithm is similar to MFTA algorithm, there is no significant difference of total number of sending packets between FA and MFTA. Both of them can prune some nonskyline tuples in correlated and independent distributions, but the filtering effect is not so good as anticorrelated distribution.
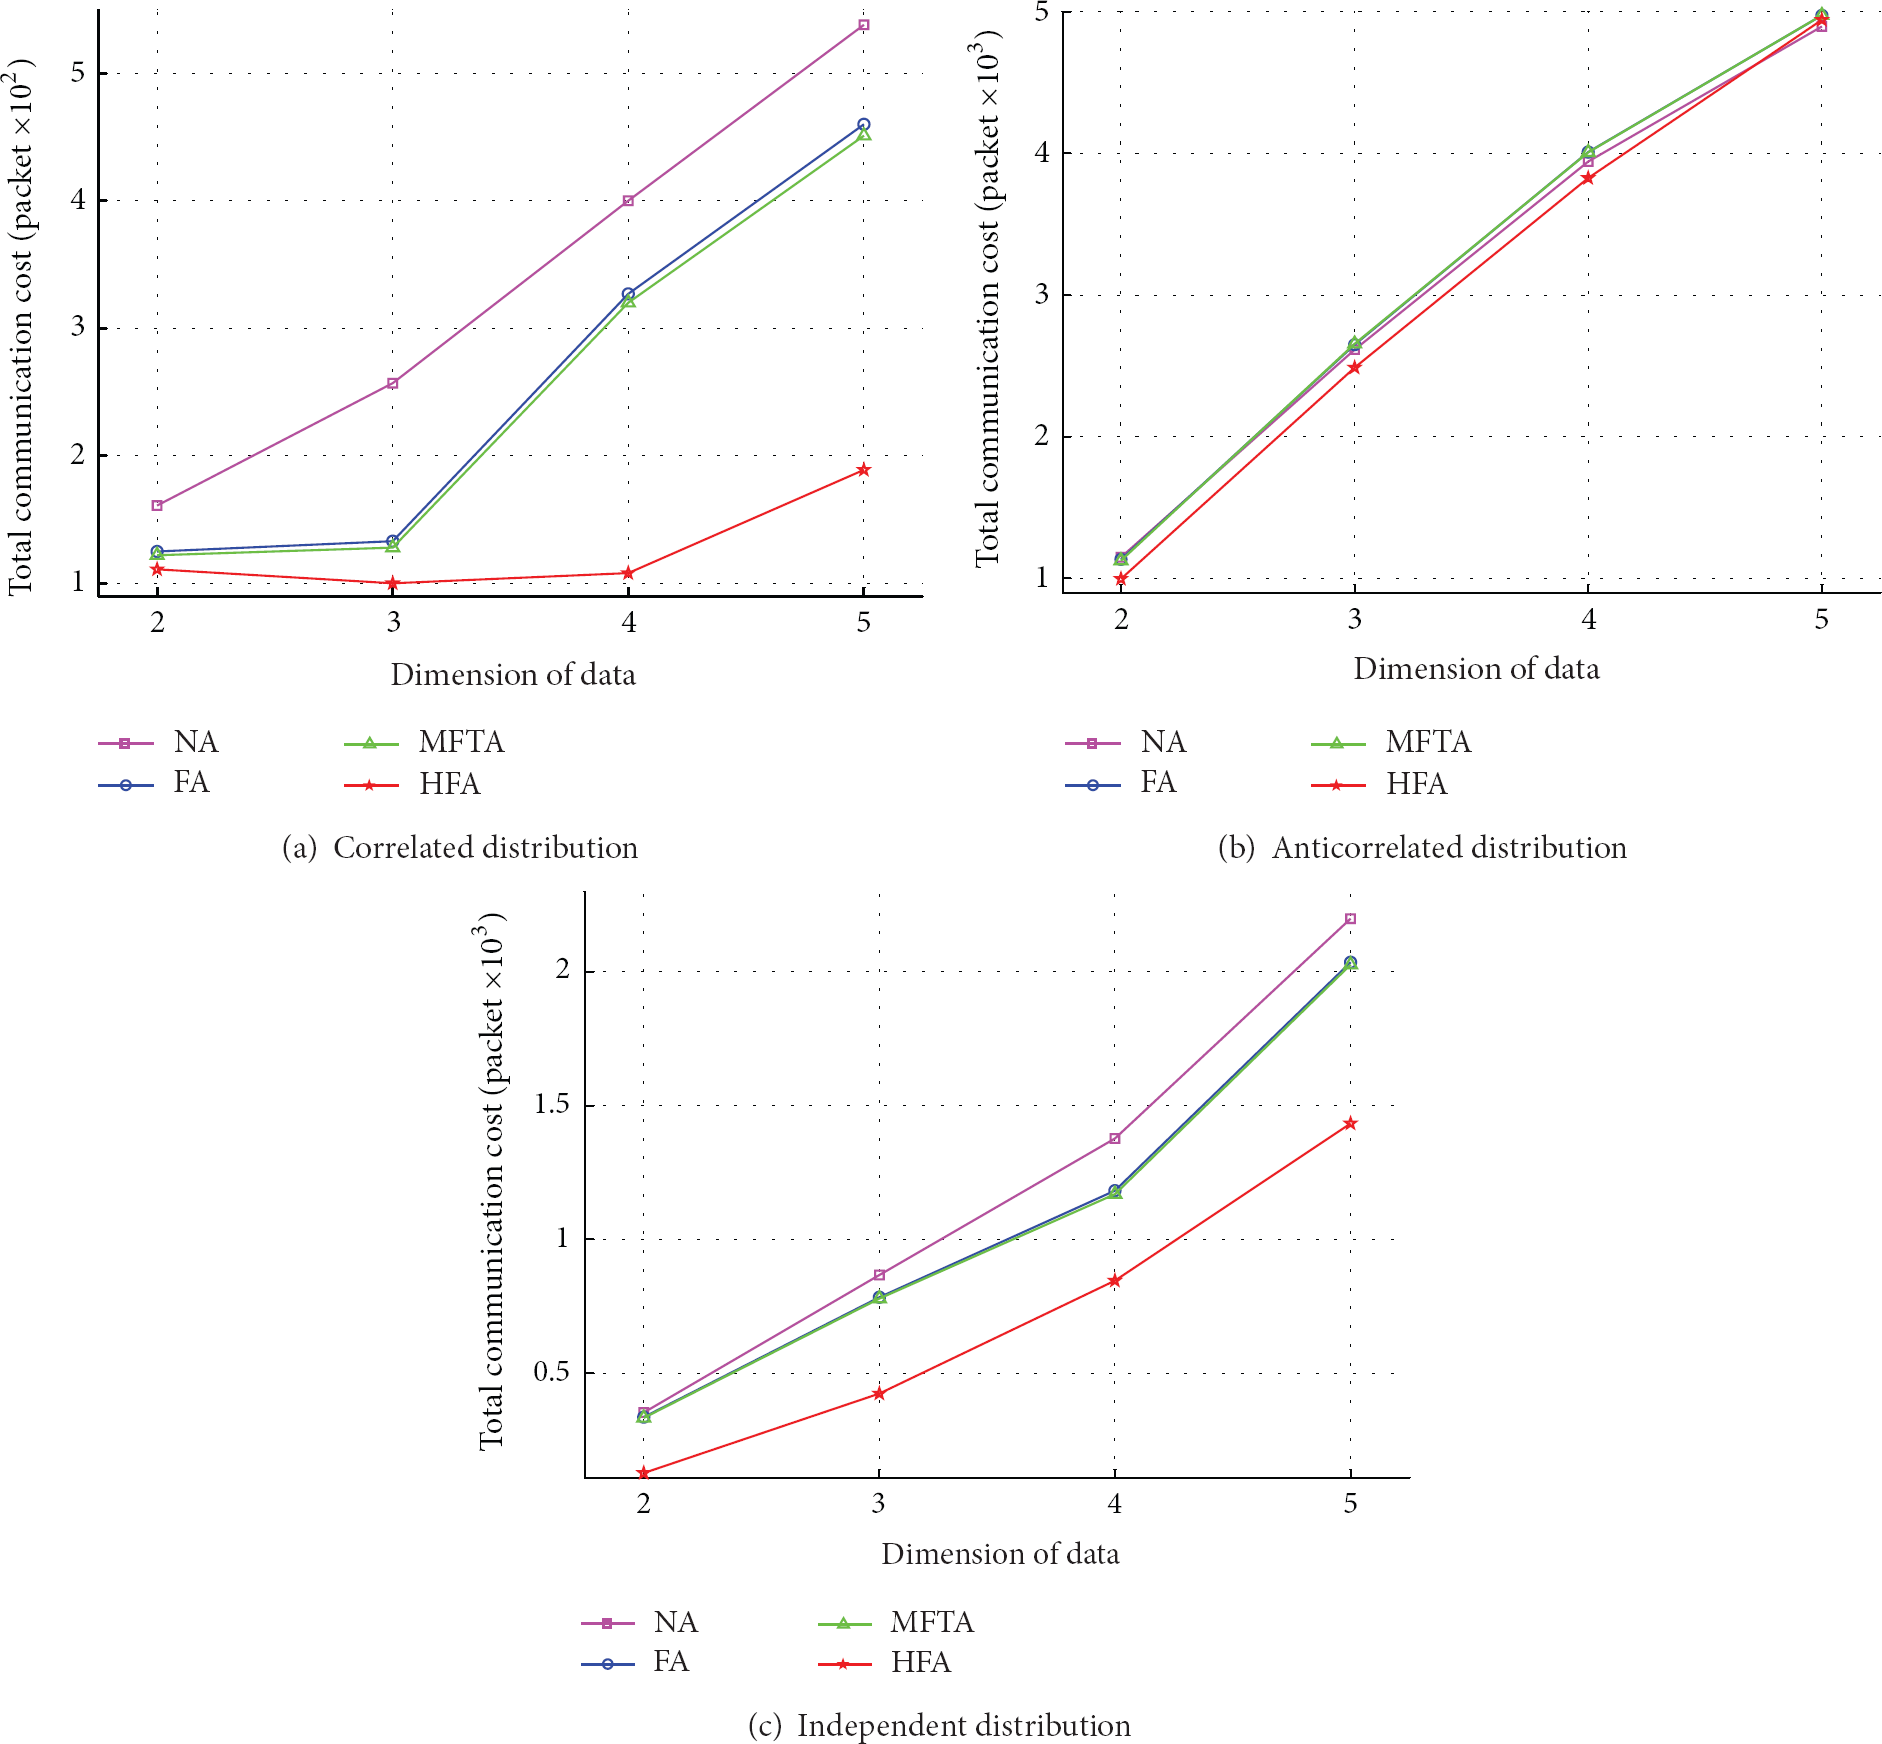
Effect of dimension of data of synthetic datasets.
Figure 9 shows the effect of different datasets on the algorithms while changing the sliding window size. Figures 9(a), 9(b), and 9(c) represent the effect of correlated, anticorrelated, and independent distributed datasets, respectively. It shows that the HFA algorithm is more efficient than other algorithms. The reason is that the HFA algorithm considers the global characteristic of sensor data and chooses an optimal tuple from the network as the global filter. Figure 9 indicates that all the algorithms require the lowest communication cost when the data distribution is correlated. When the data distribution is anticorrelated, all the algorithms need a mass of energy to transmit data. The reason is that the size of the skyline set in the correlated distribution is very small as shown in Figure 7, which causes the algorithms to only need to transfer a small amount of data in the network. However, the size of the skyline set in the anticorrelated distribution is typically large, which leads to a large amount of sending packets.

Effect of sliding window size of synthetic datasets.
Figure 10 shows the effect of different datasets on the algorithms while changing number of sensor nodes. Figures 10(a), 10(b), and 10(c) represent the effect of correlated distribution, anticorrelated distribution, and independent distribution datasets, respectively. It indicates that under different network sizes, the HFA algorithm sends less packets than the other methods, and the HFA algorithm performs best in the four methods. The total number of sending packets increases along with the increment of sensor nodes for all algorithms. The reason is that tuples of the whole network become large when the number of sensor nodes increases, so that the tuples belong to the skyline increase, as shown in Figure 7(c), which leads to the increment of communication cost.
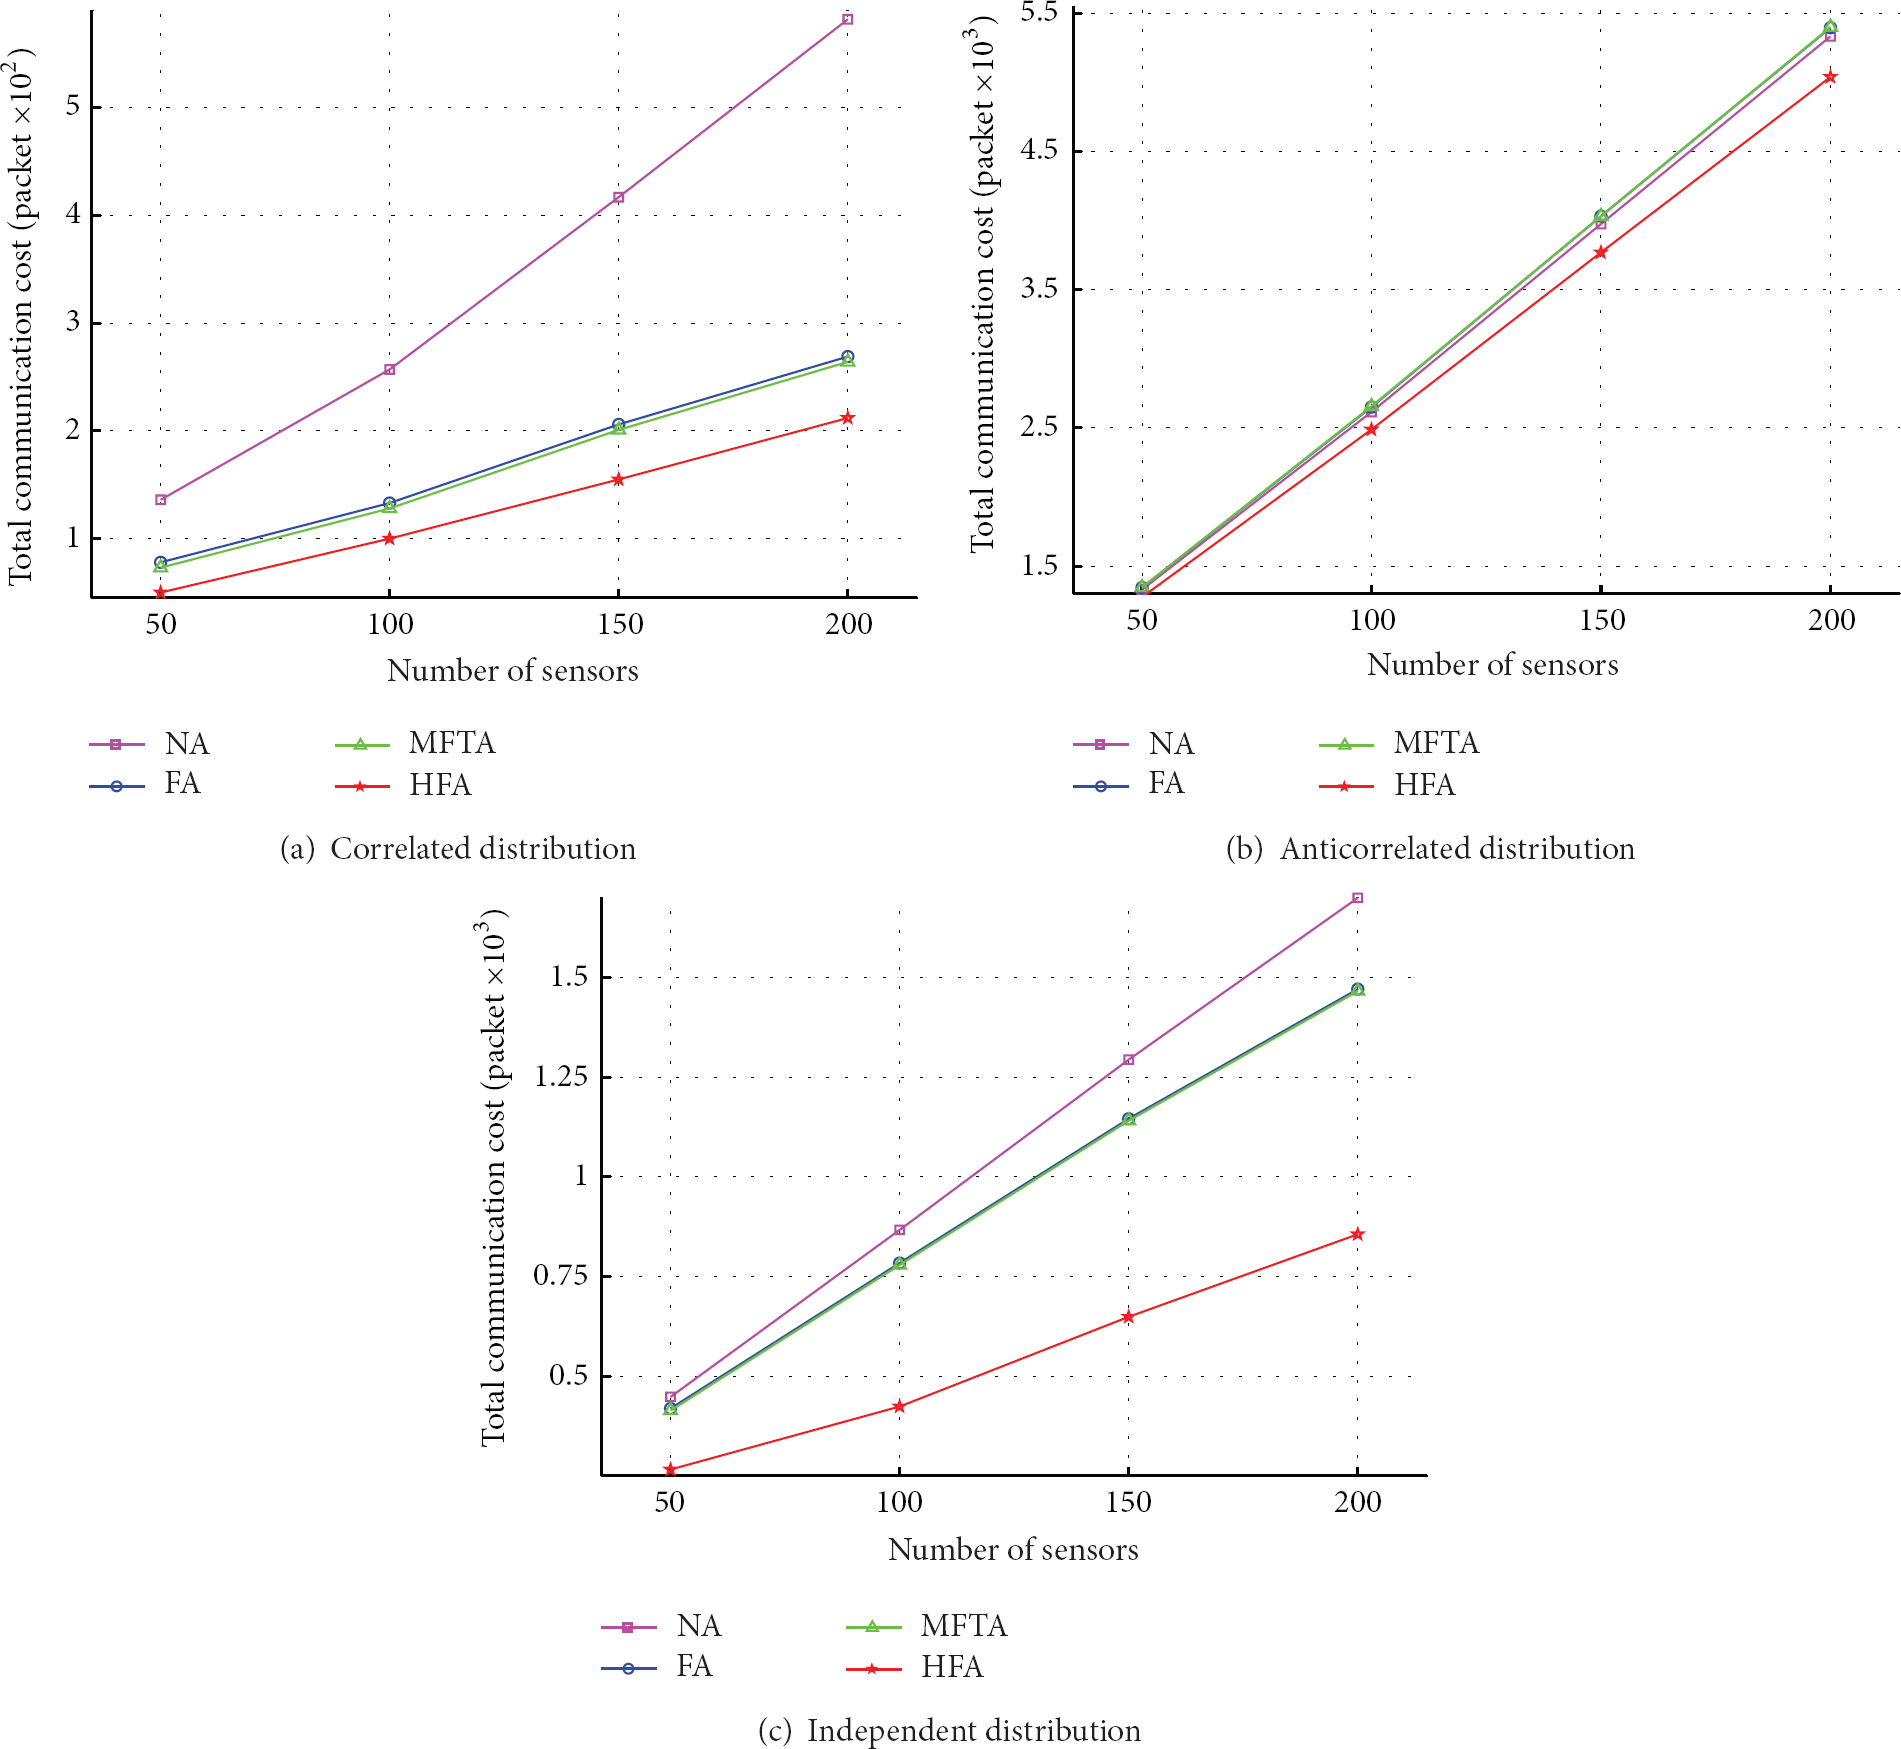
Effect of number of sensors of synthetic datasets.
5.2.2. Experimental Results of Real Datasets
We use Intel Lab Data and Washington State Climate Data for real datasets to conduct experiments and evaluate the effect of our proposed HFA algorithm. The experiments evaluate the performance of algorithms through changing the dimension of sensor data and the size of sliding window. We do not compare the influence of number of sensors on the algorithms because the number of sensor nodes in the network is fixed.
Table 3 shows how different combinations of attributes affect the size of the skyline set (the sliding window size is set to 20). For the Intel Lab Data, there are four attributes; suppose T represents temperature, V represents voltage, L represents light, and H represents humidity, respectively. For the Washington State Climate Data, there are three attributes, and T represents temperature, S represents wind-speed, and H represents humidity, respectively. As shown in Table 3, there are
Skyline size versus attribute combinations.

Figure 11 shows the effect of the two real datasets on the algorithms while changing the combinations of attributes of data (sliding window size = 20). Figures 11(a), 11(b), and 11(c) represent 2 dimensions in Intel Lab data, 3 dimensions in Intel Lab data, and 2 dimensions in the Washington State Climate Data, respectively. It demonstrates that our proposed HFA algorithm performs best in the four algorithms. The total communication of cost, that is, the number of sending packets, increases or decreases along with the skyline size. When the skyline size is small, the communication cost is low, while when the skyline size is large, the communication cost is high. The reason is that when the skyline size of the network becomes large, there is a lot of data needed to be transmitted, thus, causing a large amount of data to be delivered in the network, which results in a high energy cost.

Effect of different combinations of attributes of real datasets.
Figure 12 shows performance of the algorithms on real datasets while changing the dimension of data (sliding window size = 20). For the Intel Lab data, we consider the light and humidity attributes when data dimension is 2 and consider voltage, light, and humidity when data dimension is 3. For the Washington State Climate Data, we consider temperature and wind-speed attributes when data dimension is 2. Table 4(a) shows the skyline size when changing data dimension. Figures 12(a) and 12(b) represent the effect of the Intel Lab Data and The Washington State Climate Data, respectively. As the HFA algorithm chooses a best tuple as a global filter, it performs best in the four algorithms. Meanwhile, the total sending packets of the network increase along with the increase of dimension of sensor data for all algorithms, thus, resulting in a higher energy cost. The reason is that the increase of dimension adds the probability of two tuples which are not dominated by each other, which makes the size of final skyline set larger, as shown in Table 4(a).
Skyline size of different datasets.


Effect of data dimension of real datasets.
Figure 13 shows the effect of the two real datasets on the algorithms while changing the sliding window size. For the Intel Lab data, we consider 3 dimensions of data: temperature, voltage, and light attributes. For the Washington State Climate Data, we consider 2 dimensions of data: temperature and wind-speed. Table 4(a) shows the skyline size when changing sliding window size. Figures 13(a) and 13(b) represent the effect of sliding window size of the Intel Lab Data and The Washington State Climate Data, respectively. It demonstrates that our proposed HFA algorithm performs well. It can be seen that when the sliding window size increases, the number of sending packets increases in the Intel Lab Data, while it has little influence on the Washington State Climate Data. That is because when the sliding window size increases, the Washington State Climate Data has a smaller skyline size as shown in Table 4(b), and the sliding window size almost has no influence on the skyline size. For the two datasets, when the sliding window size grows, the number of data in the network increases, and more data needs to be transmitted, which results in a little more delivering energy.
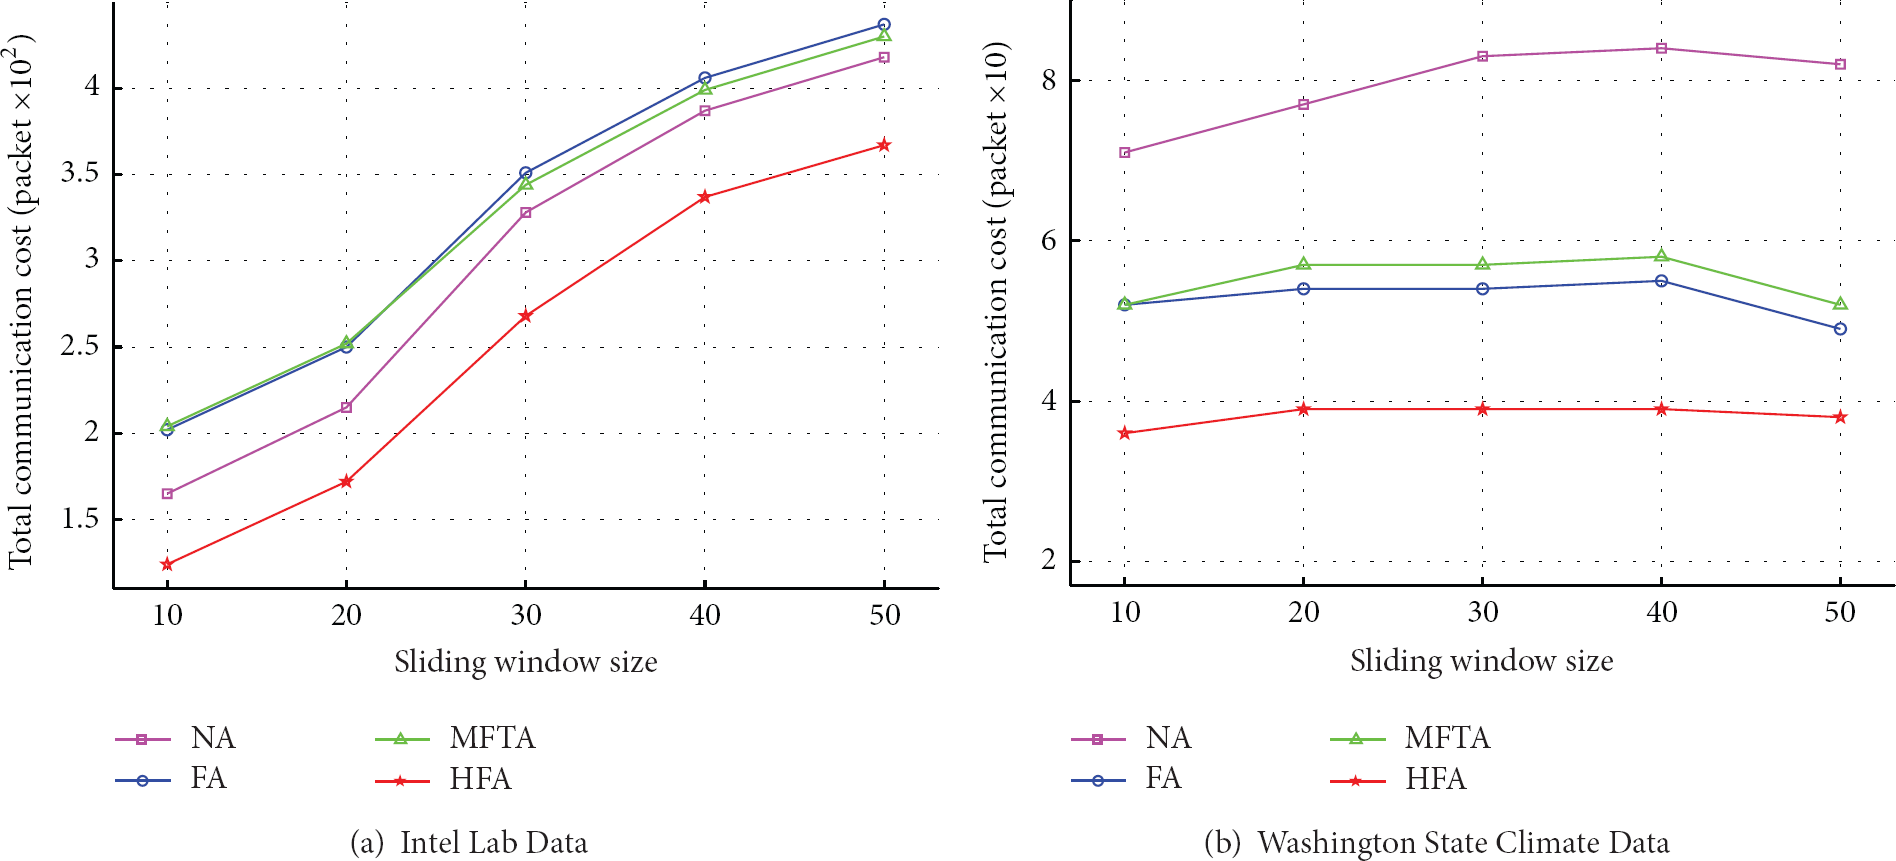
Effect of sliding window size of real datasets.
6. Conclusions
In this paper, we propose a histogram filter based algorithm HFA to process the sliding window skyline query problem in wireless sensor networks. HFA utilizes historical data to construct a multivariate histogram to estimate the probability density function of the sensor data. Then, an optimal filter tuple is chosen based on the histograms, which can prune nonskyline tuples to the maximum extent. The experimental results demonstrates that the HFA algorithm outperforms NA, FA, and MFTA algorithms and reduces the data transmissions effectively in wireless sensor networks which saves the energy and prolongs the lifetime of wireless sensor networks. Further interesting work is to extend our HFA algorithm to processing some variations of skyline queries, such as continuous skyline queries and k-dominant skyline queries.
Footnotes
Conflict of Interests
The authors declare that there is no conflict of interests regarding the publication of this paper.
Acknowledgments
This work is supported by NUAA Research Funding of China under Grant no. NS2013089. The authors would also like to thank the reviewers for their helpful comments and advices to improve the presentation of the paper.