
Abstract
For numerically simulating 3D solid-liquid turbulent flow in low specific speed centrifugal pumps, there exist several problems including how to design geometrical shape of the calculation model to represent the real pump and how to predict pump performance accurately to guide the design of pump. To solve these problems, four kinds of geometric models were designed. The performance of a low specific speed solid-liquid centrifugal pump was predicted, and the results showed that the improved prediction methods are more accurate than the traditional method. Moreover, the simulation results of the entire flow field of the geometric model including balance holes and the lateral clearances of impeller in which liquid rotates with half speed of impeller are closer to the real situation.
1. Introduction
The flow inside the centrifugal pump is highly complex mainly due to 3D flow structure involving turbulence, secondary flow, cavitation, and unsteadiness. In recent years, a growing availability of computational resources and progress in the accuracy of numerical methods brought turbomachinery computational fluid dynamics (CFD) methods from pure research work into the competitive industrial markets. The accurate prediction of the pump performance is of important significance for its design and manufacture. Over the years, a large amount of research has been made and a very significant achievement has been obtained [1–8]. About the effect of media and flow characteristic on the performance of slurry pump, Arakawa et al. [9] found that the performance of slurry pump of transporting solid-liquid two-phase fluid is lower than the performance of single-phase water transport, and particle state has a great influence on the pump impeller pressure distribution and pressure changes. Zhao et al. [10] simulated a 3D turbulent flow in an entire centrifugal pump under various operating conditions, and the calculation results indicated that the pressure is higher on the pressure side than that on the suction side of the blade. About the effect of structure on the performance of slurry pump, Levy and Kalman [11] conducted experiments to determine tip clearance effects on the characteristics of an open impeller centrifugal pump. Test results showed that running tip clearance has a considerable impact on the pump performance, and thus it must be taken into account for pump design and selection. González et al. [12] showed the capability of a numerical simulation in capturing the dynamic and unsteady flow effects inside a centrifugal pump due to the impeller-volute interaction. Wang et al. [13] studied the influence of boss structure with different parameters on pump performance and found that boss structure has greater impact on head and efficiency, but less impact on shaft power. About performance prediction models and simulation methods, Williams and Amiee [14] found that no method gives an accurate prediction for all of the pumps after making comparative evaluation of eight existing correlations to predict performance of centrifugal pumps. Medvitz et al. [15] observed that characteristic performance trends were associated with off design flow and blade cavitation by using 3D analysis. The rapid drop in head coefficient at low cavitation numbers (breakdown) was captured for all flow coefficients. Bross and Addie [16] developed a simple model to predict the influence of different impeller design parameters on the wear behaviour of the impeller suction sealing. Shah et al. [17] reviewed and summarized the former research and believed that unsteady Reynolds-averaged Navier-Stokes equations together with two-equation k-ɛ turbulence model were appropriate for CFD analysis of centrifugal pump. The most active areas of research and development are the analysis of two-phase flow pump with non-Newtonian fluids and fluid-structure interaction.
For two-phase flow centrifugal pump especially with low specific speed, jet and flow separation phenomena are easily produced in the impeller outlet due to its narrow internal flow channel, and reflux exists in the axial clearance located in the front cover plate, which make the estimation of energy loss of the back blades very difficult. Therefore, the simulation results of single impeller in previous studies differ greatly from experimental data, and it is necessary to find an accurate and reliable entire model and a good hydraulic performance prediction method. Meanwhile, the low specific speed centrifugal pump often runs in different operating conditions, and the simulation results usually agree well with experimental data at the design point, but large errors of prediction may occur at the off-design points, which is also an important problem in theoretical and numerical research. In order to solve the above-mentioned problems, four kinds of different geometric computation models were designed. The simulation results showed that the entire flow field of the geometric model is closer to the real situation, because it includes balance holes and the lateral clearances of impeller in which liquid rotates with half speed of impeller.
2. Construction of 3D Geometric Model of the Whole Flow Passage of a Solid-Liquid Centrifugal Pump
2.1. Computational Fluid Domain
The simplified method is usually used in the previous 3D calculation model of a low specific centrifugal pump, which involves only two parts of impeller and volute, and ignores the effect of the lateral clearances of impeller on hydraulic performance. So the simulation results of head, power, and efficiency deviate from the test pump performance with a large error, which is not valuable for the design and manufacture of pump. In fact, the lateral clearance of impeller cover and Sandy Bay is the main cause of volumetric and hydraulic losses in centrifugal pumps and has great influence on the flow in impeller passages [18, 19]. Therefore, a model based on the whole flow field is applied to the low specific speed centrifugal pump, which includes the rotation of the impeller, blade junction region, the lateral clearances of impeller, and balance holes. To the best knowledge of the authors, there is no numerical study including the effect of lateral clearances of impeller cover and disk clearly. In the present studies, 4 models are designed and calculated, and the details are listed in Table 1.
Four kinds of different geometric computational models.

2.2. 3D Modeling and Mesh Generation
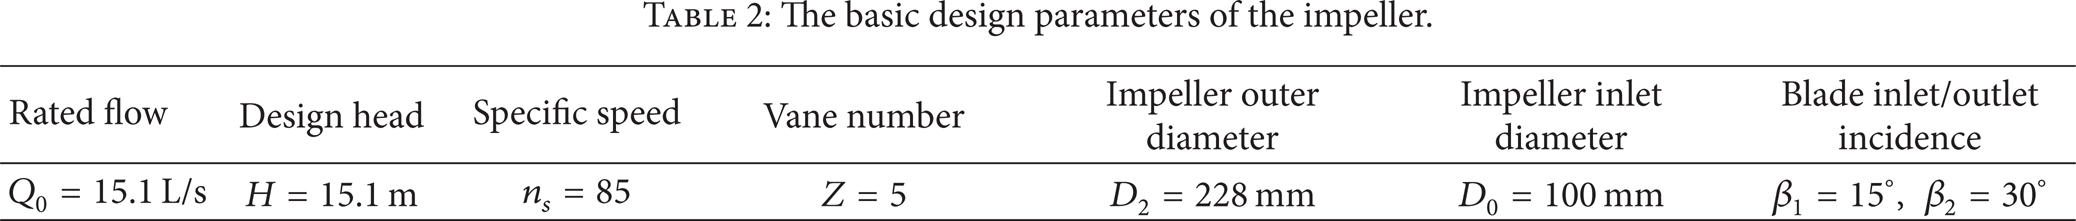
Kumar gave detailed data on head, power, and efficiency in pumping clear water and solid-liquid two-phase mixtures (water and bottom ash) [20]. In order to compare with the experimental results, the centrifugal pump provided by Kumar [20] was used as the model pump for numerical simulation. The coordinates x, y, and z and the origin (the center of impeller disk) are shown in Figure 1. At the design point, the pump has a flowrate of Q = 15.1 L/s, head of H = 20.3 m, and rotational speed of 1450 rpm. The main parameters of the impeller are listed in Table 2. The different flow channels (balance hole, lateral clearances of impeller cover and disk, and impeller) of pump model are shown in Figures 1(a), 1(b), and 1(c). For the whole flow field model of the low specific speed centrifugal pump, the sizes of balance holes and lateral clearances of impeller are much smaller than the overall pump, so it is necessary to adopt the method of block grid. The dividing block grid method was adopted with a dense grid generated in the gap and sparse grid in impeller flow passages and volute. ANSYS 12 ICEM was used to mesh the geometric model. The tetrahedral type of elements was used for the discretization of all the components of the centrifugal pump. The meshed photographic view of the pump is shown in Figure 1(c). The information of the mesh number for different parts is given in Table 3.
The basic design parameters of the impeller.
Mesh number for different parts.


Pump calculation models and mesh.
3. Calculation Model of Pump Performance
3.1. Prediction Model of Pump Performance Based on 3D Turbulence Flow Simulation
The performance of slurry pumps is much lower than that of the conventional clean water pumps. The deterioration in performance could be attributed to the incorporated modifications and the addition of solid particles in the carrier liquid. It is difficult and time consuming to evaluate the performance of these pumps with all types of slurry. To overcome these problems, the performance of these pumps is evaluated first with clean water and then the performance with slurries is estimated by applying suitable correction factors depending on the slurry properties.
3.1.1. Prediction Model for Solid-Liquid Pump Head
The current prediction method for solid-liquid pump head is based on water test and the empirical formula can be expressed as
H m is the solid-liquid two-phase flow pump head for the two-phase flow case. H0 is the solid-liquid pump head obtained by the clean water test. R H is head ratio which is the ratio of the head developed with slurry in meters of slurry column to that with water in meters of water column (m water) when the other parameters are fixed. Many investigations have been made, Bonnington summarizes the test results of performance changes for pumping slurry from 1927 to 1955 [21], and the head ratio R H was considered to relate with slurry solids concentration and particle size. Yajima [22] introduced the curves of R H with volume concentration C v and relative particle size d50/D2. The curves show that head ratio R H decreases with increasing C v and d50/D2, but the decrease in R H is not linear with increase in C v and d50/D2.
The flow in the solid-liquid pump differs greatly from that in the water pump as the solid-liquid centrifugal pump is designed based on two-phase flow principle. So using water as the working medium is questionable in the solid-liquid pump head test. In addition, the empirical formulae obtained in various experimental conditions of slurry pump are not the same, which limits their application scope. Therefore, the accuracy of the existing prediction method based on clean water test needs further to be improved.
Slurry pressure value at the solid-liquid pump inlet section (i.e., inhalation tube) and total outlet pressure value at the water pressure chamber can be obtained by surface integral functions in the FLUENT software. The pump head is defined as the total head difference between inlet and outlet of the pump and can be expressed as

where H m is slurry pump head of solid-liquid pump, m; Pmout is total pressure at the outlet section of slurry solid-liquid pump, Pa; P min is total pressure at the inlet section of slurry solid-liquid pump, Pa; Δz is position head, namely, the difference of centre levels between the pump outlet passage and inlet passage in the vertical direction, m. Pmout and P min can be obtained by surface integral function in FLUENT software, and slurry density ρ m and acceleration of gravity g are known parameters, so the head of solid-liquid pump can be achieved conveniently and accurately by (2). Theoretical head of solid-liquid pump in the traditional formula (1) is derived based on the basic assumption of “ideal impeller”, in which only impeller head is considered while the effects of suction pipe and water pressure chamber are ignored. Therefore, compared with the empirical formula (1), (2) is more reasonable to predict the head of solid-liquid pump.
3.1.2. Prediction Model for Solid-Liquid Pump Efficiency
The efficiency ratio of the centrifugal solid-liquid pump can be expressed as follows:

where Rη is the efficiency ratio, which is the ratio of the pump efficiency with slurry to that with water at the same discharge and rotational speed. In fact, the head ratio R H is not equal to efficiency ratio Rη for the solid-liquid pump is designed based on two-phase flow theory. For a certain concentration medium, efficiency of pumping solid-liquid two-phase fluid in a two-phase flow pump is higher than that of pumping water. Therefore, the accuracy of (3) used to predict the efficiency of solid-liquid pump needs further to be improved.
In order to improve the traditional efficiency prediction methods, based on 3D numerical simulation of the whole flow field, a reasonable efficiency prediction formula is put forward to calculate the efficiency of solid-liquid pump as follows:
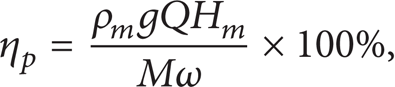
where η p is the efficiency of two-phase flow pump; Q is the volume flowrate of two-phase flow m3/s; M is the impeller torque, N·m, and ω is the impeller angular velocity, rad/s. Slurry density ρ m , acceleration of gravity g, and impeller angular velocity ω are known parameters; H m can be obtained by (2); impeller torque M can be obtained from a forces report in FLUENT software. For the concentration of C v = 0.3, the particle size of d50 = 0.23 mm, and the relative particle size of d50/D2 = 0.001, we can obtain R H = 0.82 and R H = 0.9 from Bonnington [21] curves and Yajima [22] curves, respectively, and then head and efficiency by using traditional estimation methods are got. Figures 2 and 3 show the performance curves of the pump head and efficiency with different prediction methods. Here, the predicted values of the whole flow model M3 designed in the present study have a good agreement with experimental data for pumping both clean water and solid-liquid mixture at both the design and off-design points, and it is markedly superior to other prediction methods. Therefore, based on numerical calculation of solid-liquid pump, it can accurately and conveniently predict the efficiency of solid-liquid slurry pump by using (4), and thus it can provide a basis for predicting and designing a high-efficiency solid-liquid two-phase flow pump.
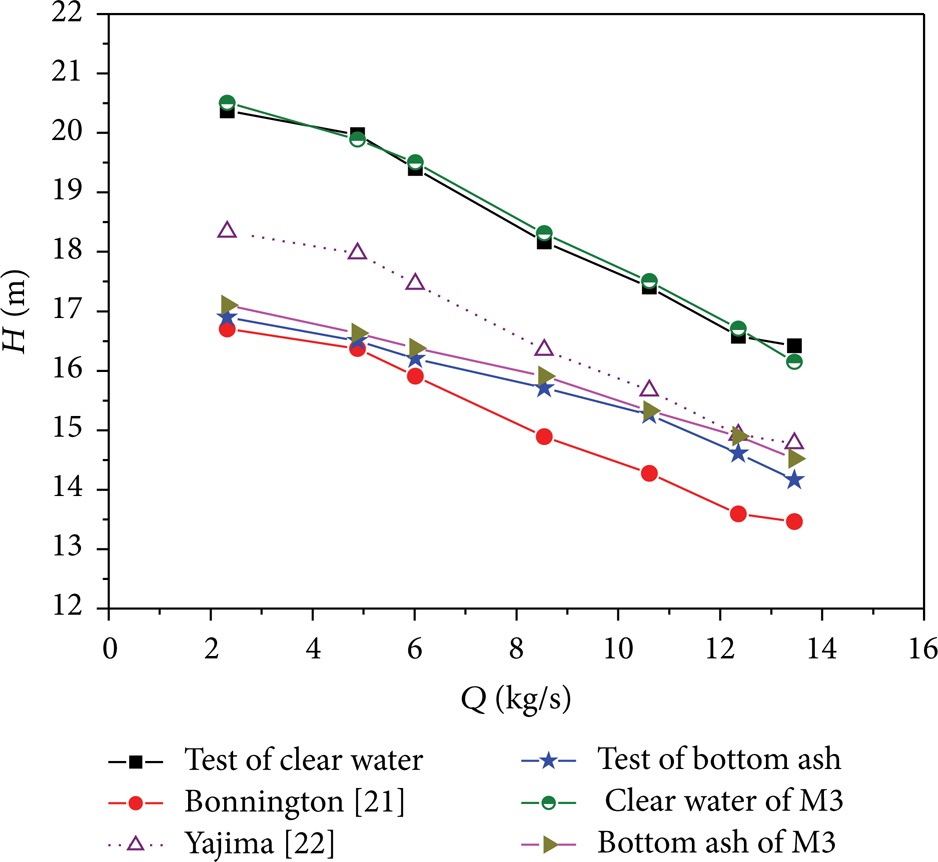
Head prediction curves with different methods.
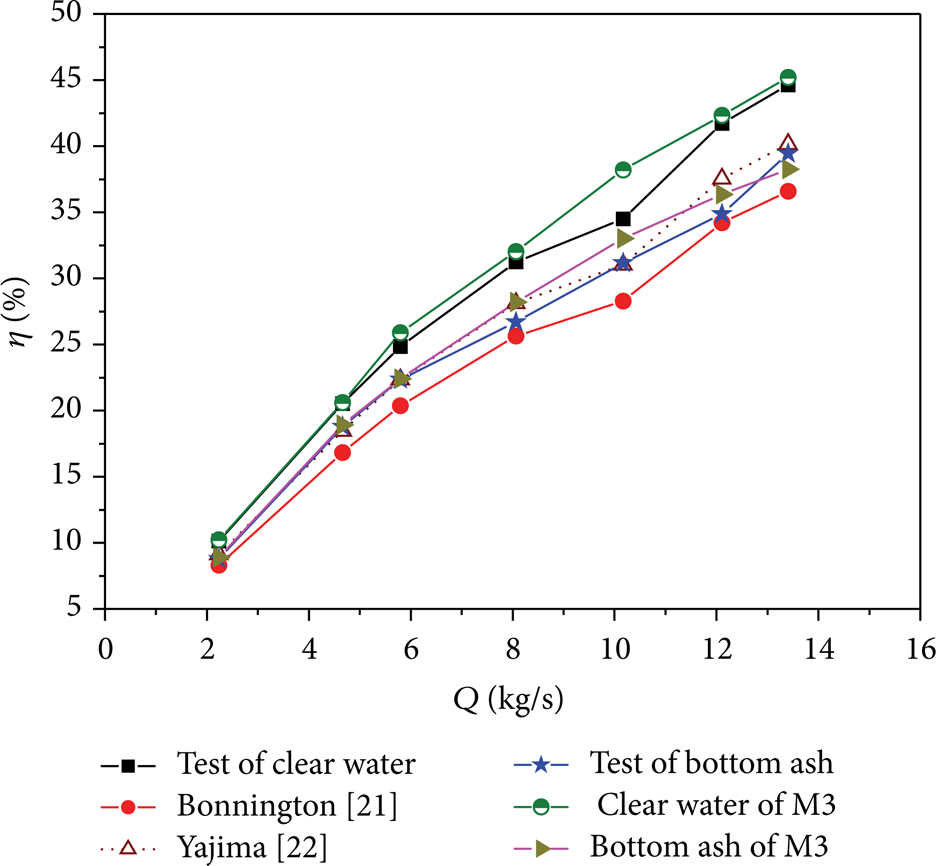
Efficiency prediction curves with different methods.
3.2. Experimental Verification
In order to verify prediction accuracy of pump performance and precision of various geometric models, a low specific speed centrifugal pump was designed as hydraulic performance test models according to [20], and the hydraulic performance curves were numerically obtained accordingly. Slurry flow through the centrifugal pump was modeled using the Euler-Euler approach with a multiphase model in ANSYS12.0. The RNG turbulence model with swirling flow correction was employed in the turbulent core region, and wall function method was selected to treat the low Re flow near the solid wall. SIMPLE algorithm was applied to deal with pressure-velocity coupling. Second-order upwind difference scheme was used for the discretization of momentum, k and ε terms. Through the 3D numerical simulation, a comparative analysis of four different calculation models was done to find out an accurate hydraulic performance prediction model for designing low specific centrifugal pumps.
3.2.1. Comparison of Accuracy of Various Models
Figure 4 shows the comparison of the calculated results of head, power, and efficiency of the four models with experimental data. We can see that for M1 model ignoring the existence of lateral clearances, the calculation results of head and power at the design point are close to the experimental value, but large errors appear at off-design points with computing power lower than the experimental value, resulting in a higher efficiency. M2 model is equivalent to an increase in friction loss of impeller, resulting in a lower head and hence a slightly larger power than the experimental data, and thus the efficiency is lower. For M3 and M4 models, the liquid in the lateral clearance of impeller disk also rotates together with the impeller, equivalent to an extension of impeller blades doing work on the liquid, and thus the head of both models is increased. The head increase for M4 model is larger because of its higher rotational speed. From the analyses of the four models, the whole model M3 is closer to the real situation with the head error of only 0.91% and efficiency error of 0.51% at the design point. Because the model does not consider the friction loss between the bearing and seal ring (this part accounts for about 3%), so the efficiency is slightly higher than the experimental data. For low specific speed centrifugal pumps, friction loss and hydraulic loss within the lateral clearances have large influences on the performance, so the head error of the model M1 without lateral clearance is 4.1% and the efficiency error reaches as large as 30% at the design point. Therefore, the whole flow field geometric model including balance holes and lateral clearances of impeller in which liquid rotates with half speed has higher prediction accuracy for the hydraulic performance prediction of the low specific speed centrifugal pump.

Comparison of the calculated performances of four models with the experimental values.
3.2.2. Error Analysis of Different Models
The causes of error and loss differences between the whole flow field model M3 and the zero clearance model M1 are further analyzed in detail. The total pressure distribution, internal flow streamlines, and vortices in different sections are shown for analyses.
Total pressure distribution of mixture phase is shown in Figure 5. The pressure of the two models increases gradually from the inlet to the volute, and the total pressure in the volute of M1 model is greater than that of M3 model. The pressure of the whole model in the lateral clearance of impeller disk is increased gently, but there is a relatively small low pressure region of the cavity body due to the existence of balance holes. Relative velocity of liquid phase and streamlines distribution is shown in Figure 6. The sizes of vortexes in the volute increase significantly in the whole model, and the apparent reflux exists in the inlet due to the low pressure regions. The zero clearance model M1 has a relatively stable flow in the inlet of the impeller, and a smaller vortex exists far away from the blade inlet. Thus it can be concluded that balance holes has an obvious impact on the flow pattern of the inlet, resulting in low head and efficiency due to the increase in hydraulic losses at the impeller inlet.

Total pressure distribution (Pa).

Relative velocity and streamlines distribution (m/s).
Vortices distribution of liquid phase in the section of z = 10 mm (z coordinate is shown in Figure 2) at the mass flowrate of 15 kg/s is shown in Figure 7. We can see that the whole model has larger amount of vortices in the entrance, resulting in greater hydraulic and volumetric losses. Meanwhile, vortices in the volute are more numerous because of the gap's impact on the whole flow field. However, at the tongue of the volute, zero clearance model has a larger influence of eddy than the whole model. The reason is that the disorder flow caused by higher flow rate and higher total pressure at the tongue in the zero clearance model leads to serious flow separation.

Vortices distribution (s−1).
4. Conclusions
Slurry pumps are extensively used in the hydraulic transportation of solid-liquid mixture through pipes in various fields. For proper design and selection of a slurry pump, extensive data are required for accurate estimation of the pump performance for the case of slurry flow at high concentrations. It is necessary to find an accurate and reliable entire model and a good method for hydraulic performance prediction. Thus, four kinds of different geometric computation models were designed and the total head, overall efficiency, and pump input power as a function of the flow rate were obtained by simulating slurry flow through the centrifugal slurry pump. Based on these studies, the following results were obtained.
Comparison of the simulation results of four geometric models with experimental results showed that the whole flow field geometric model including balance holes and the lateral clearances of impeller in which liquid rotates with half speed of impeller is closer to the real situation, which can well predict the solid-liquid pump performance.
The causes of error and hydraulic loss difference between the whole flow field model M3 and the zero clearance model M1 were analyzed. M3 model has a larger reflux and secondary flow in the inlet due to balance holes, which has an obvious impact on the flow pattern of the inlet, increasing the volumetric and hydraulic losses at the impeller inlet, and resulting in low head and efficiency.
Conflict of Interests
The authors declare that there is no conflict of interests regarding the publication of this paper.
Footnotes
Acknowledgment
This work is supported financially by the National Natural Science Foundation of China under the Grant of 51225601.