
Abstract
Thermal barrier coating (TBC) systems are highly advanced material systems and usually applied to insulate components from large and prolonged heat loads by utilizing thermally insulating materials. In this study, the characteristics of the interface of thermal barrier coating systems have been simulated by the finite-element method (FEM). The emphasis was put on the stress distribution at the interface which is beneath the indenter. The effect of the interface roughness, the thermally grown oxide (TGO) layer's thickness, and the modulus ratio (η) of the thin film with the substrate has been considered. Finite-element results showed that the influences of the interface roughness and the TGO layer's thickness on stress distribution were important. At the same time, the residual stress distribution has been investigated in detail.
1. Introduction
Thermal barrier coating (TBC) systems are widely used in modern gas turbines and jet engines. They protect materials and allow hot gas temperatures to increase the efficiency of the engine [1–4]. Their local failure in hot spots with severe impacts on the structural integrity of the engine has been prevented during operation. Therefore, the failure of TBC systems should be sufficiently understood. Experimental observations showed that the failure of TBC system is very complex and mostly affected by a superposition of different mechanisms. For instance, the initiation of cracks very close to the interface between the TBC and the bond coat (BC) seemed to be explained well by the residual stress calculations made by Chang et al. [5] and others [6–9], but their propagation was not similar with the result observed through experiment. Meanwhile, numerous models based upon different conceptions have been proposed, which might qualitatively explain how cracks propagated [6, 10–12]. All models considered oxidation at the rough interface between TBC and BC and the phenomena resulting from the redistribution of residual stresses induced by volume increasing or morphological instability of the thermally grown oxide (TGO) layer [12–17] as the driving force of crack propagation. However, all models lacked quantitative verification.
It is very interesting to apply the indentation technology to thin film/substrate (especially TBC) systems. Now many models to determine the adhesion strength have been presented [18–20]. It is important to analyze the stress characteristics of thin film/substrate systems. For example, the stress distribution of the layers has been studied by Njiwa and von Stebut [21] and Diao [22] with the boundary element method and the finite-element method, respectively. The work presented within this paper covers two factors, including the dissimilar interface roughness and the different TGO thickness. Actually, there are two different failure mechanisms of TBC systems that have been observed experimentally. The first one commonly observed [2, 6, 14, 23–25] is the crack initiation and propagation within the TBC very close to the interface between the TBC and BC. The second one is crack initiation and propagation in the thermally grown oxide (TGO) layer between the TBC and BC, which can be observed when the TGO layer becomes thicker [26] than before. Our investigations considering both the mechanisms focus on the stress distribution of the interface which will influence the initiation and expansion of the interface cracks. The approaches used for this purpose are based on the flat cylindrical indenter and the finite-element method. More details of our approach applied will be given as below.
In this paper, the finite element method has been carried on to analyze the characteristics of the thin film/substrate system. But, in the practical engineering application, we also need to consider many factors, because of a lot of thermal barrier coating systems applied in high temperature environment, so how to test displacement beneath the indenter is the primary problem. The current solution is based on the theory of the noncontact measurement. The accuracy is affected by many factors, such as noise, decoding, and model [27–31].
2. Indentation Theory
2.1. Thin Film/Substrate Material System Models
The thin film/substrate system is shown in Figure 1. The relationship between the indentation stress and the indentation depth can be obtained by the finite-element method and energy theory [32]. An energy equation can be given as
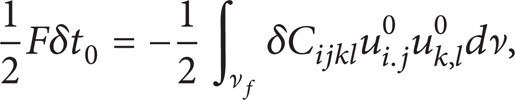
where F is the indentation stress, δt0 is the increment of the displacement of the indenter, δC ijkl = C IJKL f -C IJKL s is the increment of the modulus, u i 0, u j 0 are displacements, and f and s are the signs of the film and substrate, respectively.
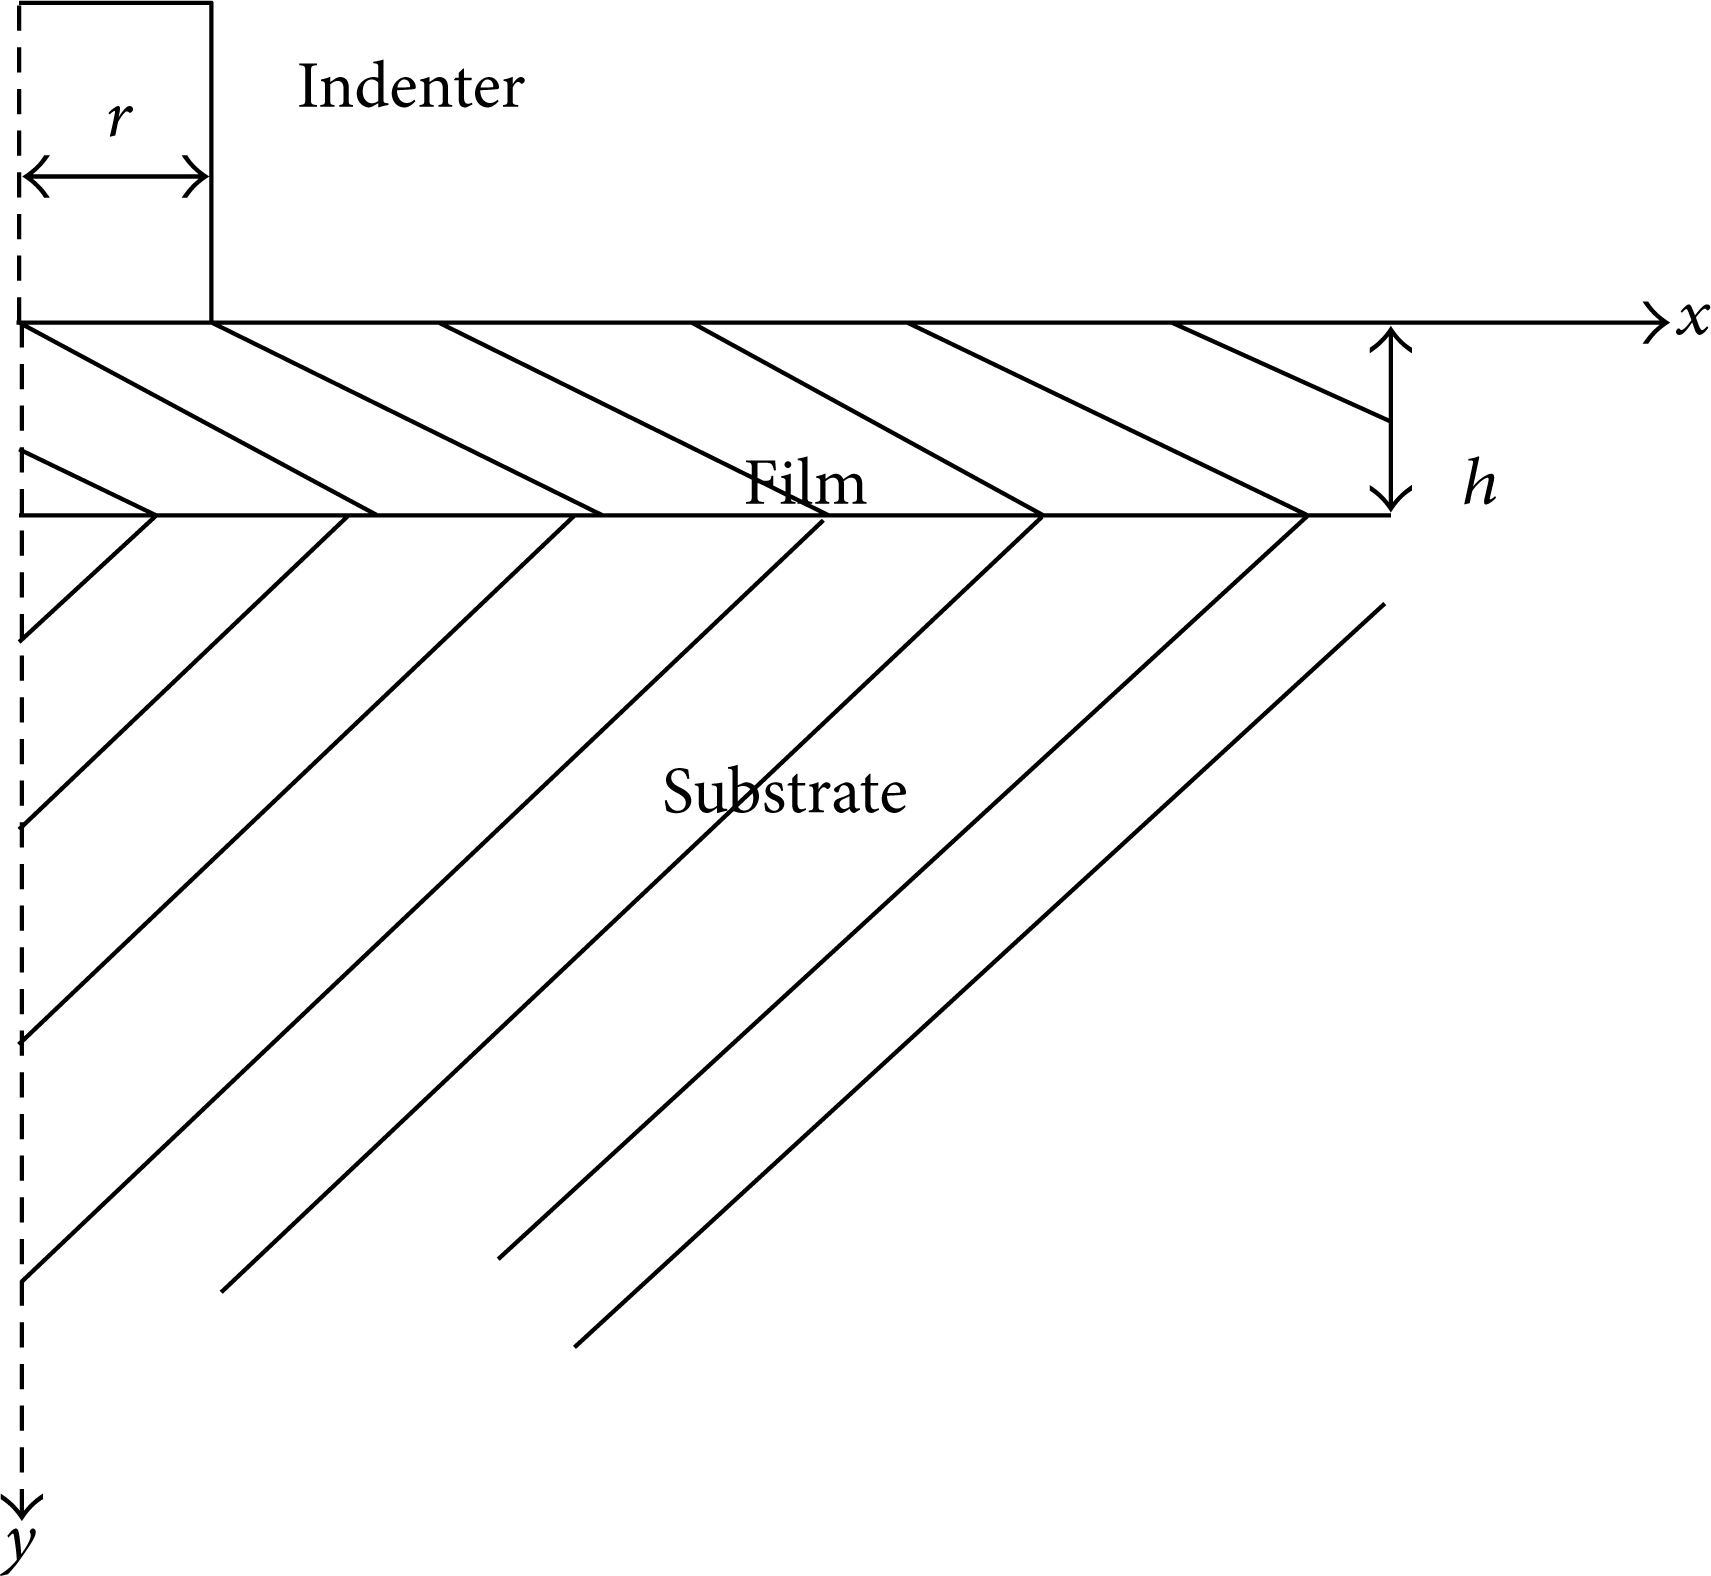
The thin film/substrate material system. In the figure, r is radius of indenter and h is the thickness of the thin film.
Firstly, the thin film/substrate system is assumed as a single-phase homogeneous material, which has a transformation of elastic properties within the region 0<y<h. The transition region is the thin-film material. In this way, the indentation displacement can be given by the following equation:
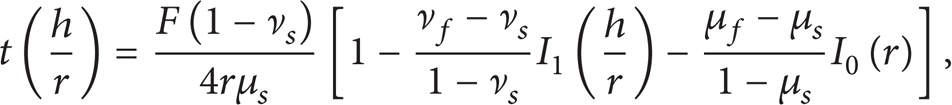
where I0 and I1 can be defined as follows:

Secondly, the thin film/substrate system is assumed as a single-phase homogenous material, which has a transformation of elastic properties within the region y>h. The transition region is the substrate material. We can derive the similar equation. Then we can give the indentation displacement equation through the above discussion:

2.2. Elastic-Plastic Model
It is very difficult to derive an analytical solution for the indentation on the elastic-plastic material. Most studies rely on the numerical methods such as the finite-element method (FEM).
2.2.1. The Thin Film/Substrate System
An indentation is made on the thin film/substrate system. The flat cylindrical stress distribution under the indenter is quite different from the bulk material, and it is impossible to derive the indentation depth equation from the theory because of the unpredictable stress generated beneath the indenter. However, these difficulties can be avoided by the finite-element analysis which is the emphasis throughout this paper.
3. Indentation Test Model and Numerical Procedures
3.1. The Model
The TBC system commonly contains three layers, including 0.5 mm TBC, 0.1 mm BC, and 1.6 mm substrate. During operation, a thin TGO layer between the TBC and BC is formed. This layer strongly influences the residual stress distribution at the TBC-BC interface. Taking this into account, the TBC system initially consists of four layers, including a 0.001 mm oxide layer (Al2O3) between TBC and BC. The volume growth of the TGO is then considered.
In addition, the TBC-BC interface roughness is modeled by a sinusoidal wavy with a wavelength in the range of 0.02 to 0.08 mm and an amplitude A in the range of 0.01 to 0.04 mm. Consequently, a region only covering a half period is considered for the FEM calculations using the right symmetry (on the left) and (on the right) boundary conditions shown in Figure 2. The substrate is assumed elastic. For this representative region, a 2D mesh is generated with the generalized plane strain elements provided by finite-element code ABAQUS [33] used for the FEM calculations. The FEM meshing is also shown in Figure 2. About 10000 elements are meshed finally in the calculation, after several comparing trying with different meshing in order to ensure that the result is independent of the FEM meshing. At the same time, the indenter is made of SiC and is assumed rigid. The radius of the indenter is kept constant (r = 5 μm) in all the calculations. The periodicity boundary condition mentioned is imposed using a multipoint constraint (MPC) of the type SLIDER, which allows the affected nodes of the mesh to move on a common rectilinear line.

The FEM meshing.
In the FE calculations, all layers are considered to be isotropic and to behave linear-elastically, except for the BC, for which an elastic-plastic behavior combined with stationary creep is assumed. Except for the Poisson's ratio (0.3 for all layers), the material properties used in the calculation are shown in Table 1. The stationary creep of the BC is of Norton's type:
Material properties used in the model.

3.2. The Finite-Element Procedure
The Young's modulus of the substrate is fixed as E S = 200 GPa [1–5]. In order to examine the effect of Young's modulus ratio, a parameter, η, is defined as

where η is changed from 0.2, 0.4, 0.6, and 0.8. It was reported that in-plan Young's modulus of EB-PVD TBC is 40–60 GPa (η = 0.2–0.3) and APS-TBC is 30–200 GPa (η = 0.15–1.0) [1–5]; therefore, η the range 0.15∼1.0 covers these Young's modulus of typical TBC systems. In this paper, we use them as the parameter of the TBC layers. At the same time, the Possion's ratio of TBC layers and substrate is assumed to be 0.2 and 0.3, respectively [1–5]. The materials are taken to be isotropic and completely linear-elastic undergoing plane strain deformation.
In order to understand the influence of different interface roughness, different roughness R a = 6.4, 12.7, 25.5 is defined, respectively. The change of the swelling is realized using an own user subroutine, which is linked to FEM code ABAQUS.
Different thickness of the TGO layer is designed h f = 1, 2, 4 μm, and h s = 3 mm, respectively, in order to understand the influence of the TGO layer.
4. Results and Discussion
4.1. The Influence of the Modulus Ratio (η) of Thin Film to the Substrate
4.1.1. Indentation Depth-Creep Time Behavior
Figure 3 gives the evolution of the accumulated indentation depth with the creep time in the film/substrate system. As shown in Figure 3, it is clearly that the indentation depth increases with the creep time increasing. And the depth decreases with η increasing for the same creep time. The reason for this phenomenon is the thin-film layer turns from soft/hard systems to hard/soft systems with increasing of η, that leads to the deformation under the indenter more difficulty. It also can be seen that the steady-state deflection decreases with η decreasing. The same results can be found in our earlier investigation [20, 21].

The change in deflection (d) with the creep time for different η.
4.1.2. Shear Stress at the Interface
The position of the biggest shear stress of S11 is on the middle peak interface position under the indenter seen in Figure 4. That is because the biggest creep stress generated here. The influence of η on the maximal shear stress of the S11 at the interface is shown in Figure 5(a). At the very beginning, the larger η leads to the larger shear stress, but after 3.5 × 10³, the larger η leads to the smaller shear stress. The reason for this phenomenon is because of that, at the very beginning, the softer film is easier to destroy and the creep stress propagates faster until it reaches the steady state. By contraries, the harder film is more difficult to destroy and reach the steady state. From the figure, it can also be seen that the shear stress begins to linearly increase approximately. It means that the interface strength may be determined through the flat cylindrical indenters test.

The distribution of the stress (S11).
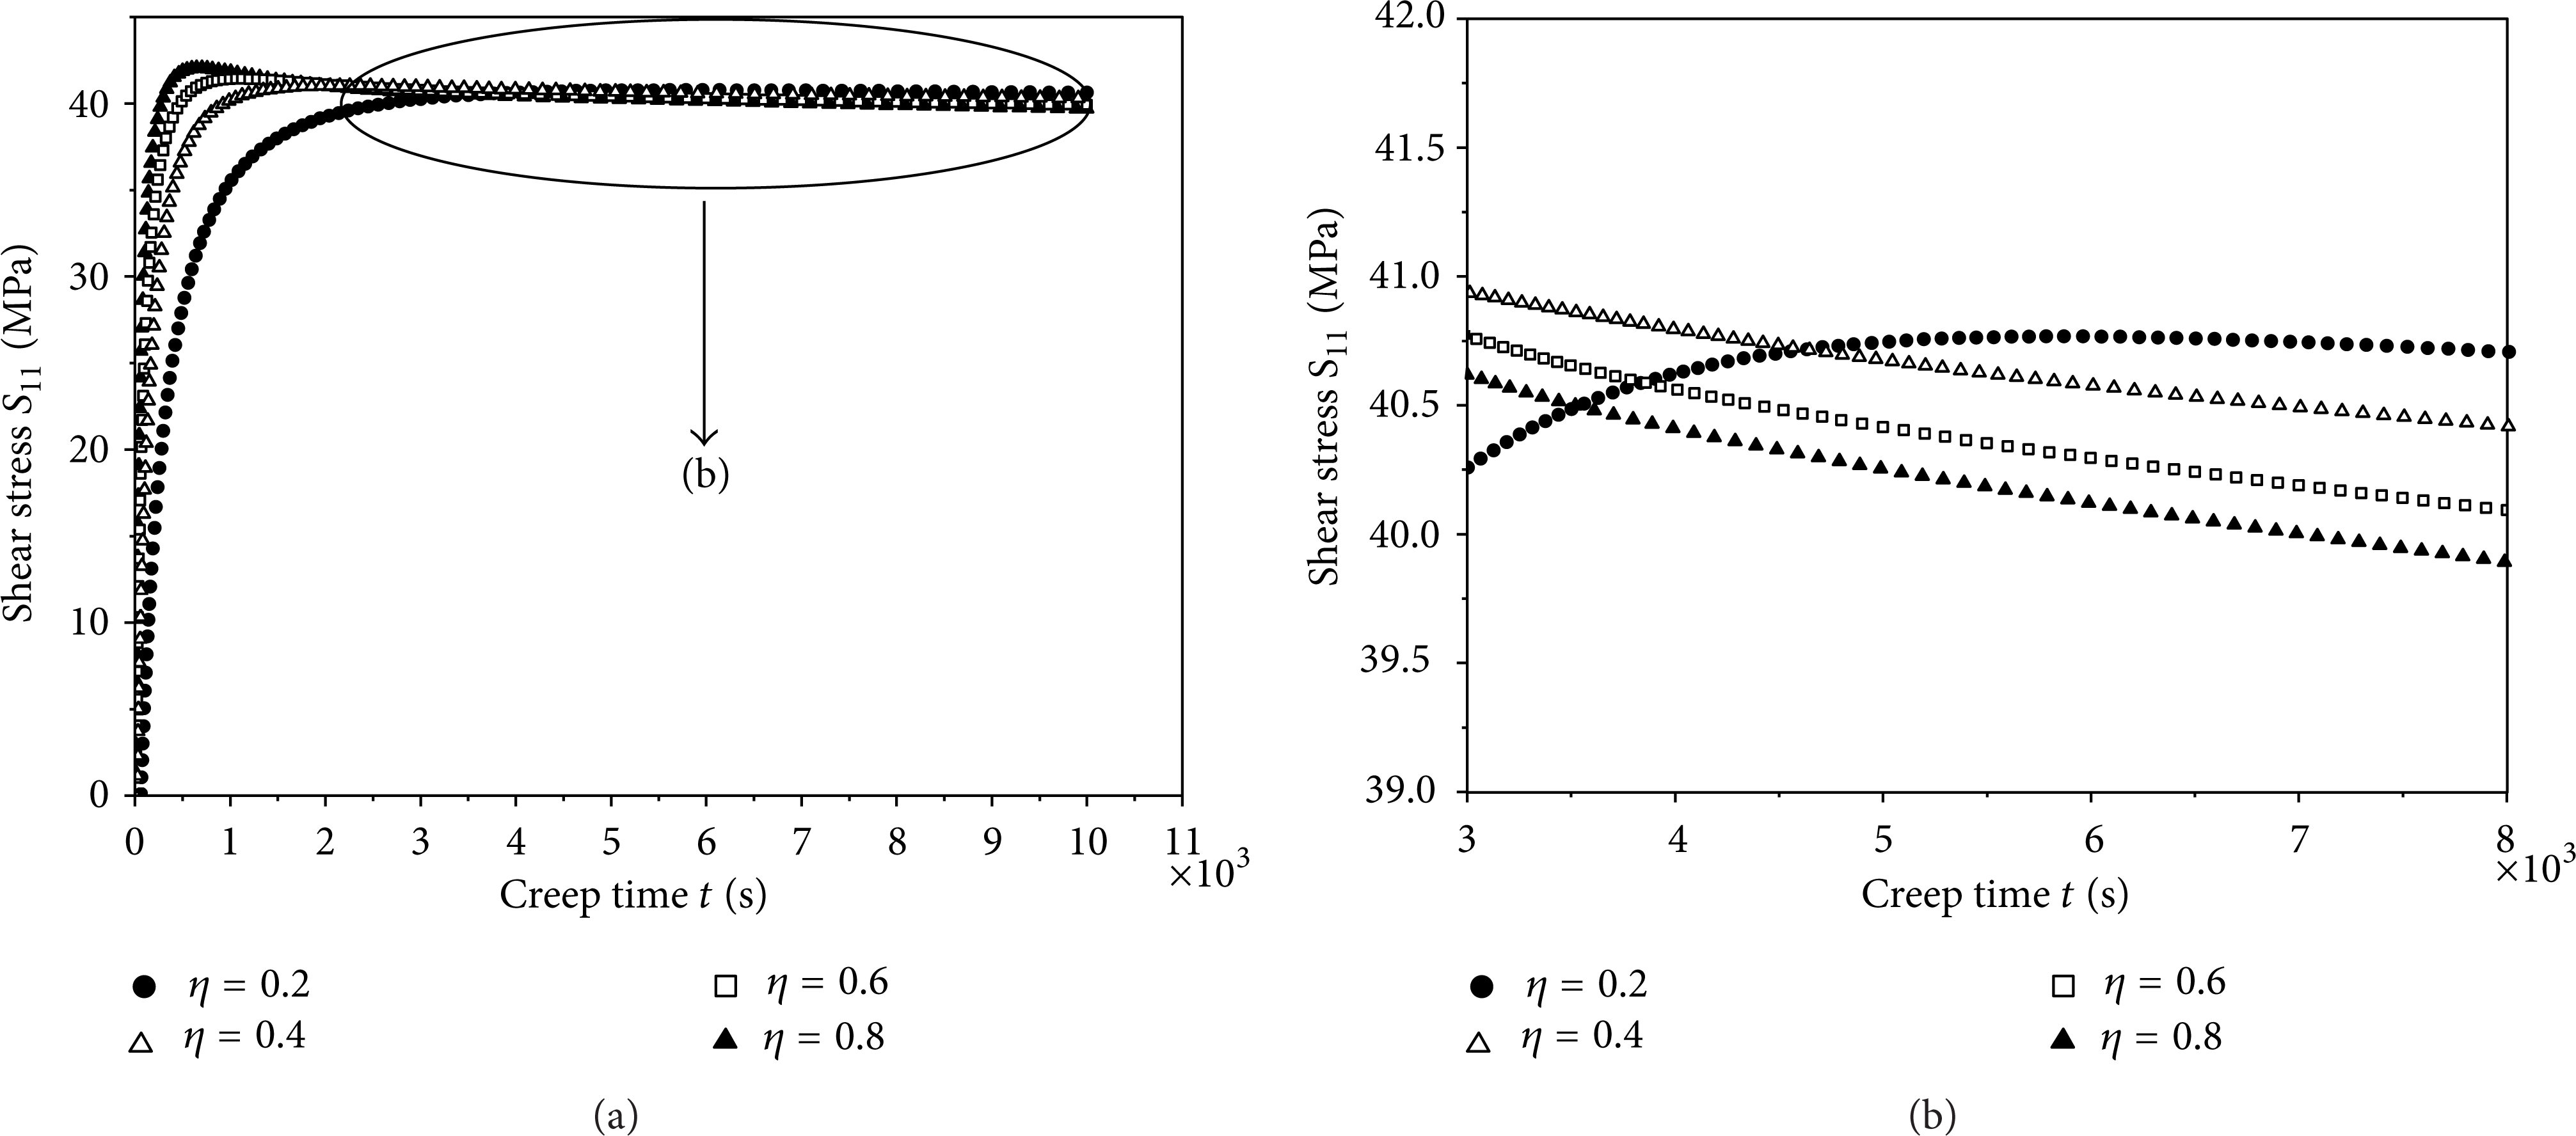
The relationship of shear stress of the interface and creep time for the different η: (a) the shear stress (S11) and (b) the details of (a).
Figure 6 shows the influence of η on the shear stress (S11) at the interface which is under the indenter. (We focused on the position which is around the second peak and defined the largest shear stress position that x = 0.) It is shown that the shear stress on the interface increases first and then decreases along the radial direction, and the maximum shear stress occurs at the distance of x = 0. At the same time, the S11 becomes symmetrical reducing when position is close to the direction of the valley. It even tends to compressive stress. Consequently, cracks may form in the peak region very close to the interface. However, we also understand that if a crack initiates, it will not be able to propagate transversally in the region over the valley because of the compressive stress.
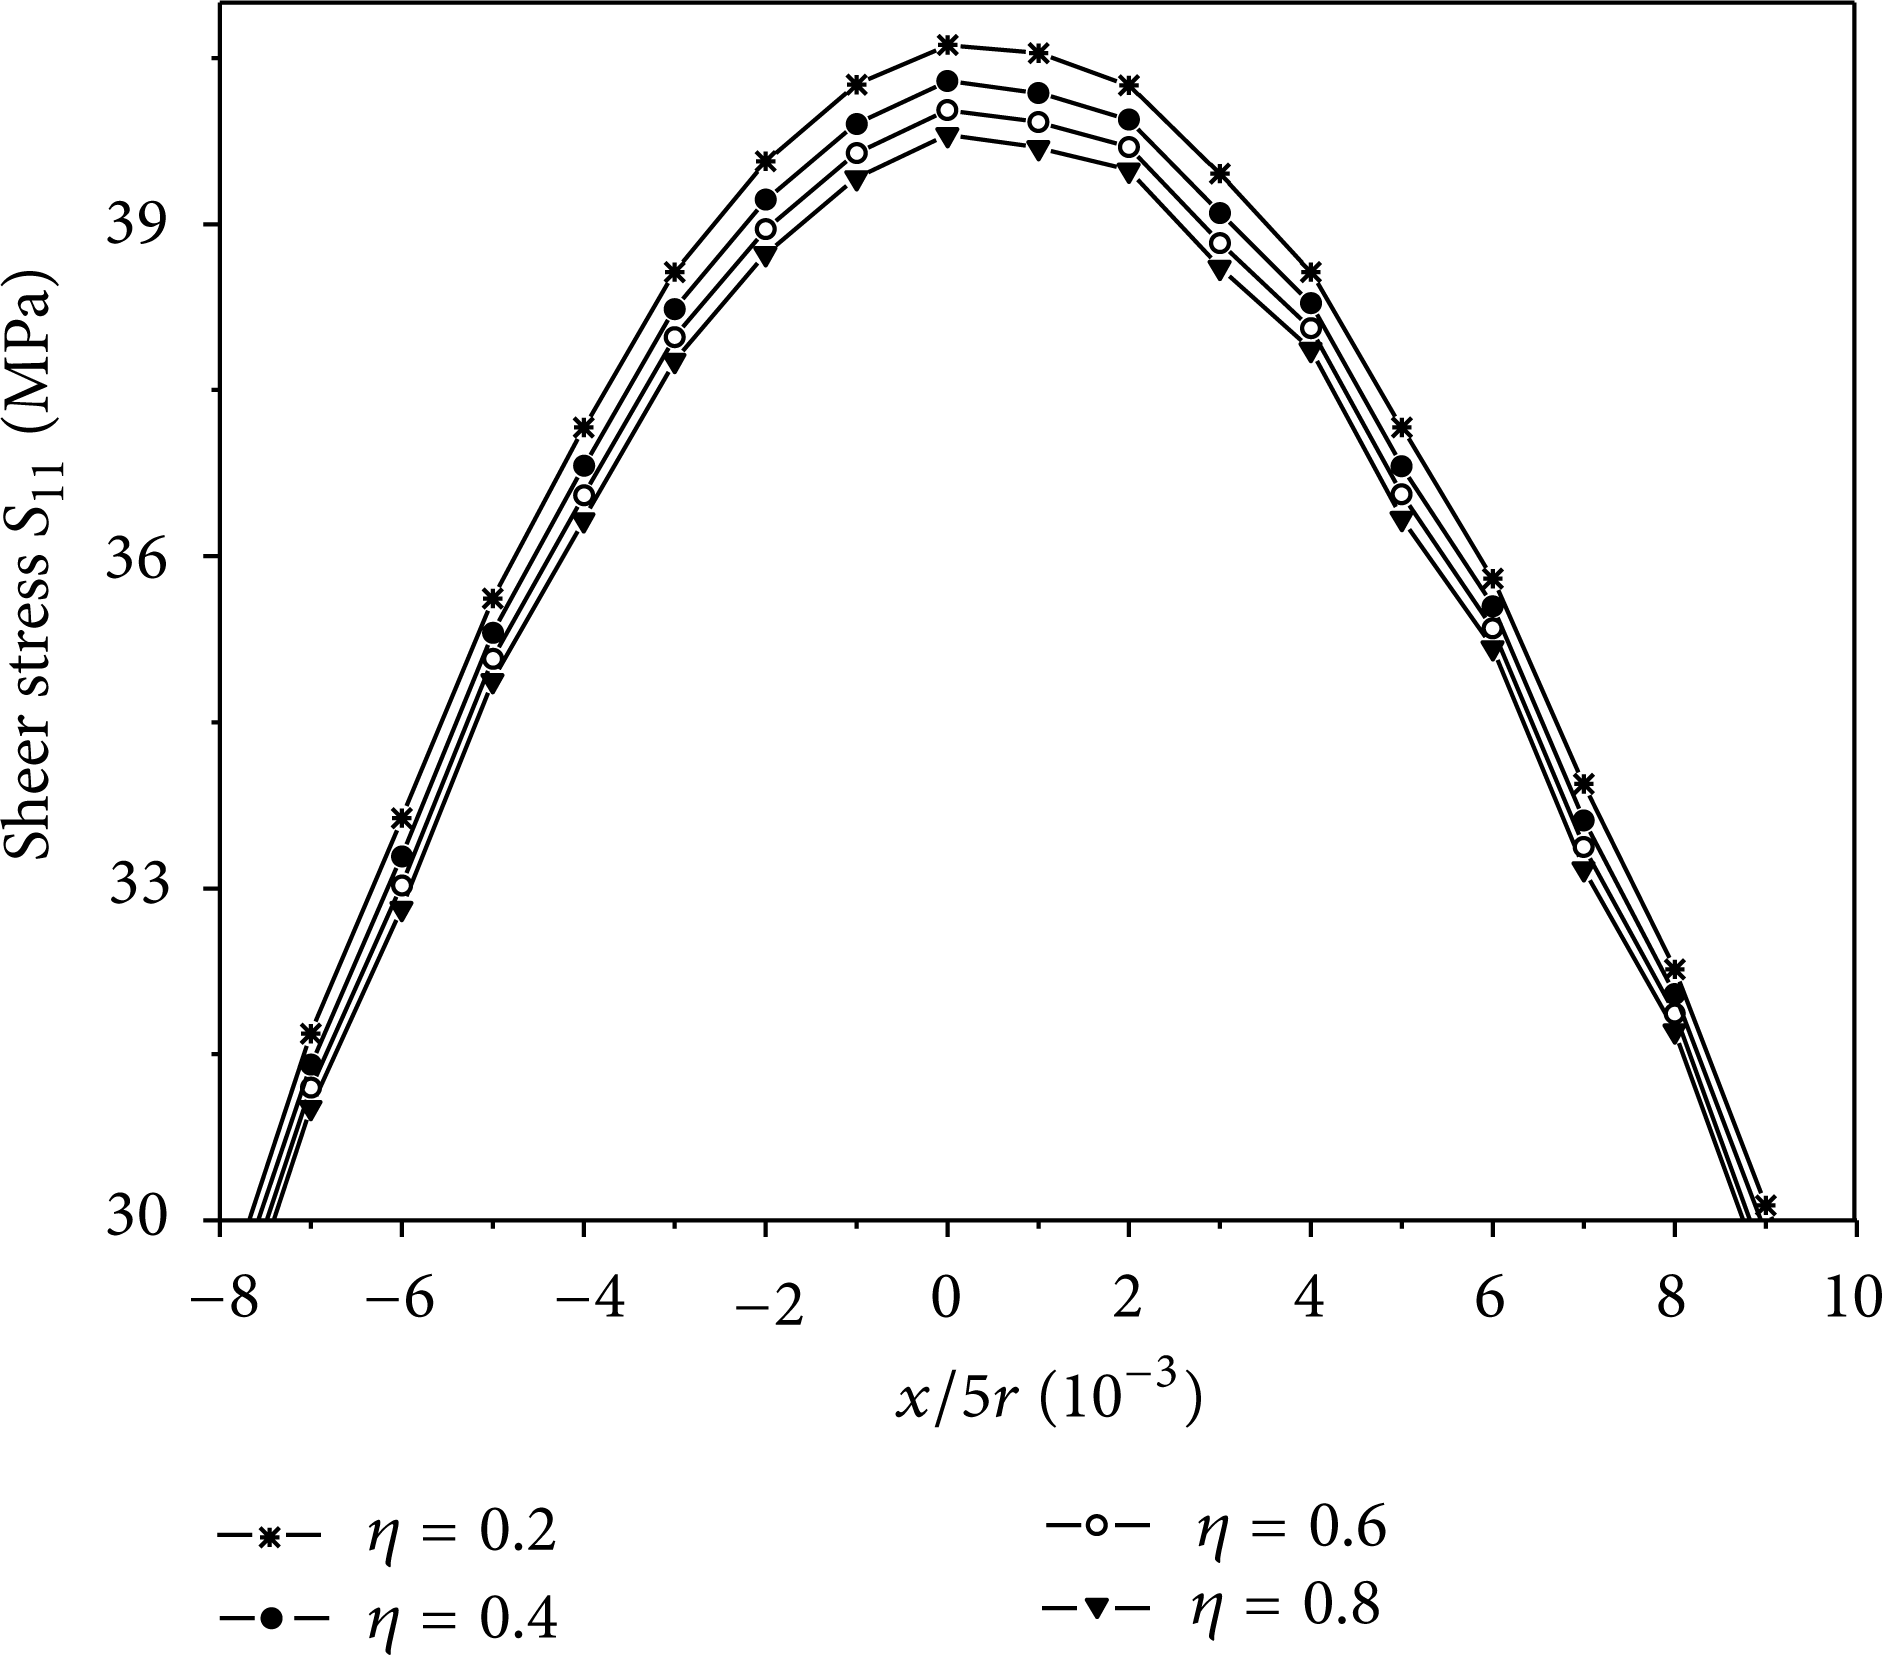
Influence of η on the shear stress of the interface along the 11 directions.
4.1.3. Von Mises Stress
It shows the change in Von Mises stress with the creep time in Figure 7. There is also a plastic wave propagating in the materials at the very beginning, which is similar to Figure 3. However, for Von Mises stress, it needs a longer time to reach a steady state. And the smaller η is the longer creep time need.

The influence of η on the Von Mises and creep time (t).
Figure 8 shows the variation of Von Mises stress along the lateral direction for different η, respectively, when the deflection rate reaches a steady state. It is shown that the maximum Von Mises stress at the interface increases when the η decreases. The maximum Von Mises stress at the interface occurs at x = 0 for this case. Further, it is shown that a high-stress region will occur at the second peak below the indenter.

Variation of Von Mises stress along the 11 directions for different η.
4.2. Influence of the Roughness at the Interface
4.2.1. Indentation Depth-Creep Time Behavior
From Figure 9, it shows the influence of R a on the deflection-creep time. It is clearly that the deflection increases with the creep time increasing. And the deflection decreases with R a increasing for the same creep time, but the influence is not very obviously.

The influence of R a on the deflection (d) creep time (t).
4.2.2. Shear Stress at the Interface
The influence of R a on the maximal shear stress of the S11 at the interface is shown in Figure 10. From the figure, we can obtain that a greater R a leads to a larger shear stress and soon reaches a steady state.

The relationship of shear stress of the interface and creep time (t) for different roughness R a .
Figure 11 further shows the influence of R a on the shear stress (S11) at the interface which is under the indenter. It is shown that the shear stress on the interface increases first and then decrease along the radial direction, and the maximum shear stress occurs at the distance of x = 0. At the same time, the S11 becomes symmetrical reducing when position is close to the direction of the valley. It even became compressive stress.

Influence of R a on the shear stress of the interface along the 11 directions.
4.2.3. Von Mises Stress
Figure 12 shows the change of Von Mises stress with the creep time which takes the different interface roughness into account. There is also a plastic wave propagating in the materials at the beginning, which is similar to Figure 9. And the greater R a is, the longer creep time need, and the greater Von Mises stress is.

The change of Von Mises with the creep time (a) and (b) the details of (a).
4.2.4. Residual Stress of the Interface
Residual stresses arising in the TBC are of the main interest, particularly those which explain crack initiation and propagation in the transverse direction, which is a precondition for delamination and failure, respectively. These are primarily stress in the radial perpendicular direction to the TBC, in our case, the y-direction. Figure 13 shows the calculated Mises-fields in the TBC in the region very close to the rough TBC-BC interface for different roughness and without TGO growth. Due to the rough TBC-BC interface, tensile and compressive stress can be obtained in the peak and the valley region, respectively. The qualitative distribution of the stress remains the same, and the values increase with the roughness increasing. Consequently, cracks may only form in the peak region very close to the interface and depending on the strength of the TBC. However, if a crack initiates, it will not be able to propagate transversally in the region over the valley because the compressive stress exists there.

Distribution of the residual stresses in the TBC for the different roughness of the interface.
To investigate the influence of roughness on the residual stress, the simulation for A = 0.01 mm was repeated with amplitudes of A = 0.02 and 0.04 mm. Figure 13 also shows that, with the higher amplitude, the maximum tensile stress becomes more concentrated in the peak region. Higher roughness amplitudes do not only yield qualitatively higher stress, but also a complicated distribution with the maximum of the tensile stresses.
In addition to the tensile stresses in the peak region, a strip of high tensile stress can be noticed, which covers the valley region with very high compressive stress. In this case, cracks may initiate and propagate and then delaminate in the valley region. However, these cracks will not be able to propagate to the valley region because of the compressive stresses along the way (Figure 13). The residual stress calculations result in the following conclusions.
The TBC-BC interface roughness induces high residual stresses in the TBC areas close to the TBC-BC interface. Tensile residual stresses leading to the crack initiation and propagation are localized and limited propagation of initiated cracks is expected so that delamination still cannot be explained. The locations favored in the TBC for crack initiation are the peak region, in the case of a low roughness amplitude.
4.3. Influence of the Thickness of the TGO Layer (hTGO)
4.3.1. Indentation Depth-Creep Time Behavior
The influence of the thickness of the TGO layer on the indentation depth propagation is shown in Figure 14. The case presented here is hTGO = 1, 2, and 4 μm. It is shown that the influence of the thickness of the TGO layer is not obvious. However, the larger thickness will obtain the smaller indentation depth.

Influence of hTGO on the indentation depth d as a function of the creep time t.
4.3.2. Shear Stress at the Interface
Figure 15 shows influences of the TGO layer's thickness on the shear stress
Influence of hTGO on the shear stress of the interface along the 11 directions.
4.3.3. Von Mises Stress
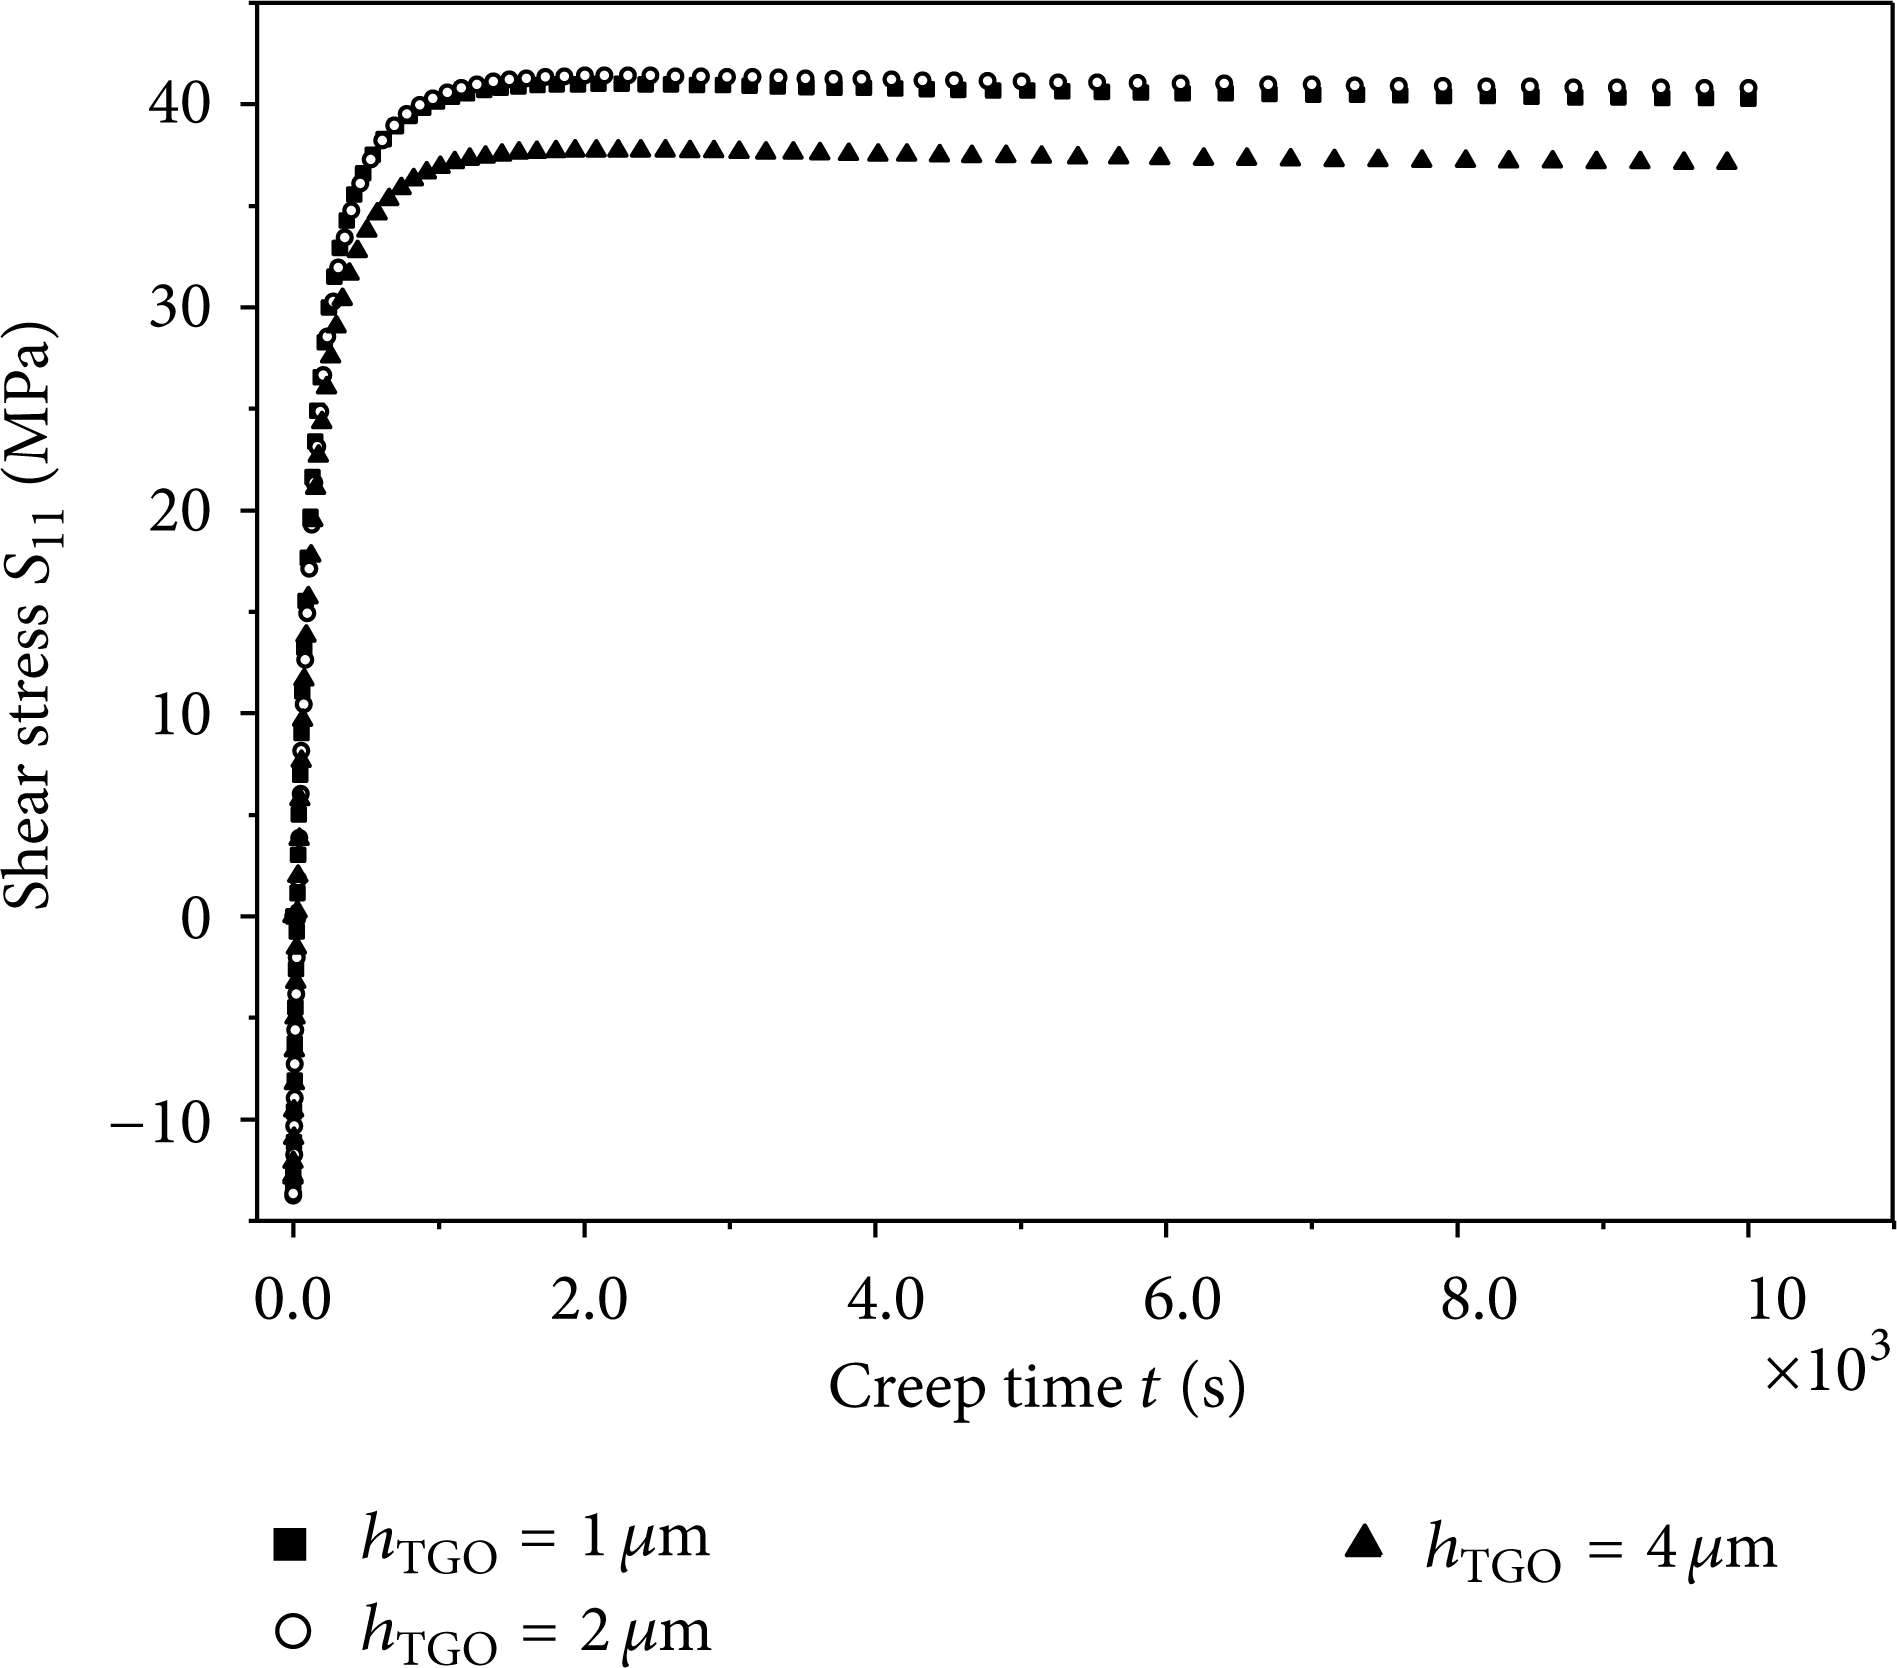
Figure 16 shows the change in Von Mises stress with the creep time for different thicknesses of the TGO layer. It is shown that the Von Mises stress reaches a steady state gradually with the creep time elapsed. It provides a possibility of determining the creep properties of thin film with the flat cylindrical indenter, and the detail method has been explored in Ref [16]. And the development is similar to the distribution of the shear stress.

The change in Von Mises stress with the creep time for different hTGO.
5. Conclusion
The creep stress characterizations beneath the indenter and at the interface of the flat cylindrical indenter test have been studied. The main conclusions can be drawn as follows.
For a given thickness of the TBC layer, the maximum Von Mises stress at the interface increases with the modulus ratio of the thin film to the substrate deceasing, and the maximum shear stress decreases with the modulus ratio of the thin film to the substrate increasing.
For a given thickness of the TGO layer, the steady-state indentation rate increases with the modulus ratio of the thin film to the substrate decreasing. For a given modulus ratio of the thin film to the substrate and the different roughness of the interface, the influence is not obvious.
We obtain the residual stress distribution which is based on the change of the roughness of the interface. First, the TBC-BC interface roughness induces high residual stress in the TBC areas close to the TBC-BC interface. Second, tensile residual stress required for crack initiation and propagation is localized and limited propagation of initiated cracks is expected. Last, the location favored in the TBC for crack initiation is the peak region, in the case of the low roughness amplitude, and more complex, in the case of the high roughness amplitude.
Conflict of Interests
The authors declare that there is no conflict of interests regarding the publication of this paper.
Footnotes
Acknowledgment
The authors would like to acknowledge the support of fundamental Research Foundation (JC201138, JC201237) at Northwestern Polytechnical University, Aeronautical Science Foundation of China (2012ZD53053), Aerospace Technology Support Fund of China (2013-HT-XGD), and Specialized Research Fund for the Doctoral Program of Higher Education of China (20126102120034).