
Abstract
This paper aims at developing a pedestrian level of service (LOS) model for the overall unsignalized midblock crossings of road segments from the perspective of the pedestrian's perception of safety and convenience in Chinese midblock crossing environment. Firstly, the potential primary factors influencing pedestrian LOS at unsignalized midblock crosswalks were summarized from four respects: traffic conflicts, the distance between crosswalks, crossing facilities, and delay. Secondly, 948 participants’ real-time sense of safety and convenience when they were crossing the 30 selected unsignalized midblock crosswalks and the design and operational characteristics of the selected road segments were collected. The selected midblock crosswalks were typical of those prevalent in the medium-sized urban areas of China, and the participants of questionnaire survey covered a broad cross section of Chinese population of pedestrians. Finally, Pearson correlation analysis and stepwise regression analysis were carried out to develop pedestrian LOS model for the overall unsignalized midblock crossings of road segments. The results revealed that the factors significantly influencing pedestrian LOS of the overall unsignalized midblock crossings of road segments included volume of two-way motor vehicle, the distance between marked midblock crosswalks, and the distance between unmarked crosswalks. A reliable, statistically calibrated pedestrian LOS model was developed (R2 = 0.80).
1. Introduction
Walking is one of the most important travel modes in China urban and suburban areas. More and more designers and researchers show solicitude for pedestrian facility, but the current design stand for pedestrian facility enacted ten years ago is out of time because of the tremendous changes in the traffic environment. Midblock crosswalks are locations different traffic flow assemble; however, the problems of them are not so obvious as that of intersections, so midblock crosswalks are always neglected by planners and designers. The unreasonable design and construction of midblock crosswalks brought about a great deal of conflict and accidents. So road designers and managers have to investigate the measures that can make pedestrian feel safe and convenient when crossing the street. Modeling of LOS at midblock crosswalks for pedestrians can provide an insight on how to accommodate pedestrian travel.
Most of the previous research on pedestrian LOS focused on sidewalks and intersections. HCM [1] and Fruin [2] describe LOS criteria for pedestrians at sidewalks, intersections and shared used paths based on pedestrian traffic conditions. Many researchers attempted to give consideration to the influence of environmental factors on pedestrian LOS. Lautso and Murole [3], Sarkar [4], Khisty [5], Miller et al. [6], Dixon [7], and others put forward numerous qualitative and quantitative measures that almost included all of the possible factors and proposed corresponding models. However these methods are too complicated to practice. Research in recent years discussed pedestrian LOS based on pedestrian perception of safety and comfort, which is represented by the study of the FDOT pedestrian LOS model. The research by Landis et al. [8], Steiner et al. [9], Petritsch et al. [10], Landis et al. [11], and Petritsch et al. [12] systematically provided regressive pedestrian LOS models for segments, intersections, and arterials with sidewalks. The results of these researches offer powerful tools for analyst and designers. A research group in Japan also carried out a succession of valuable research on pedestrian LOS. Muraleetharan et al. [13] and Muraleetharan et al. [14] proposed “overall LOS” as an index for the pedestrian LOS on sidewalks and crosswalks, which combined the influencing factors and indicated an overall value based on the concept of total utility value. Furthermore, an assessment method of pedestrian LOS at crosswalk was developed by Muraleetharan et al. [15] using survey data in Japan. A research from Bian et al. [16] and Bian et al. [17] investigated pedestrian LOS on sidewalks from pedestrians’ perceptions of the comfort and safety as walking on sidewalk and signalized intersections based on Chinese traffic environment. The special research on pedestrian LOS for midblock crosswalks was from Baltes and Chu [18], which revealed pedestrians’ perceived quality of service for a single midblock crosswalk.
These studies provide roadway designers a solid guidance on how to design a friendly pedestrian environment. As a necessary and new complementarity, this research tried to investigate pedestrian LOS for overall unsignalized midblock crossing of road segments.
2. Method
Midblock crosswalks include three types: signalized, marked (unsignalized), and unmarked. The walking environment of signalized midblock crosswalks is almost the same as that of signalized intersections, which already had great deal of researches, so this research attempted to model the quality of pedestrians’ crossing road segments only with marked and unmarked midblock crosswalks between two intersections through pedestrians’ perceptions of safety and convenience. The length of road segments in medium-sized urban areas is not too long, and the types of midblock crosswalks on the same road segment are generally the same, so a hypothesis was made: all of the midblock crosswalks on the same road segment are of the same type. Pedestrians might view the road segment as a whole when crossing; that is to say, the factors that might influence the pedestrians’ perceptions of safety and convenience are the conditions of all of the midblock crosswalks on the road segments, so another hypothesis was made: what influences pedestrians’ sense of safety and convenience was the overall crossing condition of the road segment. Based on the two hypotheses, the primary factors that possibly influenced pedestrians’ sense of safety and convenience when crossing were analyzed firstly, and then survey on the characteristics of the primary factors and pedestrians’ real-time responses to the overall unsignalized midblock crossing environment of road segments was carried out simultaneously, based on which the significant influencing factors were identified, and a pedestrian LOS model was developed ultimately.
2.1. Factors Influencing Pedestrian LOS at Unsignalized Midblock Crosswalks
In reference to Chinese actual traffic conditions, factors influencing pedestrian LOS at unsignalized midblock crosswalks can be summarized as the following.
2.1.1. Traffic Conflicts
It is well known that China is a kingdom of bicycle; that is to say bicycle traffic volume is high in majority of Chinese cities, so the traffic conflicting with pedestrians at midblock includes not only motor vehicles but also bicycles of the street being crossed. Furthermore, the same traffic conditions of the two different ways of the street might result in different pedestrians’ sense of safety because of the different distances between the traffic and pedestrian. In addition, not only the through traffic might disturb pedestrians’ crossing, but also the turning traffic might have effect because not all of the turning traffic yielded to pedestrians at unsignalized crosswalks in China. Thus potential traffic conflict factors included the near side through motorists and bicycles of the street being crossed, the near side turning motorists and bicycles at the unsignalized midblock crosswalks, the far side through motorists and bicycles of the street being crossed, and the far side turning motorists and bicycles at the unsignalized midblock crosswalks.
2.1.2. The Distance between Crosswalks
The convenience of pedestrians’ crossing street from midblock crosswalks can influence pedestrian sense of convenience to a large extent. As shown in Figure 1, the distance between crosswalks is the distance between all of crosswalks on the road, including the crosswalks at intersections and midblock crosswalks. The convenience of pedestrians’ crossing street from midblock crosswalks is determined mainly by the distance between crosswalks and the location of the crosswalks; the larger distance between crosswalks or the more unreasonable location of the midblock crosswalks may contribute to larger distances, so that pedestrians must divert when he/she wants to reach a site across the street, which leads to the increase of resistance of pedestrians’ crossing and the decrease of pedestrian level of service. The rationality of the location of midblock crosswalks is difficult to measure, and the distance between crosswalks can reflect the convenience of pedestrians’ crossing to some extent, so the distance between crosswalks was selected as potential factors influencing pedestrian LOS.

Elements of pedestrians’ crossing system of road segment.
2.1.3. Crossing Facilities
Crossing facilities can protect or hurt pedestrians and bring convenience or obstruction to pedestrians, so the conditions of crossing facilities were believed to influence pedestrians’ sense of safety and comfort. Crossing facilities factors include the waiting space, crossing distance, type of crossing markings, median type, and separate path for bicycles.
2.1.4. Delay
The total time spent by pedestrians waiting to cross the street is expressed as delay. Because some driver did not yield to pedestrians, pedestrians had to wait for the gap of the traffic to cross the street, which results in pedestrians’ delay. The delay of pedestrians at unsignalized midblock crosswalks is determined by the gap distribution of the traffic which is difficult to obtain during design stage of the street, so factors influencing the gap distribution were studied. The gap distribution was determined by traffic volume and control pattern of the upstream and downstream intersections, and the control program is generally formulated according to traffic characteristics, so the pedestrians’ delay at unsignalized midblock crosswalks can be represented by traffic characteristics of the street being crossed.
2.2. Site Selection
Most of the midblock crosswalks on the main roads in Chinese metropolitan areas are controlled by signal because of the large volume of the traffic; on the contrary, the unsignalized midblock crosswalks are prevalent in medium-sized cities, so the survey of pedestrian LOS for the overall unsignalized midblock crossings of road segments was carried out in Bengbu, a medium-sized city that lies in Anhui province in China. As shown in Figure 2, 30 road segments were selected as survey sites. Most selected road segments were arterial roads and secondary arterial roads, and some inferior roads were also included. During the survey period, the volume of motor vehicle traffic, nonmotorized vehicle traffic, and pedestrian ranged from 152 p/h/lane to 1132 p/h/lane, from 114 bic/h to 2265 bic/h, and from 6 p/m/h to 1759 p/m/h, respectively.

Selected sites for survey.
The roadway cross sections included two to six lanes in undivided or divided forms. The separation form between motor vehicle lanes and nonmotorized vehicle lane included nonseparation, markings, barriers, and landscaped strips. The width of nonmotorized vehicle lane and sidewalks ranged from 1.0 m to 6.0 m and from 1.3 m to 10 m, respectively. Some main road segments and inferior road segments had motor vehicle on-street parking. Most of the segments had nonmotorized vehicle parking in buffer area.
The study area covered almost full range of the build-up area of Bengbu, so the land use of it included the typical land use patterns of Chinese medium-sized city, which is comprised of shops, office, apartment, parks, restaurants, banks, and so forth.
2.3. Survey Time
Data was collected from Monday to Saturday in Bengbu, Anhui, from 7:00 to 9:30 which covered the peak hour and off-peak hour. The weather was sunny and warm.
2.4. Questionnaire Design and Survey
This study surveyed pedestrians crossing the unsignalized midblock crosswalks to get the participants’ real-time responses on the pedestrian LOS of the overall unsignalized midblock crossings of road segments. Investigators stood on one side of the crosswalks to search for voluntary participants. The searching principle was that the participants should have different genders and diverse ages which were achieved by investigators’ observation. Once the participants crossed the street, investigators started to talk with him/her. Investigators firstly explained the meaning of LOS to the respondents and then asked how they felt as they crossed the street. Furthermore, pedestrians’ travel characteristics were also collected, including travel time, travel purpose, and walk frequency. Unsignalized midblock crosswalk user survey form shows a sample questionnaire sheet used for the survey and the description of LOS given to the pedestrians. It is worth noting that pedestrians’ perceptions were inquired from two respects separately: the convenience degree and the safety degree. The reason was that the change trends of convenience degree and safety degree when crossing due to the same change of the unsignalized midblock crosswalks were not accordant; for example, the decrease of the distance between crosswalks may lead to the improvement of pedestrians’ perceptions of convenience and the deterioration of pedestrians’ perceptions of safety, so pedestrians’ feeling of convenience and safety on unsignalized midblock crosswalks should be analyzed separately.
Unsignalized Midblock Crosswalk User Questionnaire. Survey site ID: …, Response time: …, Gender: …, Age: ….
(1) How convenient do you feel when you were crossing this road segment?
Excellent
Good
Average
Inferior
Poor
Terrible
Please explain to the respondents: the meaning of this question is to ask the respondent's sense of convenience affected by the geometric attributes, traffic conditions, and midblock crosswalks conditions, but do not take into account the conditions of intersections.
(2) How safe do you feel when you were crossing this road segment?
Excellent
Good
Average
Inferior
Poor
Terrible
Please explain to the respondents: the meaning of this question is to ask the respondent's sense of safety affected by the geometric attributes, traffic conditions, and midblock crosswalks conditions, but do not take into account the conditions of intersections.
(3) Is walking one of your main travel modes?
Yes
No
(4) How often do you usually use this crosswalk?
First time
A few times a month
A few times a week
Every day
More than once a day
(5) What is your purpose on this trip?
Commuting
Shopping/run errands
Health/exercise
Entertainment
Picking up children
Other…
Thank you very much
2.5. Field Survey
According to the potential factors influencing pedestrians LOS at unsignalized midblock crosswalks, the content of field survey was divided into two types, which were the static state data and dynamic state data. As shown in Table 1, the static state data included the geometric characteristics of the street being crossed, the distance between crosswalks, and the condition of the unsignalized midblock crosswalks. The dynamic state data included the control characteristics of the upstream and downstream intersections and the traffic characteristics of the streets being crossed. Part results from the field measurements were shown in Table 2.
Pedestrian at unsignalized midblock crosswalks worksheet.

Main results from field measurements.

VMN: motor vehicle traffic volume of near side of the street being crossed.
VMF: motor vehicle traffic volume of far side of the street being crossed.
VNN: nonmotorized vehicle traffic volume of near side of the street being crossed.
VNF: nonmotorized vehicle traffic volume of far side of the street being crossed.
D: distance between crosswalks.
WM: width of motor vehicle lanes.
WN: width of nonmotorized vehicle lanes.
WS: effective width of sidewalk.
3. Results
3.1. Attributes of Respondents
A total of 948 respondents participated in the questionnaire survey, among which 918 responses were effective, 413 from males and 505 from females. Totally, about 8% were under age 20, 10% were of age 20 to age 29, 18% were of age 30 to age 39, 21% were of age 40 to age 49, 16% were of age 50 to age 59, and 27% were of age 60 or older. Table 3 shows their gender and age distribution of part of survey sites, from which it can be seen that the participants covered a wide range of age. Results of partial survey sites were shown in Table 3.
Gender and age distribution of surveyed respondents.

3.2. Participants Response
To analyze the data, qualitative answers were transformed into numbers as the following:
1 = “excellent,”
2 = “good,”
3 = “average,”
4 = “inferior,”
5 = “poor,”
6 = “terrible.”
The average users’ score of partial survey sites was computed in Table 4. Grade distribution of crosswalks was shown in Figure 3.
Average user scores.


Grade distribution for safety and convenience of unsignalized midblock crosswalks.
The survey method may introduce a bias since busy people may be less willing to participate, and they may consider roads safer than less-busy people. This bias may be corrected by using other survey method, such as follow-up mail or on-line survey. In absence of data from other survey method, the intercept survey data which represents a worse level of service can be used to develop the model.
4. Model Development
To prove the difference between pedestrians’ perceptions on safety and convenience, Pearson correlation was carried out to analyze the correlation between the score of safety and the score of convenience, result of which was that the significance level was 0.312, implying the poor correlation between pedestrians’ perceptions on safety and convenience, so they should be analyzed separately or combined with different weight according to the importance of safety and convenience of the study subject. In order to determine the weight of safety and convenience, models with various combinations of different weights were established. Through the comparison of the accuracy of different models, it could be seen that the highest accuracy was achieved when the weights of safety and convenience was both 0.5. On the other hand, the analysis results above were also consistent with pedestrians’ feelings. Thus, the average of the score of safety and convenience was selected in the following analysis.
The modeling process includes the following steps: (a) identify relevant variables; (b) test for the best configuration of each variable (or combination/transformations thereof); and (c) establish the coefficients for the resulting variables in the best-fit regression model [13].
The relevant variables were selected through Pearson correlation analysis. The calculating result was shown in Table 5. The variables with low significance (P>0.05) would be dropped.
Results of Pearson correlation analysis.
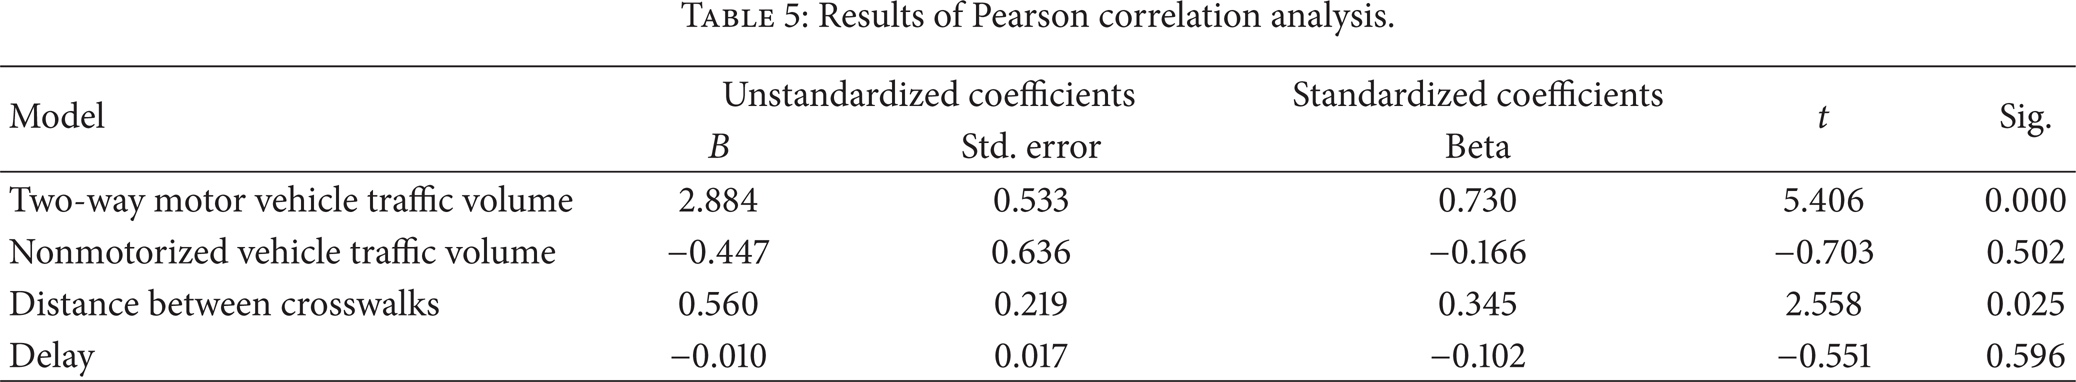
It was worthy to discuss that, in the circumstance of unsignalized midblock crossings of road segments, pedestrians’ delay was affected by vehicle volume. It could be also known based on the results of correlation analysis that there was a significant collinearity between pedestrians’ delay and the motor vehicle volume. On the other hand, the correlation between the level of service score and motor vehicle traffic volume was significant while the correlation between the level of service score and pedestrians’ delay was nonsignificant. Thus, the motor vehicle volume could reflect the delay impact to pedestrians.
Based on the Pearson correlation and factor analysis, the following relevant variables were determined: two-way motor vehicle traffic volume, the distance between marked midblock crosswalks, and the distance between unmarked crosswalks. Other variables were dropped from further consideration because of their poor correlation with dependent variable, level of service score for the pedestrian crossing the road segments, or because of their collinearity with more strongly correlated variables.
The test of the best configuration of each variable produced the following model format:
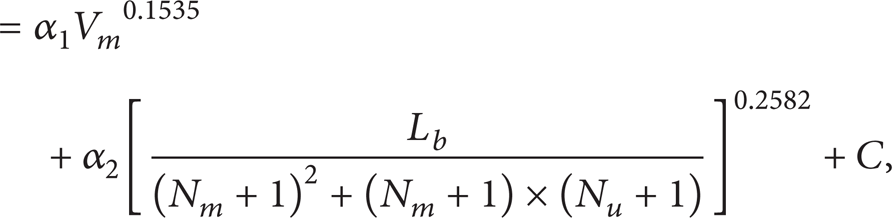
where V m = two-way motor vehicle traffic of the street being crossed (pcu/h), L = c (m), N m = number of marked crosswalks on the road segment between intersections, N u = number of unmarked crosswalks on the road segment between intersections, and C = constant.
The study conducted stepwise regression analysis. Table 6 shows the terms, coefficients, and T-statistics for the model. The correlation coefficient (R2) of the best-fit model is 0.80 based on the average observations from the 30 sidewalks. The coefficient is statistically at the 95 percent level.
Model coefficients and statistics.

It is worth noting that there are limiting ranges of the variables for the model to be valid. The range of two-way motor vehicle traffic of the street being crossed should be limited below 1400 pcu/h which was the upper limit of the motor vehicle volume in the unsignalized intersection in China (GB14886-2006). If the motor vehicle traffic volume was beyond the limitation, there should be a signal in the crossing. The length of road segment between two crossings should be limited in the range of 250 m–300 m (CJJ37-2012). The number of marked or unmarked crosswalks on the road segment between intersections should be one or two. In addition, the results of this research were appropriate for middle-sized and small cities. If the research object was beyond the limitations above, the model would be refined for the certain conditions.
The following shows pedestrian LOS classifications, where X is the model's numerical result. According to the perception responses, the medium LOS was 3.5, which corresponded to the boundary between LOS C and D; at the same time considering its symmetry, the scale was determined to be
LOS A: X ≤ 1.5,
LOS B: 1.5<X ≤ 2.5,
LOS C: 2.5<X ≤ 3.5,
LOS D: 3.5<X ≤ 4.5,
LOS E: 4.5<X ≤ 5.5,
LOS F: X>5.5.
5. Discussions and Conclusions
The study revealed that pedestrians’ feeling of safety and convenience did not change synchronously with the variety of road environment. Based on the average of safety and convenience score, motor vehicle traffic volume was found to have negative effect on pedestrian LOS, and the distance between marked midblock crosswalks and the distance between unmarked midblock crosswalks have differently positive effect on pedestrian LOS. The designers should set reasonable distance between crosswalks to let pedestrians cross the street easily, and at the same time, the crosswalk type should be selected circumspectly to ensure pedestrians’ safety.
The selected unsignalized midblock crosswalks in this study were typical of those prevalent in the medium-sized urban area of China, and the participants of questionnaire survey covered a broad cross section of Chinese population of pedestrians. The primary result of this study is a reliable, statistically calibrated pedestrian LOS model for the overall unsignalized midblock crossings of road segments, suitable for application in the vast majority of Chinese medium-sized urban areas. The model provides a measure to evaluate how well a particular road segment accommodates pedestrian travel, so it can be used to support the improvement and construction of pedestrian facilities by iteratively changing the independent variables to find the best combination of factors to achieve the desired pedestrian LOS.
The author had carried out a series of researches on pedestrian LOS for sidewalks, signalized intersections, and unsignalized midblock crosswalks; the next research is to carry out pedestrian LOS for unsignalized intersections, and then based on these researches, the pedestrian LOS for arterial road has been planned, since the actual influencing factor during pedestrians’ route choice is the whole pedestrian LOS of the road. The other direction is pedestrian LOS for roads in residential area, concerning pedestrians’ perceptions on them may be quite different from that of arterial road because of the different function of the roads and the different pedestrian activity on them.
Conflict of Interests
The authors declare that there is no conflict of interests regarding the publication of this paper.
Footnotes
Acknowledgments
This research was sponsored by the National Natural Science Foundation of China (NFSC) (no. 51108012) and the Beijing Technology Planning Project (no. Z141100000714008). The authors wish to thank the committee members. They also would like to thank the investigators from Southeast University and the voluntary respondents.