
Abstract
The clearance flow between the nozzle and endwall in a variable geometry turbine (VGT) has been numerically investigated to understand the clearance effect on the VGT performance and internal flow. It was found that the flow rate through turbine increases but the turbine efficiency decreases with height of clearance. Detailed flow field analyses indicated that most of the efficiency loss resulting from the leakage flow occurs at the upstream of the rotor area, that is, in the nozzle endwall clearance and between the nozzle vanes. There are two main mechanisms associated with this efficiency loss. One is due to the formation of the local vortex flow structure between the clearance flow and the main flow. The other is due to the impact of the clearance flow on the main flow after the nozzle throat. This impact reduces the span of shockwave with increased shockwave magnitude by changing the trajectory of the main flow.
1. Introduction
One of the advantages of variable geometry turbines (VGT) is to increase their boost power at low engine speeds and to provide brake power to the engine at high engine speeds by closing the nozzle vanes. When the turbine operates to generate brake power at high engine speed with the nozzle vane in its closed position, the downstream rotor may have high-cycle fatigue concerns. At part-load conditions, turbine performance deteriorates with the nozzle vane closing. At small vane openings, the interactions of two parts of fluids, main flow from nozzle throat and leakage flow from nozzle clearance, play a key role in turbine performance and reliability.
Hu et al. [1] carried out a numerical investigation of the effect of nozzle clearance on turbine performance in a VGT turbine at different open conditions and indicated that the nozzle vane's endwall clearance leakage affects the turbine performance at small open conditions. Hideaki et al. [2] found similar results and indicated that the leakage flow passing the clearance, due to the pressure difference between the suction side and pressure side, goes to the pressure side from the suction side. This leakage flow is restricted to the pressure side, due to the pressure gradient towards the inner radius from the outer radius of the nozzle, and flows out while forming endwall leakage vortices along the nozzle surface. Roumeas and Cros [3] did an investigation about the inception and development of nozzle clearance leakage vortices and pointed out that there are three different causes which are responsible for turbine efficiency loss: the total losses induced by vortex, the changed incidence angle distribution, and a shifting in operating points.
Hu et al. [4] performed a CFD/FEA coupled analysis in a variable geometry turbine to analyze the static and vibration stress of the rotor blade. The results revealed that nozzle leakage flow increases flow unsteadiness inside the turbine wheel and excitation on the rotor. Another source to affect rotor blade fatigue life is believed to be shock wave, which stands on the suction surface of the nozzle vane, near the trailing edge. The formation of this shock wave is mainly due to a high-pressure drop in nozzles, which often occurs when the nozzle vanes are at the small opening and the engine operates at high speed. The results of Kawakubo [5] showed that, at the mean section of the impeller blade, the nozzle shock wave impinges on the suction surface and deflects on the pressure surface periodically. These two processes constitute high, unsteady blade loading at the impeller leading edge. Chen [6] also indicated that because the shock wave impinges on the downstream turbine rotor, an excitation force is created. This force and its high harmonics easily damage the turbine wheel. Besides that, the existence of shock waves is also associated with turbine performance due to two facts: one is the flow loss induced by the shock wave; the other is that, at the root of the shock wave, the boundary layer separates, resulting in thick nozzle wake [5].
Though it has been known that an existence of nozzle endwall clearance seriously decreases turbine efficiency, the relationship among the efficiency loss in the endwall clearances, between the nozzle vanes and downstream rotor, is not fully understood. Additionally, the interaction between the clearance leakage and main flow is closely associated with the shock wave, which has been mostly ignored. It is intended in this paper to understand the locations where the most flow loss caused by the nozzle endwall clearance occurs, as well as the influence of leakage flow on the main passage flow, so as to understand the underlying shock wave characteristics.
2. Numerical Model
The stator vane and rotor from an existing automotive turbocharger were modeled as the current research model, as shown in Figure 1. There are 9 nozzle vanes and 13 rotors in the turbine stage. The inlet radiuses of the nozzle and rotor are about 70 mm and 35 mm, respectively. Four different models, the stator vane with four different heights of endwall clearance, were, respectively, designed to investigate the effect of endwall clearance flow on turbine performance and internal flow. The letter “h” stands for the height of the nozzle flow path and “c” stands for the height of the nozzle's endwall clearance. The height of the endwall clearance remains identical in both ends of the nozzle vane in each model. Four different heights of clearance are listed in Table 1, with Case 1 through Case 4. Among these cases, all geometries remain the same except the height of the nozzle endwall clearance.
Illustration of nozzle's endwall clearance.

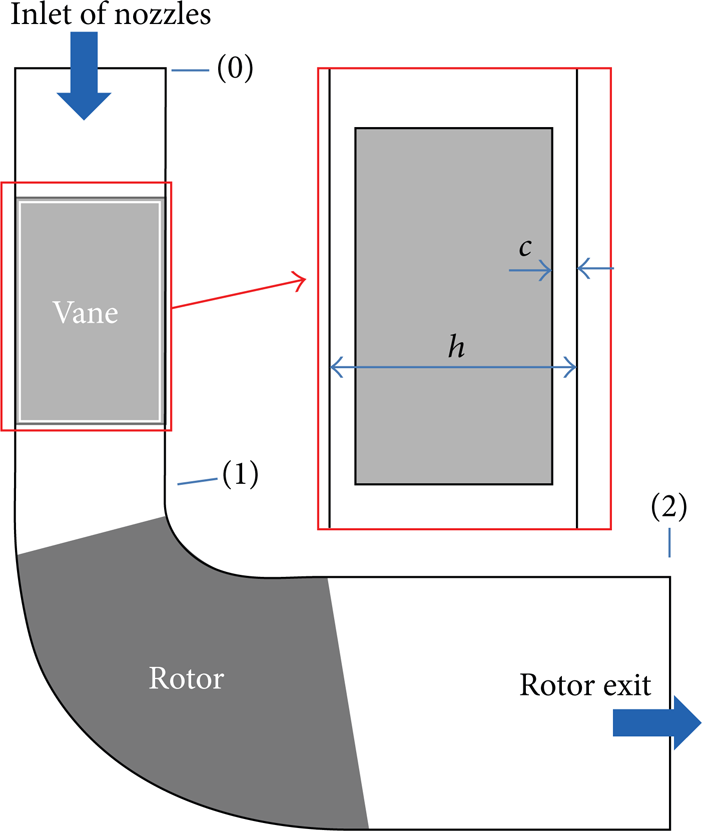
Turbine model.
3. Numerical Method
3.1. Flow Solver
The flow solver EURANUS, integrated in a commercial CFD software NUMECA, was used in this paper. The Reynolds-averaged Navier-Stokes equations were solved with a finite volume method. The governing equations are written in Cartesian coordinate as follows:


The perfect gas equation and Spalart-Allmaras turbulence model were used for closure of the above equations.
The central-difference scheme was employed for the spatial discretization, with the second and fourth order artificial dissipation coefficients being 1.0 and 0.1, respectively. The four-stage explicit Runge-Kutta scheme was applied for the temporal discretization. The multigrid method, combined with the local time step and implicit residual smoothing methods, was used to speed up the convergence.
3.2. Computational Grid
The nozzle flow passage and rotor passages were created automatically by an auto mesh generator. Around the blade surface, O-type block was used. H-type grids were used for the space between the nozzles. The mesh inside the hub/shroud clearance was created using a butterfly topology: an H block surrounded by an O block was used to discretize the area. The connection between clearance mesh and main flow passage mesh was matched. A nonmatching connection was created between the H and O block inside the clearance. There were 13 points in the clearance in the spanwise direction. More details about the generation of clearance mesh can be found in [7]. The total number of the grid points for single-passage without volute is more than 1.35 million. The minimum skew angles of grid cell were greater than 36°, the maximum expansion ratios were less than 2.5, and the maximum aspect ratios were less than 540. One of the 3D single-passage meshes is illustrated in Figure 2. The mesh dependency study, with steady numerical simulations, indicated that the computational mesh met the requirement. To reduce the requirements of unsteady simulation, a domain scaling method was used in this project. Considering that the ratio between the modified and the real number of blades should be as close as possible to 1.0, the number of rotor blades was changed from 13 to 12. The multipassage meshes were generated by duplicating manually single-passage mesh. All above efforts ensure the same periodicity on both sides of the rotor-stator interface in multipassage mesh. With the domain scaling model, only 1/3 of the whole revolution of turbine, 3 nozzle vanes and 4 rotor blades, was simulated by both steady and unsteady methods. The steady computational results revealed that the application of the domain scaling method may result in small discrepancies in turbine performance, which has little impact on the mechanism flow interactions. Similar mesh topologies are used for other cases. The Y+ value of less than 5 was achieved in most areas.

Topology of single-passage computational mesh.
3.3. Boundary Condition
The locations of inlet, rotor/stator interface, and outlet were illustrated in Figure 2. Due to the lack of spanwise flow field distortion out of the volute, an ideal uniform inlet condition was used. This simplification does not accurately reveal the flow loss in the region but nearly has no effect on the flow after the nozzle throat. The flow angle which was calculated according to volute, total pressure, and total temperature was imposed at the subsonic inlet boundary. At the outlet boundary, the static pressure was assigned with radial equilibrium and other variables were extrapolated from the interior.
For steady calculation, the conservative pitchwise coupling was used at the rotor/stator interface, which guaranteed an exact conservation of mass flow, momentum, and energy through the interface. This approach adopted the same coupling procedure for all the nodes along the circumferential direction, even if the local flow direction was different from the average one. For the unsteady calculations, at the rotor-stator interface, a direct interpolation on sliding meshes was used. In this project, the time of each physical step is about 6.94 × 10− 7 seconds. At each time step, the rotor is set at its corrected position and the above governing equations are solved for that particular time step throughout the entire computation domain. The final solution is therefore a succession of instantaneous solutions for each increment of the rotor position. The same settings were applied for all cases.
3.4. Comparison of Numerical and Experimental Results
Only limited performance test data of the VGT turbine are available to validate the numerical results. Figure 3 shows the comparison of numerically predicted turbine performances and test results at a specific speed and inlet condition. Due to test bench limitations, the test data is not as wide as the numerical simulations. From comparisons it can be seen that the predicted turbine performance with different flow rates agrees well with that of measurements, and the maximum difference is about 2.5 percent. This is mainly because the CFD results do not include bearing loss and the test data do. In addition, the predicted expansion ratios with different flow rates also have similar trends with experimental data, except that mass flow from CFD is about 3.5 percent higher than test data. One of the main reasons for those deviations in flow rate is the different flow domains: volute was not included in the current numerical model.

Comparison of the numerical and experimental turbine performance.
4. Results and Discussion
Both the turbine performance and the reliability of rotor are more sensitive to nozzle endwall clearance for small vane open positions. Therefore, all of the following analyses will be carried out at small vane open condition.
4.1. Turbine Performance
Figure 4 presents the performance of the turbine with 4 different heights of endwall clearance at a specific speed at small opening. From comparisons it can be seen that the best turbine performance occurs when there is no clearance between nozzle vanes and endwalls (hub or shroud side), while lower turbine efficiencies can be observed in three other cases corresponding to turbines with nozzle endwall clearances. Note that the smallest endwall clearances decrease turbine efficiency by more than 6 percent. Similar phenomena were also found by other researchers. Hu et al. [4] performed a 3D numerical simulation for turbine with and without nozzle endwall clearance to predict the turbine performance and indicated that the strong nozzle leakage can lead to more than 5% stage efficiency deterioration when operating at a small vane open condition. Furthermore, some special models with either hub or shroud side nozzle endwall clearance were tested by Walkingshaw et al. [8] to obtain turbine performance at three stator vane positions. The results showed a difference of 4.5% in efficiency at minimum mass flow rate stator vane position. Moreover, in the current paper, an obvious trend that the turbine efficiency decreases as the height of clearance increases is clearly presented by those curves in Figure 4.

Comparison of turbine performance for nozzle's 4 different endwall clearances at fixed speed.
In addition to turbine efficiency, the flow rate through turbine is also influenced by the nozzle's endwall clearances. For turbines without endwall clearance, the flow rate through the turbine firstly increases as the expansion ratio increases until the turbine chokes at its nozzle throat region. Compared with Case 1, the flow rate at choke points is increased by 17% in Case 4 for the turbine with maximum endwall clearance, which is larger than usual, since the existence of nozzle endwall clearance provides extra space for fluid to flow over nozzles. For the turbine with nozzle endwall clearances, the nozzle flow passage consists of two parts: one is normal nozzle flow passage, which is guided and controlled by two adjacent pivoting nozzle vanes; another one is nozzle endwall clearance, the area of which is decided by the height of clearance (c in the following equation) and the spindle of nozzle vane (not included in this research model), as well as the length of the clearance passage from pressure side to suction side of the nozzle vane (p-s′, which is associated with vane open conditions), as shown in Figure 5. The throat area of the whole passage, which allows the fluid to flow over nozzles, is calculated by the following equation:
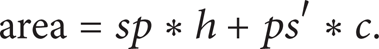
Flow passage of nozzles.
For the turbine without nozzle endwall clearance, the height of nozzle endwall clearance equals zero; hence the total area of nozzle passage decreases to minimal value (sp*h, only normal nozzle passage). As the nozzle endwall clearance (c) increases, the total area gradually increases. When a VGT turbine operates at choke point for a particular vane open position, the flow rate through the nozzle throat is nearly the same, but flow rate across the nozzle endwall clearance is different for different heights of endwall clearance. Moreover, due to the influence of a thin shearing boundary layer inside the endwall clearance, there is a nonlinear relationship between the height of the endwall clearance and the flow rate through clearance. The maximum difference in flow rate through turbine occurs at high expansion ratios.
The current research model consists of upstream nozzles and downstream rotors. To quantify the flow loss of internal flow induced by nozzle endwall clearances between the nozzle vanes and in the rotor, a nondimensional flow parameter, total pressure recovery coefficient (C p ), was calculated from time-averaged numerical results as follows:

where n represents the number of cross sections which are indicated in Figure 1.
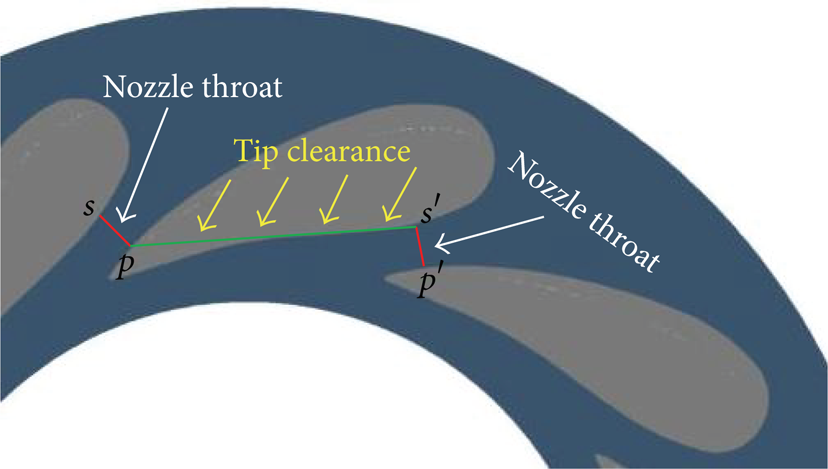
Figure 6 shows the comparison of C p in both the nozzle and the rotor. It is easy to observe that there are some significant variations in C p across the nozzle for the four different cases. The variations in C p across the rotor section are relatively small. This means that an existence of nozzle endwall clearances mainly increases the flow loss across the nozzle stage.
Comparisons of C p for 4 different nozzle endwall clearances.
Moreover, there is also a trend that as the nozzle endwall clearance increases, the loss of internal flow increases, especially at low U/C values. For instance, the maximum difference in C p between Cases 1 and 4 is about 6% at high U/C, while at low U/C values, it rises to 10%.
At low U/C values, the value of C p on the rotor is slightly increased with the increase of endwall clearances; that is, at low U/C values the nozzle clearance leakage flow is beneficial to improve rotor efficiency for this particular vane angle. This is because the high incidence angle is mainly responsible for poor rotor performance at the inlet of the rotor when the turbine operates at low value of U/C. However, the leakage flow from the nozzle endwall clearance features with such high-radial momentum can partly improve the incidence angle of the fluid entering the rotor as well as reducing the flow loss in the rotor.
4.2. Nozzle Endwall Clearance Leakage
Figure 7 shows the streamlines of nozzle endwall leakage. It is shown that an uninterrupted clearance leakage originates from the leading edge of the nozzle vane and ends up at the trailing edge. This CFD visualization may deviate slightly from real leakage flow. The reason is because in the current research model, the spindle of the vane was not modeled; thus the vortex after the spindle was not captured. Walkingshaw et al. [9] described the impact of the spindle of the nozzle vane on leakage flow. Along the chord of the nozzle vane, the clearance leakage in Figure 7 features different flow behaviors after leaving the exit of endwall clearance. According to flow characteristics in the downstream flow field of nozzles, the leakage flow can be divided into two parts as follows.
Over the front half of chord, the leakage flow marked with black streamlines indicates that the fluid enters endwall clearance from the pressure side of the nozzle vane and then moves towards the exit on the suction side. After leaving the endwall clearance, however, the leakage flow is nearly normal to the blade chord so that its direction is almost perpendicular to the main flow. Due to the strong interaction with the main passage flow, the leakage flow rolls up into a series of vortices. It should be noticed that the leakage vortices are gradually pushed away from the suction side of the nozzle vane by the continuous leakage flow downstream, which features high-radial momentum and pushes the vortices generated earlier away from the nozzle vane. This process is well illustrated by black streamlines in Figure 7.
Downstream of 60% chord, the streamlines marked with red color reveal that the fluid crosses the endwall clearance and then enters the downstream space of the nozzles. Instead of joining into upstream leakage vortices or forming new leakage vortices, this part-leakage flow (leakage jet) directly ejects into the space between the nozzles and crosses the narrow region between the aforementioned leakage vortices and endwalls after exiting endwall clearance. This leakage flow is almost perpendicular to the direction of the main passage flow and flows downstream towards the rotor in a nearly radial direction. This is because the upstream leakage pushes a part of the main passage flow away from the suction side of the nozzle vane at low/high span, as shown in Figure 8. Compared with the yellow streamlines (central passage flow, that is, the mid span flow) in the bottom plot, the main passage flow in the top plot obviously changes the trajectory of its own. Thus, the downstream leakage flow rarely interacts with the main passage flow after exiting endwall clearance, resulting in no strong shearing forces from the main flow to sharply turn the direction or to roll up the leakage flow.

Leakage flow of nozzles.
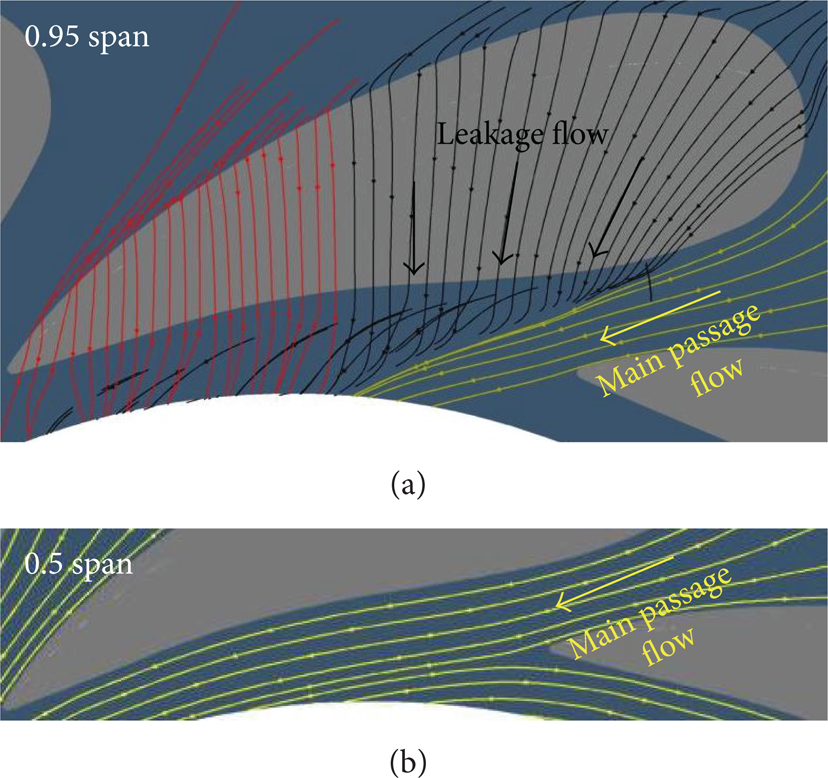
Distribution of streamlines at both midspan and 95% span.
Figure 9 shows the distribution of Mach number along the chord of the nozzle vane at middle-height of clearance. In Case 2, the strong effect of the boundary layer inside endwall clearance slows down clearance leakage flow. As a result, Mach number is relatively low throughout the chord. As the endwall clearance increases, the boundary's effect decreases, leading to a significant rise in Mach number throughout the chord. No matter how high the clearance is, the leakage flow varies along the nozzle vane chord and the peaks of Mach number occur around 90% chord. Meanwhile, the Mach number is lower in first 50% of chord than the second half. This suggests that most parts of leakage flow cross endwall clearances from the second half of chord.

Distribution of Mach number at monitoring locations at middle-height of clearance.
In addition to heights of endwall clearance, there are three other main factors that seriously influence the clearance leakage. The first one is the pressure difference between the two sides of the nozzle vane. Some references [2, 10] indicated that the difference of static pressure between pressure and suction sides is the driving force that pushes fluid across the nozzle endwall clearance. Figure 10 shows the pressure distribution across vane surface at 0.9 span. For most of the chordwise section, the positive load can provide a force to drive the fluid through the endwall clearance while the negative load in 95% downstream of the chord would suppress clearance leakage.
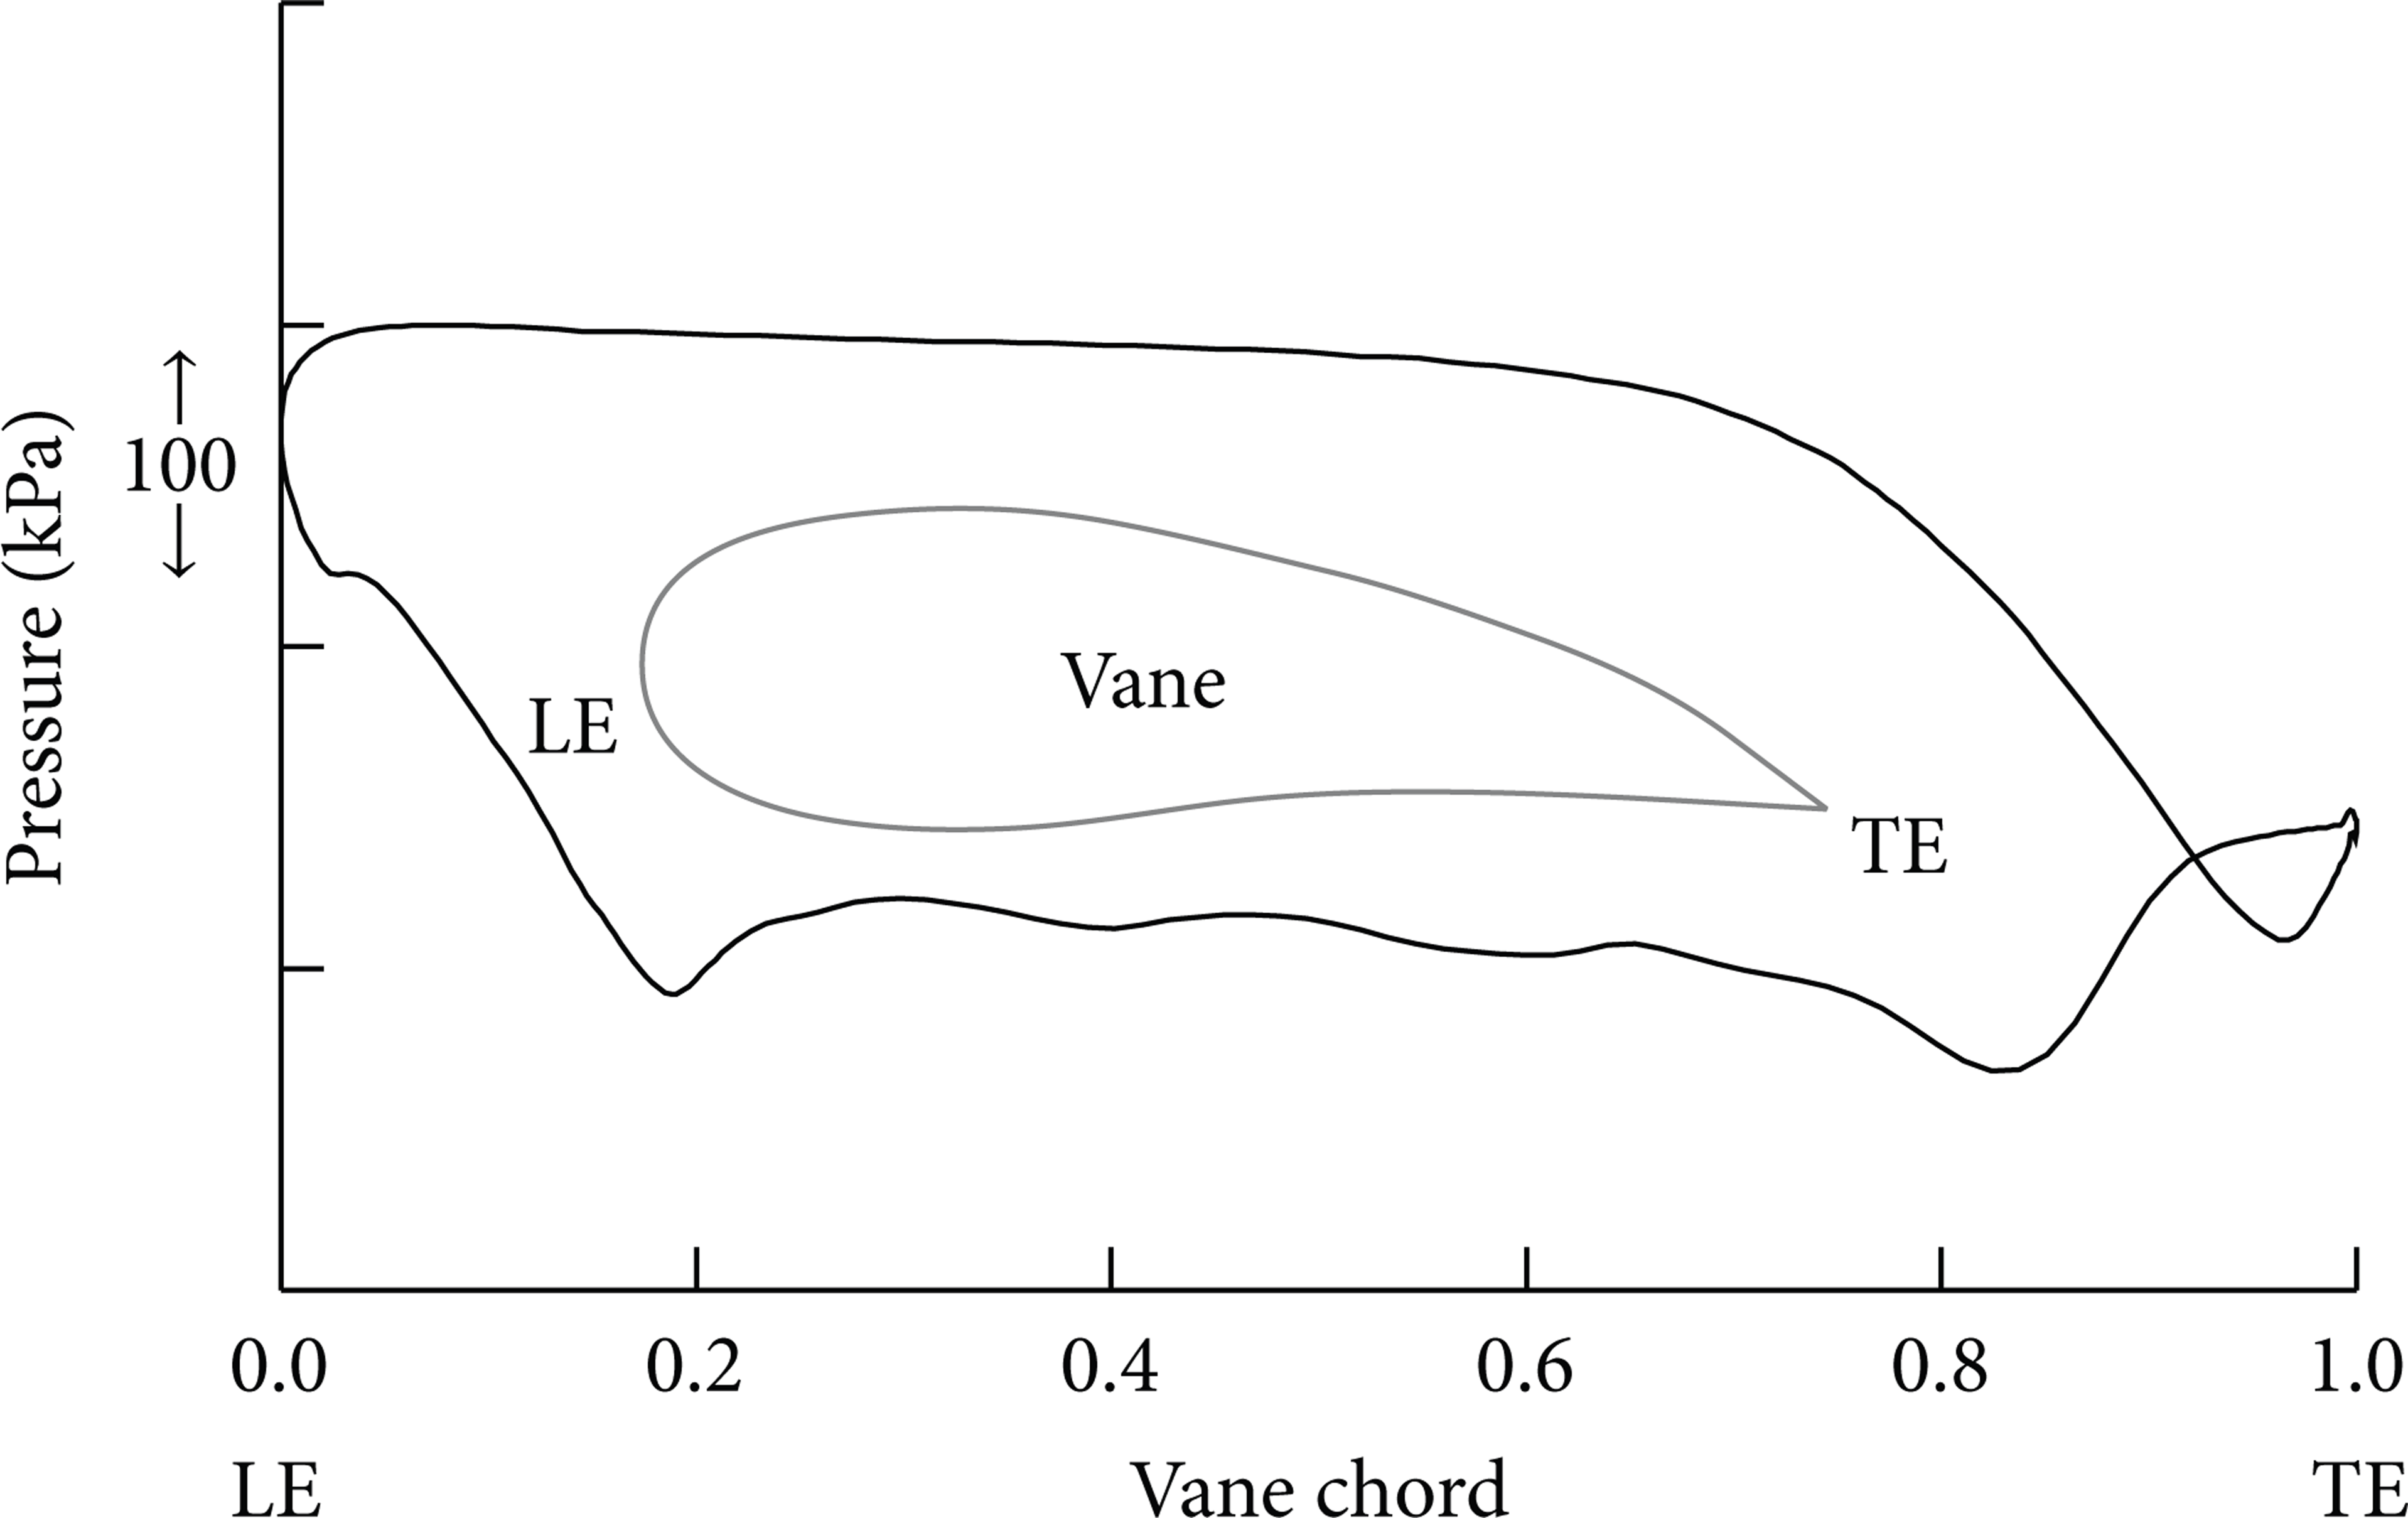
Nozzle vane load at 90% span.
Besides the pressure difference over the endwall clearance, both the thickness of the nozzle vane and fluid momentum play important roles in the clearance leakage as well. As the height of clearance remains the same, the thickness of the vane is associated with the force of suppressing the leakage flow, for the boundary layer can be more effective in suppressing the leakage flow through the endwall clearance if the leakage flow travels a long distance in a narrow endwall clearance. For the aerodynamic nozzle vane of this design, its thickness is larger near the leading edge and gradually decreases along the chord. As a result, the effect of the boundary layer suppressing the leakage flow through the endwall clearance gradually reduces along the chord of the nozzle vane. This is one of the reasons why the Mach number increases gradually for the first 90% chord in Figure 9. At 90% chord, the location is near the nozzle passage throat where the fluid is featured with peak Mach number, thus having high kinetic energy. Therefore, the high kinetic energy near the nozzle throat, small thickness of nozzle vane, and the low pressure difference near the throat collectively contribute to the strongest leakage flow around 90% chord. Although the thickness of the nozzle vane continues to decrease to the smallest value at the trailing edge, the opposite pressure difference successfully leads to a reduction of leakage flow there.
4.3. Shock Wave in Turbine
Figure 11 shows the contour plots of Mach number at nozzle exit for turbines with four different endwall clearances. From these pictures it can be seen that strong shock waves represented by steep Mach number gradients are located near the trailing edge of the nozzle vane. This is due to a high expansion ratio across the nozzles. Besides the high expansion ratio, the nozzle endwall clearance also has a significant influence on the shock wave, including spanwise distribution and intensity of the shock wave.

Distributions of Mach number with isoline at nozzle exit.
The existence of nozzle endwall clearances can decrease the spanwise height of shock waves. For instance, in the case of a turbine without endwall clearances (top plot in Figure 11), shock waves nearly occupy the whole spanwise height. Although there is the boundary layer's influence, a weak shock wave even appears near the hub and shroud endwall. Compared with the boundary layer, however, the clearance leakage is more effective in weakening shock waves in the regions near the endwall. Thus, the span of shock waves is greatly decreased in the three bottom plots in Figure 11, which correspond to turbines with three different nozzle vane endwall clearances. As the height of the endwall clearance increases, the span of shock waves gradually decreases.
Figure 8 has shown that, in the region near endwall, the leakage flow occupies part of the nozzle flow passage and forces the main passage flow near the nozzle throat area to deviate the original flow trajectory. As a result, the main passage flow does not expand along the suction side of the nozzle vane, thus narrowing the span of shock waves. The larger leakage vortex occupies more space of the main flow passage and pushes more main passage flow against the nozzle vane (which will be discussed in next section). This is why as endwall clearance increases, the span of shock waves gets shorter.
The intensity of shock waves is also associated with nozzle endwall clearance. In both turbines, with or without nozzle endwall clearances, the strongest shock wave always occurs at midspan, such as in Figure 11. This indicates that both boundary layers and clearance leakages have effects on shock wave. Compared with the top plot in Figure 11, the shock waves are significantly strengthened at midspan due to the existence of nozzle endwall clearances. This suggests that the existence of nozzle endwall clearances can strengthen shock waves at midspan even though it pushes a part of the main passage flow away from the nozzle vane. Besides, comparing the value of Mach number before shock wave, the highest Mach number occures at midspan in Case 3 rather than in Case 4.
Figure 12 shows the interaction between clearance leakage and main passage flow. Because more leakage flow from downstream clearance (in the first half chord) continuously joins in the leakage vortices, providing more energy and fluid to the development of leakage vortices, and the endwall leakage flow with high-radial momentum pushes the leakage vortices away from suction side of the nozzle vane, the leakage flow gradually flows away from nozzle vanes. On the contrary, the main passage flow from the geometric nozzle throat flows downstream without further deviation from the vane surface. Therefore, there is a different trajectory between the leakage vortices and main passage flow. When interacting with main passage flow, the leakage vortices occupy the space adjacent to the endwalls, reducing the actual passage area, which otherwise allows main passage flow to pass, forming an aerodynamic throat region downstream of geometric nozzle throat, as shown in Figure 12.
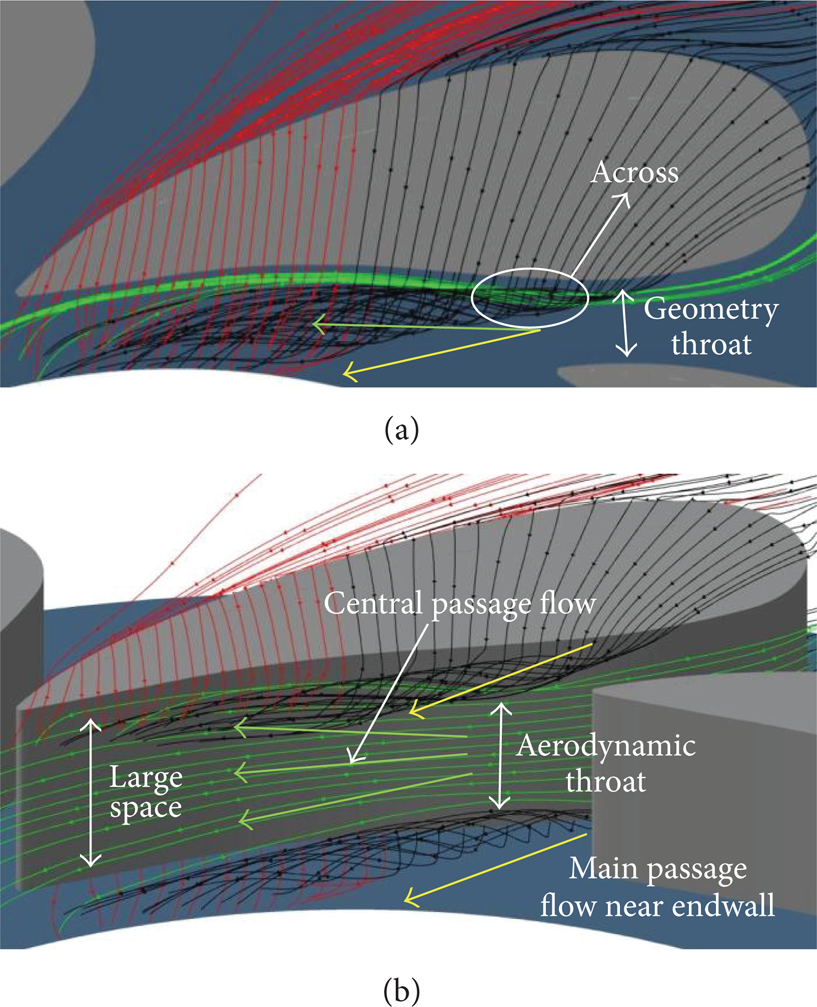
Model of clearance leakage flow interactions with main passage flow.
When flowing through nozzles, the main passage flow undergoes two accelerations. The first occurs in the section before the geometric nozzle throat. This is one of the main aims in designing nozzles upstream of the turbine wheel. The new feature observed in the present work, however, is the second acceleration after the geometric nozzle throat, due to the interaction between the leakage vortices and the main passage flow. After passing the geometric nozzle throat, the main passage flow will go through a region of passage that is reduced by leakage vortices, that is, an aerodynamic throat. At low and high span positions, the main passage flow is pushed away from the nozzle vane by leakage vortices (described in Figure 8); thus only central passage flow passes through the narrow region (aerodynamic throat) and contributes to the formation of shock waves. Downstream of the aerodynamic throat, the central passage flow has more space to expand and thus continues to accelerate. As a result, higher Mach number appears near the trailing edge of the vane. This is why the existence of nozzle endwall clearance can centralize the shock wave at midspan. However, the larger leakage vortices can push more main flow away from suction surface so that the main flow which would expand through central passage close to suction surface of nozzle vane at midspan is reduced. One of its results is that the Mach number at midspan near trailing edge of nozzle vane is lower in Case 4 than that in Case 3, as shown in Figure 11.
4.4. Flow Loss
Figure 13 shows the flow patterns at six cross sections after the nozzle throat. From these plots it can be seen that the leakage flow and the interaction between the leakage and the main flow result in flow losses around and between the nozzle vanes. For example, the regions with high entropy appear at each cross section in the plots corresponding to turbines with different endwall clearances (Case 2 through Case 4). These flow losses are partly responsible for the decrease in turbine efficiency due to nozzle endwall clearance. The work of Roumeas and Cros [3] also indicated that the clearance leakage leads to the development of vortices along the nozzle vane chord that tends to increase the total pressure loss in the nozzle. Natkaniec et al. [11] performed a numerical research of secondary flow structures and losses in a turbine with realistic vanes and found that some typical vortices generate a lot of flow loss in stator.

Flow loss of leakage flow, main passage flow, and wake in and between nozzle vanes.
A two-dimensional nozzle vane generates a straight wake in the downstream region of trailing edge. The wake nearly keeps straight during transporting downstream with main passage flow in the turbine without endwall clearances, as shown in the left-top corner plot in Figure 13. For the turbine with nozzle endwall clearances, an interaction between leakage vortices and wake would be inevitable because of their different flow trajectories. Other plots in Figure 13 show that not only does the leakage flow push the main passage flow away from nozzle vane, but also it squeezes the wake, resulting in a stretch of the wake. Two ends of the wake near the endwalls move inwards to negative radial direction. These aerodynamic interactions also contribute to the decreased turbine efficiency. And as the size of leakage vortex increases, the deformation of wake is more massive. This supports the argument that large endwall clearance can push more main passage flow away from the nozzle vane.
The clearance leakage not only causes flow loss around and between nozzles, but also influences the flow in the downstream turbine wheel by changing the inlet condition to the rotor. Dai et al. [12] indicated that the uniform inlet condition can make predicted efficiency improvements by 1–3%, compared to actual distorted inlet condition to the rotor which was captured by experiments. Thus, the inlet condition is a sensitive factor for rotor performance. In the current research, Figure 6 shows that the most loss of internal flow is around and between nozzles, and an existence of nozzle endwall clearances can improve slightly the rotor performance at low U/C values. At low U/C values, the large positive incident angle causes a lot of flow loss near the leading edge of the blade, while the leakage flow with high-radial momentum can reduce the incident flow loss by reducing the incidence angle.
Figure 14 shows the distribution of normalized meridian components of velocity at the inlet of the rotor for four cases. The larger endwall clearances worsen the distortion of inlet condition. For example, compared with Case 1, the distorted inlet condition of downstream rotor is more serious in Case 4. These distortions mainly consist of shock wave, leakage vortices, leakage jet, and different main passage flow, as shown in Figure 14. Among them, the main passage flow with high meridian velocity, pushed by leakage vortices, would enter downstream rotor with relatively low positive incidence angles, reducing incident loss in rotor passage, while other parts of main passage flow (central passage flow) with the lowest meridian velocity, experiencing a strong acceleration after nozzle throat, would provide a large positive incidence for the downstream rotor, decreasing rotor efficiency. These phenomena suggest that the leakage flow affects the incidence for downstream rotor, while the uniformity of main passage flow will affect the inlet condition of the turbine wheel. However, the leakage flow features such a high meridian velocity that it is still the dominant factor on the incidence angle for the turbine wheel. So far, design and optimization of nozzle vane in VGT turbine almost does not include the effect of nozzle endwall clearance on incident angle at the inlet of the turbine wheel. According to the above analysis on inlet conditions of downstream rotor, the endwall clearance not only causes serious distortion in flow angle at the rotor inlet, in both spanwise and circumferential directions, but also strengthens shock wave at midspan. Thus, nozzle endwall clearance should be taken into account in the design process of the nozzle vane.

Distribution of meridian component of velocity at inlet of rotor.
5. Conclusions
A 3D computational simulation has been conducted on a variable geometry turbine from an automotive turbocharger with different nozzle clearances. The steady and unsteady numerical simulations were used to analyze the effect of the nozzle endwall clearance on turbine performance and internal flow. The numerical simulations indicated the following.
The nozzle endwall clearance leakage flow from different chordwise locations may experience different trajectories after exiting the endwall clearance. In the first-half chord of nozzle vane, the clearance leakage flow rolls up and forms vortices after exiting the endwall clearance. However, in the downstream 40% chord, the strong leakage jet directly ejects downstream without joining with leakage vortices from upstream or forming new vortices, due to the lack of a strong shearing action against the main passage flow. Four main factors to influence leakage flow have been identified as follows:
the height of endwall clearance: small clearance is beneficial to reduce the leakage flow, compared with large clearance;
the pressure difference across the nozzle vane: positive vane load can drive the fluid flows across endwall clearance, while the negative load is able to suppress the leakage flow;
the thickness of nozzle vane: for aerodynamic nozzles, the thickness of nozzle vane varies in a big scale along chord, and the different thicknesses of vane have different resistances for leakage flow;
the momentum of fluid before entering endwall clearance: the high momentum is able to overcome the resistance inside narrow endwall clearance.
In the variable geometry turbine without endwall clearances, the formation of shock wave is mainly because of a high-pressure drop and convergence of flow passage between the nozzle vanes. For a turbine with fixed endwall clearance, the leakage flow affects shock wave in two aspects. The first one is that the leakage flow pushes a part of the main passage flow away from the nozzle vane in the regions near hub and shroud side. This detachment of main passage flow near the endwalls narrows the shock wave towards the midspan of the nozzle vane. The second aspect is the formation of a strong acceleration region after the geometric nozzle throat. This effect can greatly strengthen shock wave at midspan.
This paper only focuses on the models with the same height of the endwall clearances located separately at two ends of nozzle vane, but in the real work environment the endwall clearances may be uncertain because of vibration. Therefore, the future research work will focus on the effect of the uncertain endwall clearance on the interaction between the leakage flow and main flow in a VGT turbine.
Conflict of Interests
The authors declare that there is no conflict of interests regarding the publication of this paper.
Footnotes
Nomenclature
Acknowledgments
The authors are grateful for the financial support of National Natural Science Foundation of China (no. 51176013) and Ford Motor Company.