
Abstract
The addition of drag-reducing agents to reduce pipe friction loss has attracted attention as a method to conserve energy. In addition to reducing drag, these agents are required to have a low environmental load and conserve natural resources. Therefore, naturally occurring biopolymer additives, which are considered to have a low environmental load, have recently received much attention. Here we focused on nata de coco, a type of biopolymer that exhibits low mechanical degradation, and found that it reduced drag by up to 25% at a concentration of 50 ppm. With respect to the drag reduction (DR) mechanism, we investigated the relation between DR phenomena and the fiber structure of nata de coco by visualization. As a result, we found that the DR effect appeared only when a network of nata de coco fibers was formed in the suspension. In addition, DR increased as the size of the network of nata de coco fibers increased.
1. Introduction
There has been growing interest in research on energy consumption with the aim of resolving environmental issues. Furthermore, technological development is expected to encourage energy and environmental solutions. Consequently, in association with energy conservation techniques, the addition of a drag-reducing agent to reduce pipe friction loss has attracted attention since the discovery that adding polymers to a turbulent flow reduced the pressure drop [1]. For instance, one study investigated the effect of friction drag reduction (DR), caused by the injection of drag-reducing agents into a pipe flow in a heat-transport system, on energy consumption [2]. The authors found that this reduction of pressure loss in a pipeline significantly reduced energy consumption because it reduced the cost of operating pumps in the system. Drag-reduction techniques also have the potential to enable smaller and more efficient fluid flow devices.
Many techniques can be used to reduce flow resistance. In particular, the method of adding a drag-reducing agent to the liquid has attracted attention because it may provide a low-cost solution that uses an existing device. As mentioned above, the addition of a drag-reducing agent (typically a polymer [3, 4]) to the fluid base has been shown to achieve the highest reduction in flow resistance. DR by adding surfactants [5–7] has been applied to regional heating systems and air-conditioning systems in buildings. However, because the additives used in these techniques are composed of synthetic materials, careful disposal of the drained solutions is required to prevent them from contaminating rivers and soil. For this reason, such drag-reducing additives are used only in closed-loop pipelines. In contrast, naturally occurring biopolymer additives have recently received considerable attention because they are considered to have a low environmental load. Accordingly, much consideration was given to the drag-reducing mechanism of biopolymer by a number of studies [8–11]. However, the DR mechanism of biopolymers remains to be determined. Moreover, there are mechanical degradation problems.
In recent years, we have focused on nata de coco, which is a type of biopolymer that is easily available and inexpensive. We have found that it reduces drag by up to 11% at a concentration of 400 ppm in research using a syringe pump [12]. Furthermore, nata de coco suspensions show an effect similar to type-B DR [13], which is seen in fully extended polymer molecules. However, there are still many unexplained phenomena of nata de coco suspensions associated with DR.
Therefore, the purpose of this study is to reveal the drag-reducing behavior of nata de coco suspensions in a pipeline-flow loop by pressure loss measurements and visualization. Furthermore, nata de coco is used for reinforcement in composite materials owing to its high strength and complex network structure. Therefore, nata de coco has the potential to exhibit low mechanical degradation because of the high mechanical strength of its filaments. In other words, nata de coco has the potential to resolve the problem of mechanical deterioration as well.
2. Experimental Setup and Procedure
2.1. Nata de Coco Suspensions
The tested nata de coco suspensions were made from commercial sources. First, the nata de coco was washed with tap water and then immersed in tap water for 24 h to remove sugar (Figure 1). Second, nata de coco was pressed at 10 ton/m2 and then dried in a refrigerator. Figure 2 shows the dried nata de coco. The mass of dried nata de coco was 0.26% compared to that of commercial nata de coco before it was dried. This suggested that cellulose, which is a major component of nata de coco, was extracted from the commercial product because nata de coco contains over 99% water and less than 1% cellulose. Finally, nata de coco suspensions were prepared by mixing the dried nata de coco with tap water in a blender. The blender was operated at a rate of 11,000 rpm with a mixing time, Tblender, of 1 to 10 min. The suspension concentration, C w , was determined by the mass ratio of dried fiber to the amount of total tap water in the pipeline.

Commercial production of nata de coco.

Micrograph of dried nata de coco (× 35).
2.2. Experimental Apparatus
Figure 3(a) shows a schematic of the experimental apparatus used in this study. The total length of the pipeline, which was made of stainless steel, was 5100 mm, and the experimental apparatus consists of a tank, pump, injection device, pressure transducer, and flow meter. Four liters of tap water were used as a solvent for nata de coco suspensions in this study. The suspensions were circulated by a pump (25SCD 5.25: Ebara Technologies, Inc.), which was controlled by an inverter (Sysdrive 3G3MV: Omron Electronics, Inc.). The pressure difference was measured using a Validyne differential pressure transducer (DP15, ± 0.25% F. S. accuracy). The pressure transducer data was recorded by a data logger (NR-1000: Keyence Japan). The pressure drop was determined by averaging 50 data points measured at intervals of 100 ms. The flow rate was measured by an electromagnetic flow meter (COPA-XE: Nippon Flow Cell Co., Ltd.). Figure 3(b) shows a detailed schematic of the pipe from the injection port to the measurement part for the pressure drop (the test section). The test section had an inner diameter of 15 mm, and the length with the pressure drop was 300 mm. The temperature of the suspension was maintained within ± 1.0°C of the target temperature (20°C) by using a constant-temperature reservoir (LTB-125: As One Corporation). The flow was fully developed because the injection port (inner diameter: 3 mm) was set at a point 1020 mm from upstream pressure port (inner diameter: 1 mm) in consideration of the entrance length. Nata de coco suspensions were injected through an injection port. The pressure drop was measured by injecting additives into the circulating tap water. The mean flow rate of the injection was 0.7 mm/s, which was about 0.05% of the mean flow rate in the pipe. The concentration of the nata de coco suspension in the pipeline was adjusted to values of C w = 12.5, 25, 50, and 100 ppm (the corresponding concentrations before injection were 625, 1250, 2500, and 5000 ppm).

(a) Experimental apparatus. (b) Details of test section and injection port.
3. Results and Discussion
The viscosity of the test fluids was measured by means of a cone-plate viscometer (HAKKE Reostress 600). Figure 4 shows the viscosity of nata de coco suspensions at C w = 50 ppm. The viscosity of the nata de coco suspensions shows the shear thinning behavior and increases with decreasing Tblender (or with increasing DR, as will be shown in Figure 9).

Viscosity of nata de coco suspension.
Figure 5 shows the effect of the injected nata de coco on DR. To quantitatively estimate the amount of DR, the experimental results are expressed in terms of the DR coefficient:
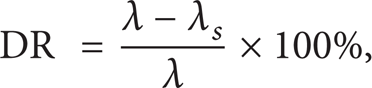
where λ and λ s denote the friction coefficients for tap water and nata de coco suspensions, respectively.

Effect of injection on DR.
The horizontal axis represents the injection volume V, which is the total injection volume of nata de coco suspension (625, 1250, 2500, and 5000 ppm); the vertical axis represents DR. This figure shows that DR was ∼0% when the tap water was injected into the pipe. Therefore, the injection of tap water has minimal influence on DR. However, DR increased with an increase in the total injection volume and concentration of nata de coco suspensions. The concentrations of the suspensions in the pipe after injection were 12.5, 25, and 50 ppm. From these experimental results, it can be seen that the DR effect occurs immediately after injection, but the DR value requires time to become stable. However, it is believed that if one waits a long time to stabilize the DR value, mechanical degradation occurs. Therefore, the effect of this degradation has been investigated.
Figure 6 shows the results of measuring the DR effect in an experiment conducted over a long duration. The horizontal axis represents the experimental time H, and the vertical axis represents the DR. This figure shows that the DR was maintained at almost a constant value for approximately 14 h. Under the flow rate used in this experiment, nata de coco circulated through the pump about 10,000 times. Therefore, it was revealed that the nata de coco fiber exhibits low mechanical degradation. Hereafter, all figures are plotted from data taken only after the experiment has been running for an hour, at which time it is considered that the DR values have become sufficiently stable.

Effect of degradation on DR.
Figure 7 shows the experimental results for the friction coefficient. The dashed line in the figure was obtained by using the Blasius equation for turbulent flow. The measured friction coefficient of tap water was within ± 1% of the value calculated using the Blasius equation. The nata de coco suspensions had lower friction coefficients than tap water for each concentration (∼100 ppm). The DR increased with the increasing concentration of the suspensions, and the slope of this increase was parallel to the line of the Blasius equation.
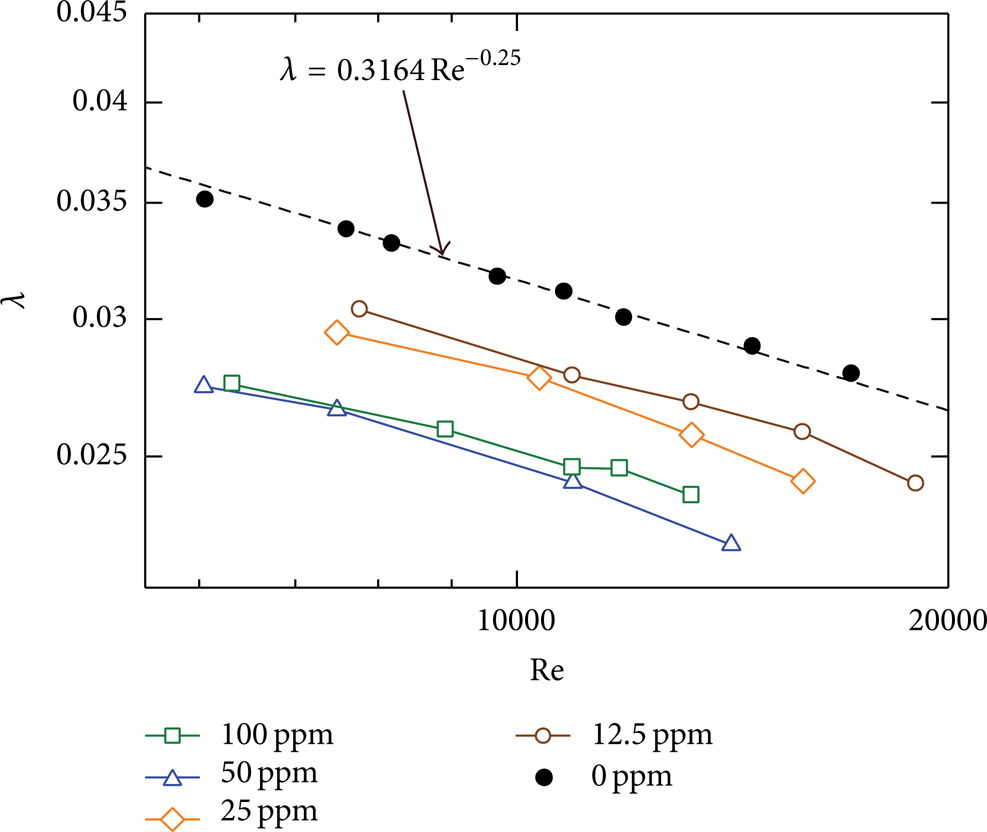
Friction factor of nata de coco suspensions.
Figure 8 shows the effect of concentration on DR at 0–100 ppm in the case when the flow rate in the pipe is constant (Re = 11000) and Tblender is 1.5 min. The figure shows that DR increased with the increasing concentration and reached values up to 25% more than its original value when the concentration was increased to 50 ppm. At a concentration of more than 50 ppm, DR was nearly constant.

Effect of concentration on DR.
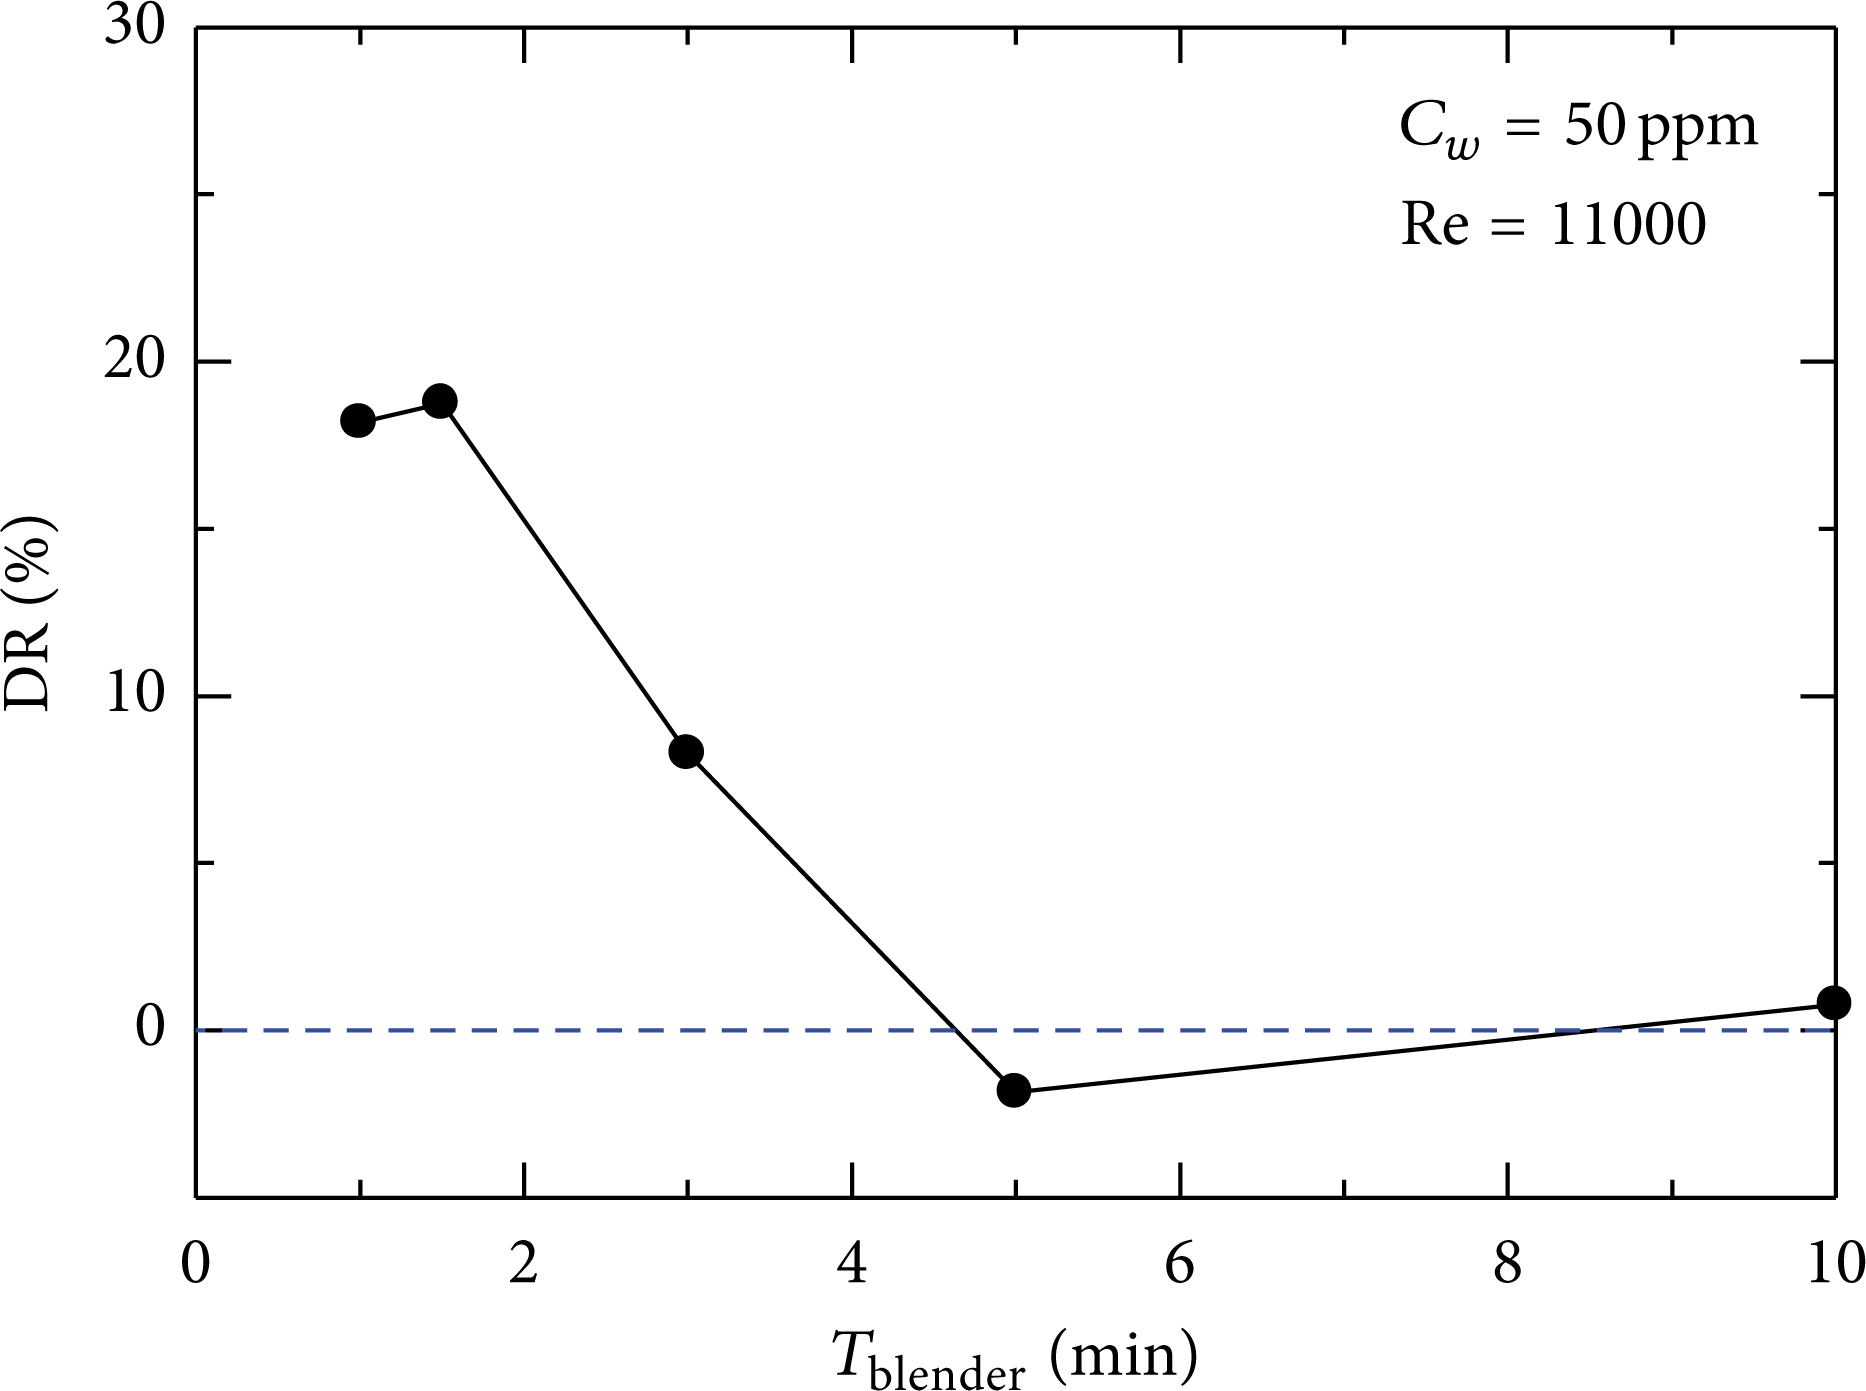
Effect of the operating time of the blender on DR.
We researched the relation between the scattering time in the blender and DR because DR was significantly affected by scattering time during the experiment. Figure 9 shows the effect of scattering time in the blender, Tblender, on DR. Tblender on the horizontal axis is the mean of the scattering time in the blender when the nata de coco suspensions were prepared. DR was observed for scattering times of ∼1–3 min, although a change in DR was not observed in the case of long scattering times (more than 5 min). This shows that DR is significantly affected by the scattering time in the blender. In the case where the scattering time was less than 1 min, experiments could not be conducted owing to the insufficient dispersion of nata de coco fibers.
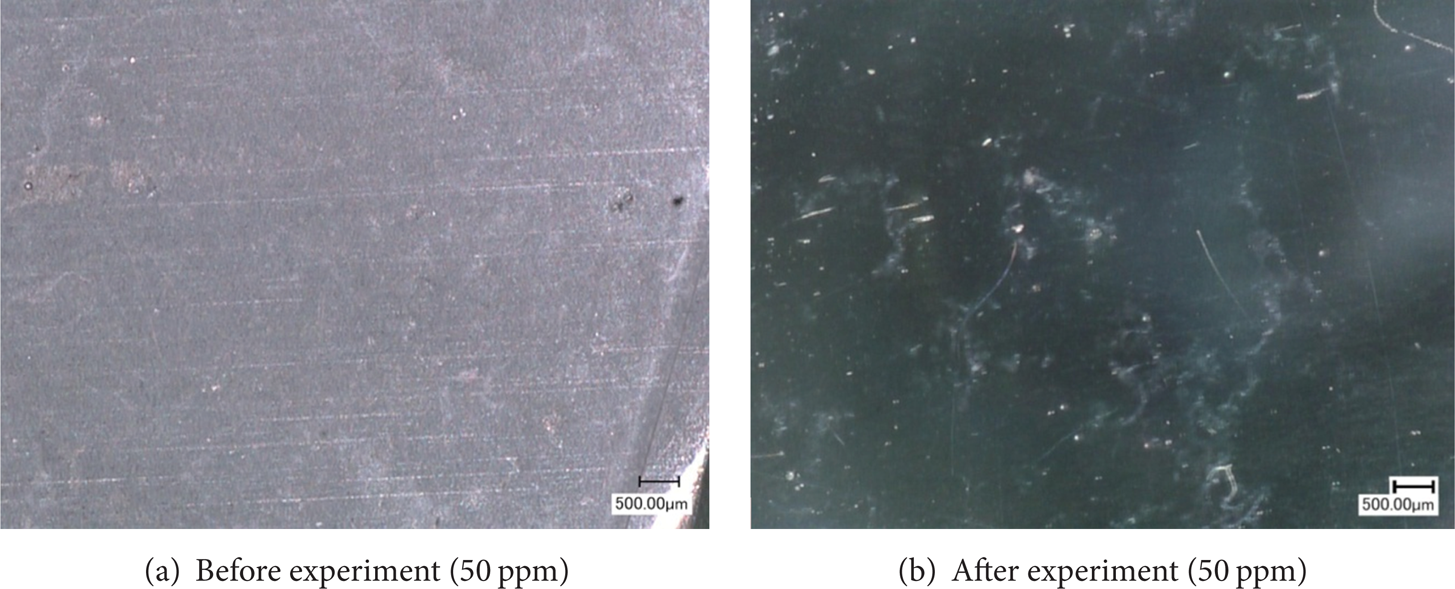
To investigate the mechanisms of DR, we observed fiber formation at scattering times of 1.5 and 10 min. Micrographs of nata de coco suspensions were taken with a high-speed microscope (VW-9000 and VH-Z35, Keyence, Japan). A droplet of the nata de coco suspension on a glass plate was measured at a magnification of × 35. Figure 10 shows micrographs of nata de coco fibers (a) before and (b) after experiments in the case of 20% DR at a Tblender value of 1.5 min. After the experiments, the fibers were tangled, and a large network of fibers was formed. Figure 11 shows micrographs of nata de coco fibers in the case of 0% DR at a Tblender value of 10 min. Significant differences were not observed between the micrographs taken (a) before and (b) after the experiments. These results show that a large network of fibers had formed when DR occurred in spite of the small difference between Figures 10(a) and 11(a). Why the DR differs without an obvious difference in the initial state is unclear. We surmised that this was because the difference was too small to be measured by the microscope. Therefore, we next observed microregions with a scanning electron microscope (SEM) (VHX-D500/D510: Keyence, Japan).
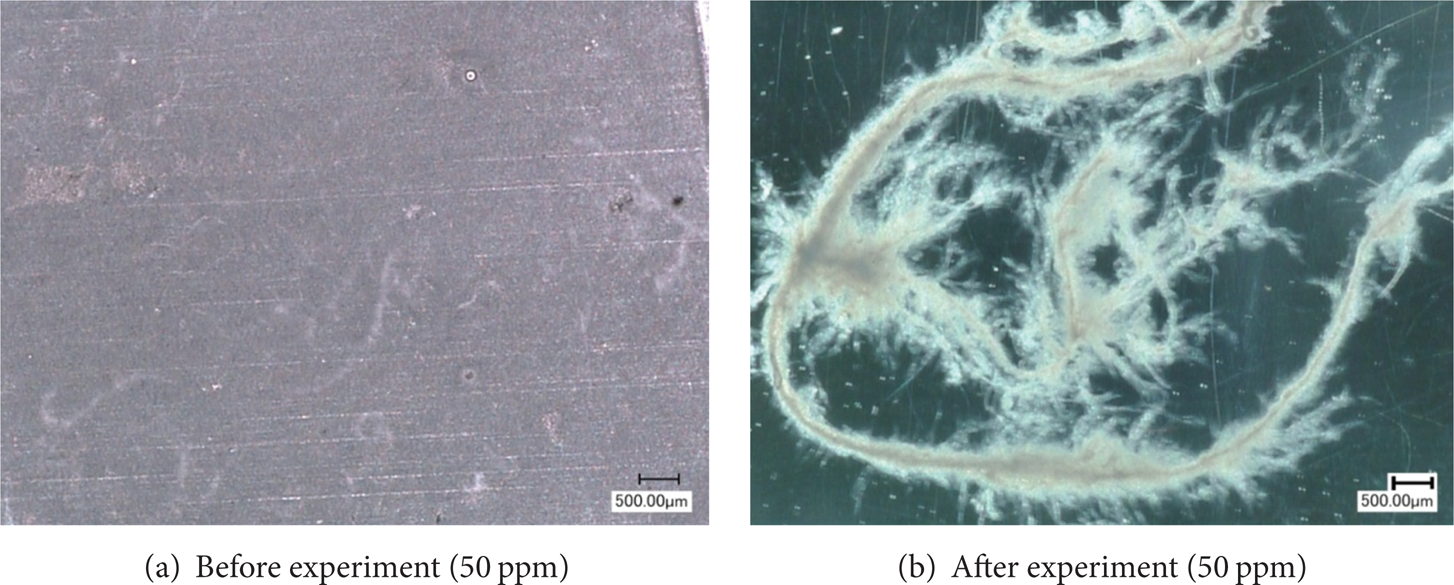
Change of the fiber form (Tblender = 1.5 min, DR = 20%).
Change of the fiber form (Tblender = 10 min, DR = 0%).
Figures 12 and 13 show the observation results. Given the nature of SEM observations, moisture has been removed from the samples. In other words, the micrographs show fibers in their solid state. No apparent difference in mesoscale networks is observed between the initial states at Tblender = 1.5 min and Tblender = 10 min. However, small-scale networks are far more common at Tblender = 1.5 min than at Tblender = 10 min. After the experiment, the fiber network at Tblender = 1.5 min becomes bundled to form a large network. In contrast, the network at Tblender = 10 min retained a large number of holes. We found that the initial state of the fiber has a significant impact on forming a large network. Therefore, we suggest that a large network of nata de coco fibers may play an important role in DR. However, evaluating the network quantitatively is difficult because we measured its length and diameter approximately from Figures 10 and 11.

Observation by SEM (Tblender = 1.5 min, DR = 20%).

Observation by SEM (Tblender = 10 min, D R = 0%).
Figure 14 shows the results of measuring the size of the fiber formed after the experiment. We measured the length and diameter of the fiber from the micrographs. Elongated white objects were considered fibers, whereas objects that could not be determined were not counted. If the network structure was branched as in Figure 10(b), we measured only the maximum length of the network. The diameter was measured at the largest part in the network. The horizontal axis shows the fiber diameter, D (mm), and the vertical axis shows the fiber length, L (mm). The solid line in the figure shows the average value of the fiber aspect ratio. DR increased with increasing fiber diameter and length, as noted in Figures 14(a), 14(b), and 14(c), while significant differences were not observed in fiber size before the experiment. Furthermore, it was found that DR decreased in the case where large fibers were not formed at long values of Tblender. However, much the same aspect ratio was observed in each experiment. From these results it can be seen that DR was observed in the case where a large network of nata de coco fibers was formed, while in the case where a large network was not formed, no DR was observed.

Effect of fiber size on DR.
4. Conclusions
In the present work, we investigated the drag-reducing behavior of nata de coco suspensions in a pipeline-flow loop. We observed the following findings:
DR by use of nata de coco suspension exhibited low mechanical degradation,
DR increased with increasing concentration and reached 25% when the concentration was increased to 50 ppm,
DR was observed only when a network of nata de coco fibers was formed in the suspension,
DR increased with increasing network size of nata de coco fibers.
Nata de coco is considered a candidate drag-reducing agent in addition to existing polymer and surfactant solutions. Moreover, nata de coco can be applied to full-scale experiments for long durations because it has low mechanical degradation. Therefore, nata de coco is highly suitable for application to actual equipment devices that must be enhanced with a long-lasting DR effect.
Conflict of Interests
The authors declare that there is no conflict of interests regarding the publication of this paper.