
Abstract
Bubbly flows exist extensively in industrial processes. To enhance efficiencies of industrial processes, it is very necessary and important to understand detailedly mechanisms of liquid turbulence modulation by bubbles. To understand mechanisms of the liquid turbulence modulation by microbubbles, an Euler-Lagrange two-way model was used to investigate and analyze deeply the liquid turbulence modulation by microbubbles in the subviscous, buffer, and outer layers, respectively. The present results show that the liquid turbulence modulation by microbubbles is related to microbubble locations; the liquid turbulence is intensified when microbubbles are in the outer layers, whereas the liquid turbulence is suppressed when microbubbles are in the subviscous and buffer layer; and the drag reduction occurs only when microbubbles are in the buffer layer.
1. Introduction
Bubbly flows are frequently observed in a wide range of industrial processes such as metal smelting, two-phase heat transfer, aeration and stirring reaction, fermentation reaction, mineral floatation, bubble column reaction, air conditioning engineering, wastewater treatment, and transportation lines [1–3]. In order to improve and enhance efficiency of the above engineering processes, it is very necessary and important to deeply understand hydrodynamics of bubbly flows. Particularly, an accurate understanding of liquid turbulence modulation by bubbles is extremely significant for industrial applications and for designing an engineering system of bubbly flows.
Presently, lots of investigations have been performed to explore mechanisms of the liquid turbulence modulation by bubbles. Experimental investigations had been conducted by researchers [4–9]. Numerical studies had also been carried out by researchers [10–18]. Kim et al. [19] conducted theoretical analyses on the liquid turbulence modulation by microbubbles. Although many studies on the liquid turbulence modulation by bubbles had been performed, a generally acceptable mechanism explanation has not been achieved yet. The finite understanding of the liquid turbulence modulation has directly limited understandings of drag reduction by microbubbles.
Of many mechanisms on the drag reduction by microbubbles, two kinds of views are worthy of being deeply discussed and being further studied. One is proposed by Kanai and Miyata [10], who considered that the bubble accumulation near the wall prevents the sheet-like structure of the spanwise vorticity from developing toward the flow core, thereby causing the drag reduction. The other is developed by Ortiz-Villafuerte and Hassan [8], and they concluded that the stagnant bubble layer near the wall has an insignificant effect on the drag reduction, whereas the interaction between microbubbles and liquid turbulence in the buffer zone is mainly responsible for the drag reduction. It is evident that the above two views are inconsistent. Therefore, we want to know what great influence on the liquid turbulence will be engendered by changing the layer location of microbubbles. Namely, when microbubbles are located in different turbulence layers, how will they influence the liquid turbulence? That is just the research purpose of this paper.
To understand the liquid turbulence modulation by microbubbles in different turbulence layers, microbubbles are injected in the same layer for the same case, and for the same case microbubbles stay the same layer all along. Namely, the microbubble displacement in the wall-normal direction always keeps unchanged in the whole computational process for the same case. The present investigation was accomplished with the aid of a developed Euler-Lagrange method. The velocity field of liquid was solved by DNS, and the microbubble motions were tracked by Newtonian motion equations. The forces exerting on microbubbles were calculated according to the real flow condition without any assumptions. Interphase forces, including the drag force, the shear lift force, the pressure gradient force, and the added mass force, were considered into the present computation. Interactions between microbubbles were neglected for the present condition, and microbubbles were always supposed to be spherical in shape and to be nondeformable due to a very small size (i.e., We ≪ 1) [1].
2. Computational Conditions and Method
2.1. Computational Conditions
The computational domain is a vertical upward channel with respect to the gravity direction. The geometry size and coordinate system are shown in Figure 1, where x-, y-, and z-axes correspond to the streamwise, wall-normal, and spanwise directions, respectively. Periodic boundary conditions are adopted in both the streamwise and spanwise directions for microbubbles and liquid flow, while the no-slip condition is exerted on the right and left walls for liquid. Our calculations are developed for a friction Reynolds number Reτ = 150, which is based on wall friction velocity (uτ) and half the channel height (h). When the statistically steady turbulence of liquid is reached, a set of microbubbles are injected into the designative layer. Initial velocities of microbubbles are set to be zero. The related computational parameters, along with the numerical resolution for the present investigation, are listed in Table 1. In order to investigate the liquid turbulence modulation by microbubbles in different turbulence layers, three typical cases are designed. Each case has the approximately same number of microbubbles. The only difference is that microbubbles are located in different turbulence layers for different cases. The detailed description of each case is presented in Table 2 and Figure 2.
Computational parameters.

Computational cases.


Flow geometry and coordinate system.

Microbubble distribution in the wall-normal direction.
2.2. Governing Equations
Seeing that nondimensional variables have the universal significance, governing equations are normalized in the computation. The nondimensional expressions of velocity, length, pressure, time, and interphase force are defined as follows, respectively:

Thus, units of length and time based on “wall units” are ν/uτ and ν/uτ2, where ν and uτ denote kinematic viscosity and fiction velocity of the bubble-free liquid flow. Note that the pressure field is decomposed into two parts: fluctuating pressure p+ * and average one-x* which drive the mean flow. Here, f i * is the feedback force per unit mass, and the detailed computation of f i * can be referred to the literature [16].
Dimensionless continuity and momentum equations for the liquid phase can be written as follows, respectively:
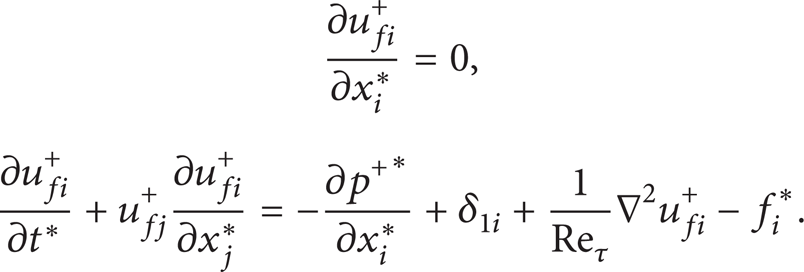
Dimensionless motion equation of microbubbles can be given as

where uf is liquid velocity, ub is microbubble velocity, and ε is sign of permutation. Subscripts of b, f, i (j,k) denote bubble phase, liquid phase, and number indexes of grid points, respectively. The superscript “+” denotes magnitudes normalized by uτ or ρ f uτ2, and the superscript “*” shows the ones normalized by h, h/uτ or uτ2/h.
In (3), the left-hand term denotes the inertia force, and the right-hand ones are the pressure gradient force, the drag force, the virtual mass force, the shear lift, and the gravity force (including buoyance), respectively. C
D
is the drag coefficient, C
v
is the added mass coefficient (for the spherical bubbles, C
v
= 0.5), C
LF
is the lift coefficient, and Fr is the Froude number (

The lift coefficient is given by Legendre and Magnaudet [21] and is presented as follows:

where

where Sr
b
, Re
b
are nondimensional shear rate and bubble Reynolds number, which are defined as
2.3. Numerical Procedure
A finite difference scheme is used to discretize governing equations. A second-order central difference scheme is used to discretize the spatial discretization. For time integration, the Adams-Bashforth scheme is used for all terms except that the implicit method is used for the pressure term. The velocity-pressure coupling is realized with the MAC method. A staggered grid system is used to prevent a checkboard pressure field, resulting in the fact that velocity components are stored at grid cell interfaces, and other variables (such as pressure) are stored at grid cell centers. The pressure Poisson equation is solved with the multigrid method. To calculate interphase forces related to the relative velocity between microbubbles and local liquid, a three-dimensional 8-node combined with a two-dimensional 4-node interpolation polynomials is applied to compute liquid velocity at the microbubble position (near the wall, the interpolation scheme switches to one-sided). Uniform grids are used in the streamwise and spanwise directions, and nonuniform grids are used in the wall-normal direction with the denser mesh closer to the wall to resolve small-scale eddies. The grid system for the present studies is absolutely the same as that adopted by Yu and Kawaguchi [22]. Microbubble velocities and displacements are calculated by integral equation of acceleration with the second-order Crank-Nicholson method, respectively.
3. Results and Discussion
To understand how the liquid turbulence is modulated by microbubbles in different turbulence layers, the first-order and second-order statistics of liquid turbulence are analyzed in detail and are presented as follows. Firstly, the mean streamwise velocity profiles of liquid are shown in Figure 3(a). To clearly display the mean velocity distribution in the subviscous and buffer layers, a partial enlarged detail of the mean velocity is presented in Figure 3(b). As shown in Figure 3, the mean streamwise velocities of liquid are, to a different degree, modified for different cases due to the microbubble injection. The mean streamwise velocity of liquid increases in comparison with one of the single liquid phases for Case 2 when microbubbles are located in the buffer layer. However, the mean streamwise velocity of liquid decreases compared with one of the single liquid phases for Cases 1 and 3 when microbubbles are located in the subviscous and outer layers, respectively. One can also see from Figure 3 that the influence of microbubbles on the liquid velocity is more complicated for Case 3 than for Case 1. For Case 1 the mean velocity of liquid decreases in the whole channel width, whereas for Case 3 it decreases only in the subviscous and buffer layers. Perhaps, because of the “pull effect” of microbubbles, the mean velocity of liquid almost keeps unchanged in the outer layer for Case 3.

Mean streamwise velocity profiles of liquid.
Figure 4 shows comparisons of the bulk mean velocity for different cases. One can see from Figure 4 that the bulk mean velocity of liquid increases in comparison with one of the single liquid phases only when microbubbles are located in the buffer layer, whereas it decreases when microbubbles are in the subviscous and outer layers. Those phenomena fully show that the liquid turbulence modulation by microbubbles is related to the microbubble location. As a matter of fact, on the premise that the pressure drop driving the mean flow keeps unchanged, the increase of the bulk mean velocity of liquid corresponds to the decrease of the turbulence frictional drag. The present analyses show that the drag reduction does occur only when microbubbles are located in the buffer layer (i.e., for Case 2) for the present investigation. The present conclusion is in full agreement with that proposed by Ortiz-Villafuerte and Hassan [8].

Bulk mean velocity comparisons for different cases.
It can be seen from the abovementioned analyses that the modulation of microbubbles on the mean streamwise velocity is very complicated, and it is tightly related to the microbubble position. In order to understand complicated physical mechanisms, the modulation of microbubbles on the second-order statistics of turbulence is further analyzed subsequently. Figure 5 shows the influence of microbubbles on the liquid-phase turbulence intensity, and it shows clearly that the liquid-phase turbulence is intensified (i.e., three components of the turbulence intensity increase) for Case 3 when microbubbles are only located in the outer layer, whereas the liquid-phase turbulence is weakened for Cases 1 and 2 when microbubbles are located in the subviscous and buffer layers, respectively. For Case 1 that microbubbles are located in the subviscous layer; microbubbles accumulating near the channel walls may prevent the spanwise vortex from developing and propagating toward the channel central region, which leads to suppression of the streamwise vortex, as pointed out by Kanai and Miyata [10]. It is undeniable that the turbulence vortex inhibition is bound to cause decreases of the turbulence intensity. For Case 2, the dynamic interaction of microbubbles with turbulence vortexes in the buffer layer may cause the turbulence vortex inhibition, which causes inhibition of the turbulence intensity. For Case 3, microbubbles in the outer layer may promote the spanwise vortex near the wall developing toward the channel central region due to the pull effect of microbubbles, therefore causing the turbulence enhancement corresponding to increases of turbulence intensity components in three directions.

Turbulent intensity profiles of liquid.
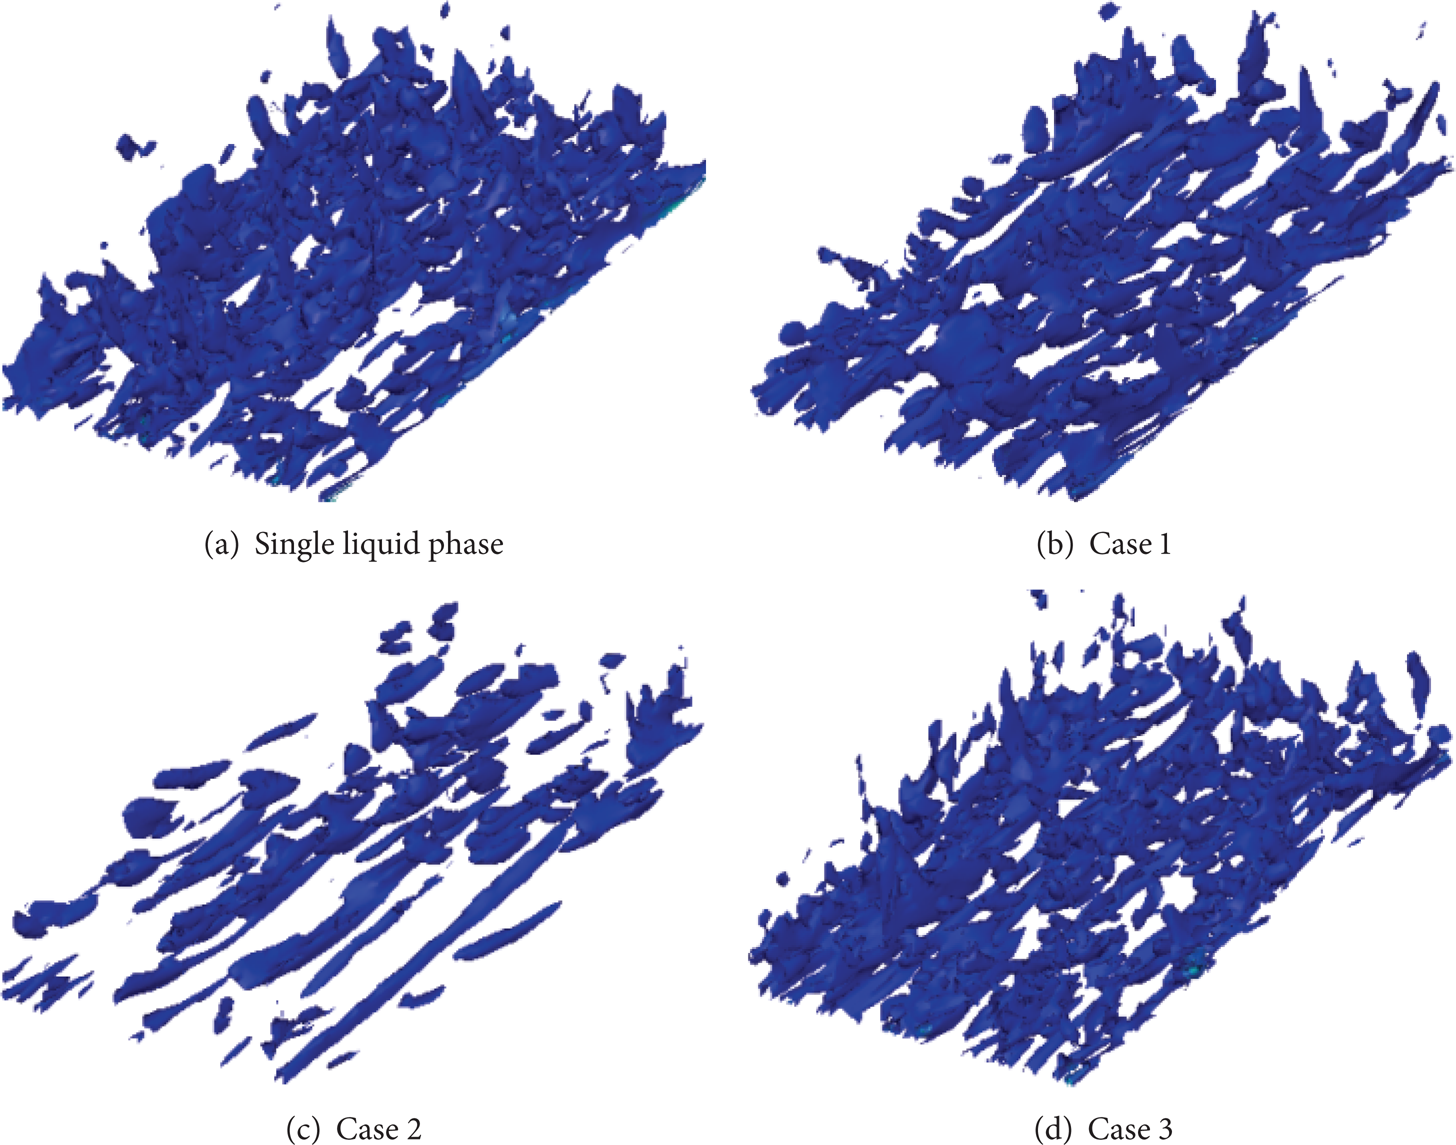
The streamwise vorticity fluctuation intensity profiles of liquid are presented in Figure 6. It shows that the modulation of microbubbles on the streamwise vorticity fluctuation intensity is similar to that of the turbulence intensity. For Cases 1 and 2 when microbubbles are located in the subviscous and buffer layers, respectively, the streamwise vorticity fluctuation intensity reduces due to the microbubble injection, and the reduction is sharper for Case 1 than that for Case 2. However, the streamwise vorticity fluctuation intensity increases for Case 3 when microbubbles are located in the outer layer. Figure 7 displays the transient distribution of the liquid-phase streamwise vorticity with −0.1 and 0.1 values, and Figure 8 shows the contour distribution of the liquid-phase vorticity magnitude. One can see from Figures 7 and 8 that both the instantaneous streamwise vorticity and the vorticity magnitude of liquid are suppressed due to the microbubble injection for Cases 1 and 2 when microbubbles are located in the subviscous and the buffer layer, and the suppression is much sharper for Case 2 than that for Case 1. However, for Case 3 when microbubbles are located in the outer layer, the microbubble injection seems to have a great influence on the scale and number of the streamwise and the vorticity magnitude, and the vortex scale seems to decrease but the vortex number seems to increase due to the microbubble injection, which corresponds to the fact that the streamwise vorticity fluctuation intensity increases. Those physical phenomena further confirm the above inferences; namely, the modulation of microbubbles on the liquid turbulence intensity is associated with that of the turbulence vortex.

Streamwise vorticity fluctuation intensity profiles of liquid.

Iso-surfaces of the liquid streamwise vorticity corresponding to −0.1 and 0.1 values.
Contour distribution of liquid vorticity magnitude.
Figure 9 shows Reynolds shear stress profiles of the liquid phase. One can see from Figure 9 that the Reynolds shear stress of liquid is greatly changed due to the microbubble injection. Similarly, the Reynolds shear stress decreases in comparison with one of the single liquid phases for Cases 1 and 2 when microbubbles are distributed in the subviscous and buffer layers, and it increases compared with one of the single liquid phases for Case 3 when microbubbles are distributed in the outer layer. And the Reynolds stress shows a nonlinear distribution in the channel central region with microbubbles for Case 3 because the influence of microbubbles on the liquid turbulence field in the channel central region cannot spread well toward the inner region. In order to ascertain the changed reason of the Reynolds shear stress, the quadrant analysis on the liquid Reynolds shear stress is carried out. Figure 10 shows the fractional contribution of the Reynolds shear stress from different quadrant motions. It can be seen from Figure 10 that for Cases 1 and 2 the microbubble injection has the sharper inhibition on the second (Q2) and the fourth quadrant (Q4) motions than on the first (Q1) and the third quadrant (Q3) motions. As is well known, the second (Q2) and the fourth quadrant (Q4) motions denote the ejection and sweep motion of turbulence. That means that for Cases 1 and 2 the reduction of the Reynolds shear stress is related to the inhibition of turbulent burst events. However, for Case 3 the microbubble injection has a great influence on four quadrant motions, which shows that the increase of the Reynolds shear stress is related to the enhancement of all turbulent motion events for Case 3.
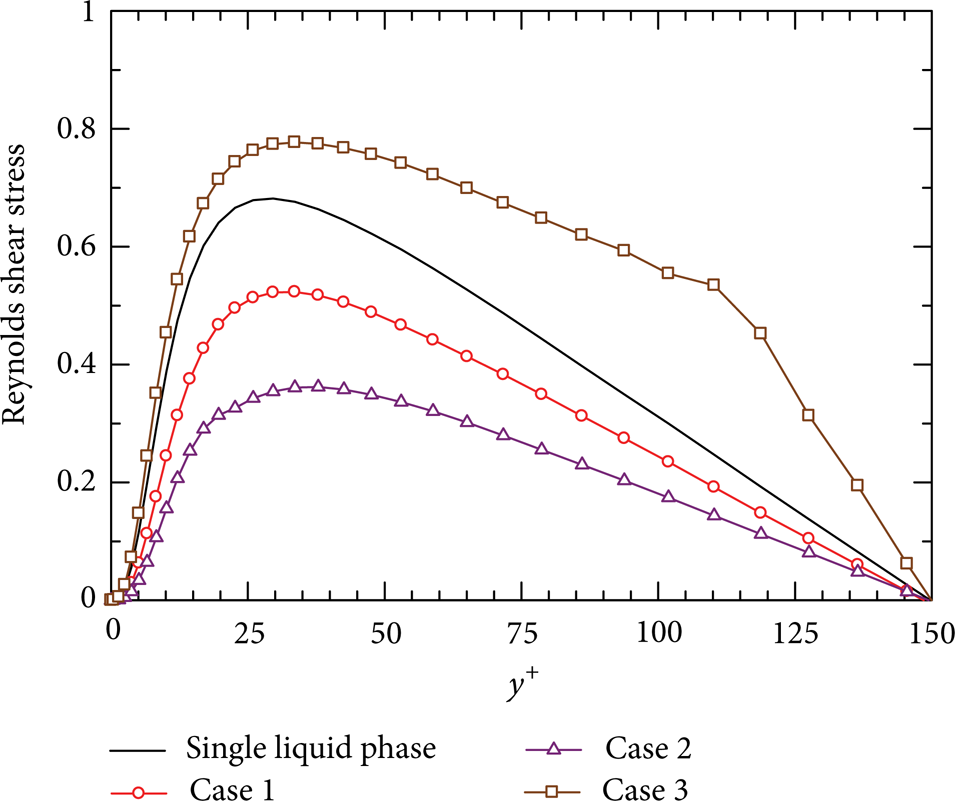
Reynolds shear stress profiles of liquid.

Quadrant analyses of Reynolds shear stress.
To vividly exhibit the influence of microbubbles on the bursting events of turbulence, Figure 11 presents the instantaneous velocity vector distribution at the y-z plane, set against the streamwise velocity contour. It shows clearly that for Cases 1 and 2 the bursting events (i.e., the ejection and sweep motions) near the wall become weak in comparison with one of the single liquid phases; namely, the vortex area reduces compared with one of the single liquid phases for both of them. However, for Case 3 the bursting event strength seems to reduce but the number of it seems to increase in comparison with the single liquid phase. The present analyses further verify that the modulation of microbubbles on the liquid Reynolds shear stress is related to the bursting events modification by microbubbles, as shown in Figure 10.

Instantaneous velocity vector and streamwise velocity contour distributions at a y-z plane.
Finally, it has to be pointed out that the liquid turbulence suppression (corresponding to decreases of the turbulence intensity and the Reynolds shear stress) means the decrease of energy consumed by liquid velocity fluctuations. Conversely, the liquid turbulence enhancement denotes the increase of energy consumed by the liquid velocity fluctuations. For the present investigation, the liquid turbulence is simultaneously suppressed for Cases 1 and 2 but the liquid velocity increases only for Case 2, and the liquid velocity decreases more sharply for Case 1 corresponding to the turbulence suppression than for Case 3 corresponding to the turbulence enhancement. Those phenomena show that the influence of microbubbles on the liquid velocity is quite complicated. Perhaps, the turbulence suppression is one of reasons why the mean velocity of liquid increases for Case 2. The saved energy from the turbulence suppression is either used to raise the liquid velocity or is consumed by other factors such as interphase friction between microbubbles and liquid.
In our eyes, there are at least three factors influencing the liquid velocity, such as the turbulence suppression or enhancement, the pull effect of microbubbles by buoyance, and the interphase friction between microbubble and liquid phases. Among those factors, the turbulence suppression and the pull effect of microbubbles have a positive influence on the liquid velocity; namely, they will increase the liquid velocity. However, the turbulence enhancement and the interphase friction have a passive influence on the liquid velocity; namely, they will reduce the liquid velocity. For Case 1, the liquid turbulence is suppressed but the liquid velocity decreases. That means that the interphase friction plays a main role in changing the liquid velocity in the subviscous layer. For Case 3, the liquid turbulence is enhanced but the liquid velocity decreases much less than that for Case 1 corresponding to the turbulence suppression. That indicates that the pull effect of microbubbles has a dominant influence on the liquid velocity in the outer layer. Additionally, the liquid turbulence is simultaneously suppressed for Cases 1 and 2 but the liquid velocity is increased only for Case 2, and it implies that the turbulence suppression has a direct influence on the liquid velocity in the buffer layer.
In short, the liquid turbulence suppression does not always lead to the drag reduction occurrence for the bubbly flow laden with microbubbles, and the drag reduction occurrence may be directly related to dynamic interaction of microbubbles with turbulent events in the buffer layer. It can be seen from the present investigation that the drag reduction occurs only when microbubbles are distributed in the buffer layer. Therefore, some appropriate measures should be taken to produce microbubbles in the buffer layer when designing a drag reduction system by microbubbles. For example, when microbubbles are produced by an electrolytic method, the electrode should be fixed in the buffer layer as far as possible.
4. Conclusions
Through investigating the liquid turbulence modulation by microbubbles in different turbulent layers with the developed numerical model, some important conclusions are summarized as follows.
The modulation of microbubbles on the liquid turbulence is related to the microbubble position; the liquid turbulence is enhanced when microbubbles are located in the turbulence outer layer, whereas it is inhibited when microbubbles are located in the subviscous and buffer layers.
The liquid turbulence suppression does not always cause occurrence of drag reduction for the bubbly flow laden with microbubbles. Conversely, the drag reduction occurrence does correspond to the liquid turbulence inhibition.
The dynamic interaction of microbubbles with the turbulence in the buffer layer has the greatest contribution to the drag reduction occurrence by microbubbles.
Conflict of Interests
The authors declare that there is no conflict of interests regarding the publication of this paper.
Footnotes
Acknowledgment
The authors gratefully acknowledge the financial support from the NSFC Funds (nos. 51376026, 51225601, and 51325603).