
Abstract
Energy efficiency is one of the major issues in wireless sensor networks (WSNs) and their applications. Distributed techniques with low message and time complexities are expected in WSNs. Connected dominating sets (CDSs) have been widely used for virtual backbone construction in WSNs to control topology, facilitate routing, and extend network lifetime. Most of the existing CDS approaches suffer from a very poor approximation ratio, high time, and message complexities. This paper proposes two novel approaches for CDS distributed construction in WSNs. The proposed approaches are intended to construct a small CDS as well as allowing energy-efficient CDS construction and maintenance in WSNs. Simulation shows that our distributed approaches have an approximation factor of 7.5 to the optimal CDS. This approximation outperforms the existing distributed CDS construction algorithms.
1. Introduction
A wireless sensor network (WSN) is a wireless network that consists of thousands of very small stations called sensor nodes. The main function of sensor nodes is to monitor, record, and notify a specific condition at various locations to other stations and end users. WSNs are increasingly attractive as a means to provide more advanced, intelligent, and context-aware systems with implicit user interaction. They have a wide range of application areas such as geophysical monitoring, precision agriculture, habitat monitoring, transportation, health, military systems, and business processes [1, 2].
WSNs pose their unique challenges due to the lack of a central entity for organization, the sensors’ limitation, and mobility of the participants, as well as the limited range of wireless communications. Furthermore, in most of their applications, sensors are flexibly and quickly deployed with minimal effort, eliminating the need for physical backbone infrastructure [1, 2]. As each sensor node is tightly power constrained and one-off, the lifetime of a WSN is limited. In order to prolong the network lifetime, energy-efficient protocols should be designed for the characteristic of WSNs [2, 3]. An important research problem in wireless-sensing networking is to find a small set of nodes that can collaborate to form a self-organizing network to substitute for the absence of infrastructure and central control. This virtual backbone plays a significant role in enhancing the network efficiency, extending its lifetime, and supporting routing processes as well as all other network tasks and applications.
Connected dominating sets (CDSs) have been widely used for constructing virtual backbone in wireless networks. Using CDS, routing will be restricted to the reduced graph formed by the CDS. Every node in a CDS, called dominator, is considered as a gateway, and only a gateway needs to keep routing information. Other nodes, called dominatees, need not keep any routing information. Moreover, any dominatee can switch to sleep mode for energy saving without causing network partition. In such a scenario, valuable resources—for example, transmission energy, nodes’ memory and computation time, and bandwidth—are saved [1, 2].
The minimum connected dominating set (MCDS) problem is to find a connected dominating set with the smallest possible cardinality among all connected dominating sets on a graph G. The MCDS problem is defined as follows. For a given connected graph (network)
In the context of CDS construction, the approximation ratio of an algorithm A is defined as the largest (worst) ratio between the size of the obtained CDS using algorithm A and the optimal result that can be obtained by MCDS (
Centralized approaches usually achieve better performance than distributed approaches, but they utilize the global information of the network, so they are energy consuming and hard to be realized in the practical applications. On the contrary, distributed approaches can be realized by sensors with low complexity and have become a hot topic. Additionally, WSNs are usually exposed to challenging and dynamic environments. Therefore, it is possible for connectivity loss of individual nodes to occur. In these situations, the conventional centralized algorithms that need to operate with global knowledge of the whole network will potentially experience a serious protocol failure as a result of transmission errors or a failure of a critical node [3].
In this paper, we propose a distributed energy-efficient algorithm for CDS construction in wireless sensor networks. The algorithm extends the state-of-the-art centralized algorithm, proposed in [4, 5], in that it implements the exact-three-hop property in the distributed environment. Moreover, the algorithm employs a new raking function that is carefully implemented to ensure that the constructed CDS is really connected. The introduced ranking function is intended to provide energy awareness. It attempts to prolong the lifetime of the constructed CDS by allowing nodes with higher residual energy to be more likely part of the constructed backbone. In addition, the paper proposes a nonspanning tree based CDS construction approach (approach II).
The rest of this paper is organized as follows. Next section discusses the related work. Section 3 presents the detailed design of the proposed approaches. Section 4 provides the performance discussion and simulation results. In Section 5, we conclude our findings.
2. Related Work
Various techniques were developed in the literature for CDS construction with different performance ratios and design perspectives. CDS construction methods are evaluated according to many factors. Some of these factors characterize the constructed CDS, including size, diameter, and approximation factor. Other criteria, including algorithm complexity, communication overhead, and information range, are related to the construction algorithm [2].
Generally speaking CDS construction algorithms are usually classified into centralized [4–9] and distributed algorithms [10–18]. For any CDS algorithm, the size of the constructed CDS is usually considered the most important performance factor. For distributed CDS construction algorithms, it is difficult to achieve a small approximation factor compared to the centralized methods. Distributed algorithms pay more attention for other metrics such as message complexity and information range. The message complexity metric refers to the number of exchanged messages between nodes during the CDS construction in the worst-case scenario. Information range shows the amount of neighborhood information that should be collected by a node to perform the CDS construction task. It is usually measured in number of hops. Information range has an influence on algorithm and message complexities. A good distributed algorithm is the one that has low message complexity and requires the least neighboring information to construct the CDS [2]. Table 1 shows the approximation factors of the state-of-the-art CDS construction algorithms.
The state-of-the-art CDS construction algorithms and their approximation factor.

In most of the CDS construction algorithms, a coloring mechanism is used for the purpose of illustration. All nodes are initially white, then dominators are colored black and dominatees are colored gray. A centralized algorithm, called S-MIS, was presented in [6]. The algorithm is greedy. It constructs a small CDS based on the classical MIS model. MIS-based algorithms are two-phase based realization algorithms. They construct the MIS at first and then find some optimal nodes to connect the MIS nodes together in order to obtain the final CDS. In this algorithm, MIS is first constructed and then a Steiner tree algorithm is employed to interconnect MIS nodes into CDS. The approximation factor achieved by S-MIS algorithm is (5.8 + ln 4) from the optimal solution. A novel centralized algorithm was proposed in [4, 5] for CDS construction in WSNs. The proposed algorithm is a four-phase-based realization algorithm with two different types of dominators and two different types of connectors. The algorithm introduces a new model for CDS construction based on the exact-three-hops property. In this model, a special independent set, called
Figure 1 shows a constructed CDS using the classical MIS model in (a) and using the special independent set model with exact-three-hop property in (b). In Figure 1(a), the black nodes are the MIS nodes forming the dominators in the constructed CDS, the intermediate blue nodes (the square nodes) are their connectors, and the other gray nodes are the dominatees or nonbackbone nodes. Figure 1(b), the black nodes all together form the primary dominators or
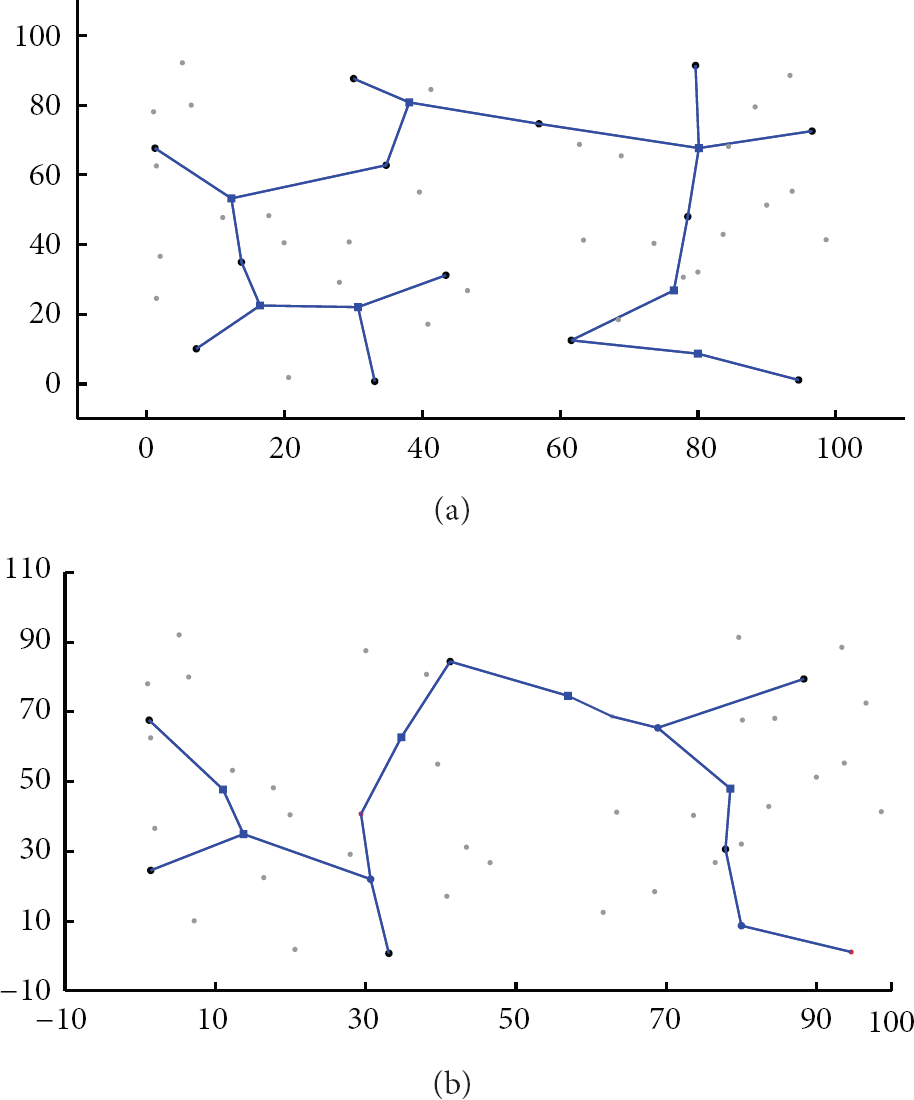
The classical MIS-based model with the exact-two-hop property versus the special independent set-based model with the exact-three-hop property. (a) The classical MIS-based model with the exact-two-hop property. (b) The special independent set-based model with the exact-three-hop property.
For distributed techniques, the first distributed algorithm guaranteeing a constant approximation factor was proposed in [11]. Their algorithm has an approximation factor of 8,
In this paper, we propose two distributed approximation approaches for CDS construction in WSNs. The proposed approaches extend the exact-three-hop model to the distributed setting. Our algorithms are intended to provide a small approximation factor when compared to their presented centralized version in [4, 5], lower construction cost (in terms of message and time complexities), and allow efficient backbone maintenance after encountering topology changes. We provide the required performance discussion and experimental results that show the effectiveness of our proposed approaches and compare them to their centralized version.
3. Modeling and Methods
In a distributed environment, the execution of algorithms is event driven. Hence, the construction process of CDS is different from its centralized version in that it overlaps the construction phases. Based on the exchanged messages with its neighbors, a node is preprogrammed to change its state (color) or trigger an event if a specific condition is satisfied. For illustrative purposes, we employ a coloring scheme to differentiate node states during the construction process. The nodes of
a black list: to store the IDs of its 1-, 2-, and 3-hop black neighbors, as well as their corresponding graph distance to the node i,
a red list: to store the IDs of its 1-hop red neighbors,
a region list: to store the region ID of its 1-hop neighbors.
The described algorithm in the next subsection, approach I, is a distributed algorithm for CDS construction that implements the exact-three-hop property. Approach I is based on a spanning tree. Section 3.2 describes the distributed approach II, which is a nonspanning tree based CDS construction method with energy awareness.
3.1. Approach I: Distributed Algorithm for CDS Construction
The scenario of CDS construction is described as follows: given an arbitrary rooted spanning tree T, we define the tree level of a node u as the number of hops in T between u itself and i, where i is the root of T. All nodes are initially undominated and are colored white. The region ID of each node is set to its own ID. Nodes will be eventually marked with different colors during the execution of the algorithm, and their region IDs might be changed.
The presented state diagram in Figure 2 shows the employed coloring mechanism to construct a CDS using approach I. First, the root node (i) initiates the CDS construction by coloring itself black. Then, the black node i broadcasts a “BLACK” message that includes its ID and the counter value
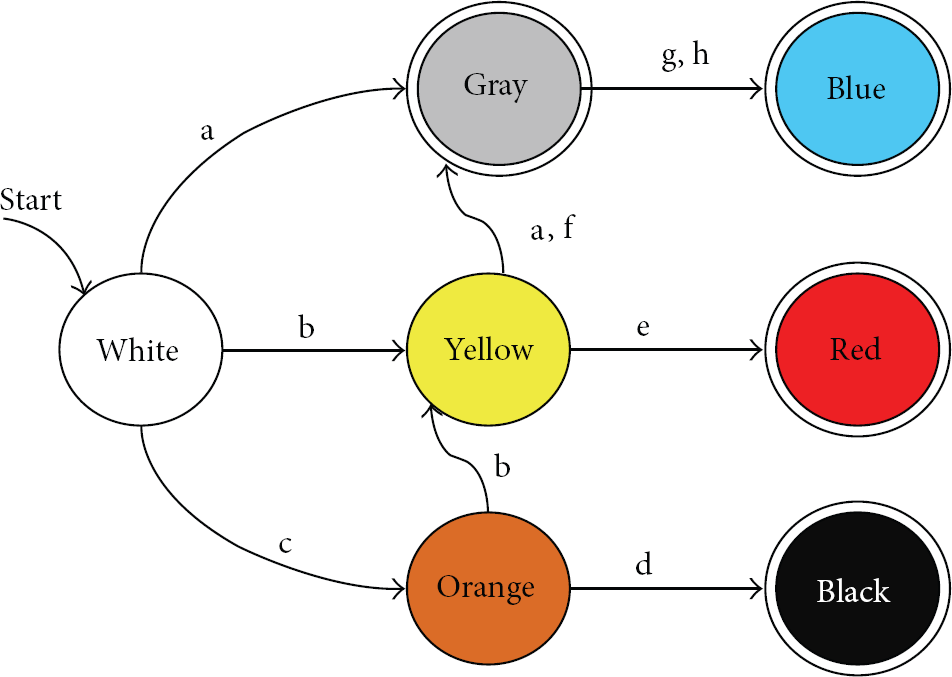
The state diagram for the color changes within the execution of approach I.
3.1.1. Event: Orange Bidding
Orange bidding is done by orange nodes and handled (evaluated and acknowledged) by their 1-hop yellow neighbors. The wining orange node is colored black. After it is colored orange, each orange node announces its bidding by broadcasting an orange bidding message that includes orange node ID, level, and the number of its 3-hop black neighbors. Then, it waits for the acknowledgment from all of its yellow neighbors. Upon receiving an orange bidding from an orange node by one of its neighboring yellow nodes, the receiving yellow node checks the received bidding from all of its 1-hop orange neighbors and selects the orange node that has the lowest level and/or maximum number of black neighbors, and then it acknowledges the winning orange node by broadcasting an ACK message with the winning node ID. Upon receiving ACK messages from all its yellow neighbors, an orange node colors itself black and broadcasts a “BLACK” message with its ID and
3.1.2. Event: Yellow Bidding
Yellow bidding is done and handled by yellow nodes. The wining yellow node is colored red. Each yellow node that has no orange/white neighbors announces its bidding by broadcasting a yellow bidding message. The yellow bidding message includes its ID and the number of its 1-hop yellow neighbors (called coverage factor). Then it waits for the acknowledgment from all of its 1-hop yellow neighbors. A yellow node that has no yellow/orange/white neighbors will color itself red without bidding. Upon receiving a yellow bidding message by a yellow neighbor, it evaluates and acknowledges the highest bidding (the yellow node that has the highest coverage factor) by broadcasting an ACK message with the winning node ID. Upon receiving ACK messages from all its 1-hop yellow neighbors, a yellow node colors itself red and broadcasts a “RED” message. Upon receiving the “RED” message by a yellow node, it colors itself gray and broadcasts an “YGRAY” message for its 1-hop neighbors. Upon receiving an “YGRAY” message, a yellow node recalculates and announces its new yellow bidding. The “YGRAY” message is very important for the execution of this algorithm in the distributed environment. It notifies yellow neighbors to (i) recalculate their bidding and (ii) to reevaluate and confirm the previously received bidding as required.
3.1.3. Event: Selecting Red Connectors
The distributed logic yields red nodes having the same geometrical properties of the red node in the centralized algorithm: each red node has at least one black node that is only two hops away. Therefore, we need to include at most one gray node to connect each red node to its nearest black node. After a node is colored red, it selects a connector of its 1-hop gray neighbors based on number of their 1-hop backbone nodes. As a result, the wining gray node is colored blue and its 1-hop backbone nodes (black, red, and blue) are merged into one region. If a red node already has a blue node within its 1-hop neighbors, it does not need to introduce a new connector. Instead, it links itself to that existing connector by sending a request-to-connect message and changes its region ID accordingly.
3.1.4. Event: Changing the Region ID
In this implementation, all nodes with the same region ID form a connected component. When a node changes its region ID, it notifies its 1-hop neighbors for this update by sending a region-change message. Upon receiving a region-change message by a region member (a backbone node that belongs to that region), it changes its region ID and broadcasts a region-change message for its 1-hop neighbors.
3.1.5. Event: Gray Bidding
Gray bidding is done by gray nodes and handled by their gray, blue, black, and red neighbors. As a result, the wining gray nodes are colored blue and their 1-hop backbone nodes (black, red, and blue) are merged into one region. Each gray node that has no yellow/orange neighbors and has more than one nearby region announces its gray bidding by broadcasting a gray bidding message that includes its ID, its dominator color and region ID, count, and a list of its 1-hop different regions. Upon receiving a gray bidding message by a backbone node (blue, red, and black), it decides if it needs to connect to the reported regions by comparing its current region ID with the received region list. If different regions are going to be merged through this gray node, the receiving backbone node sends an ACK message to the bidding gray node in order to color it blue. As a result, the acknowledged gray node colors itself blue, calculates the new region ID, and announces it by broadcasting a “BLUE” message, to its 1-hop backbone nodes in order to merge them all into one region. Upon receiving a gray bidding message by a neighboring gray node, it checks whether or not their dominators are black and have different region IDs. If yes, the receiving gray node sends an ACK message to the bidding gray node. The biding gray nodes are evaluated by their neighboring backbone nodes based on their exchanges region list. Upon receiving an ACK message from a neighboring gray node, the receiving gray node colors itself blue, calculates the new region ID, and broadcasts a “BLUE” message with the new region ID. Upon receiving a “BLUE” message by a neighboring backbone node, a backbone node changes its region ID and broadcasts a region change message for its 1-hop neighbors. Upon receiving a “BLUE” message by a neighboring gray node, it updates its region list. The final CDS is obtained after executing all the triggered events. At that time, all white, orange, and yellow nodes are colored black, red, blue, or gray. The union of the black, red, and blue sets forms the final CDS.
Figure 2 shows the state diagram for the color changes within the execution of approach I. The transition conditions are described as follows: (a) is receiving a “BLACK” message with
Figure 3 shows an exemplary graph for a network of 100 nodes, deployed in a 100 m × 100 m square field, after constructing a CDS using approach I. The transmission range of nodes is uniform and assumed to be 20 m. The black, red, and blue nodes with edges between them form the backbone. The other gray nodes are the dominatees. The gray nodes are dominated by their black or red neighbors. The blue nodes are used to connect the red and black nodes to form the final backbone.

An exemplary graph for a network of 100 nodes after constructing a CDS using approach I.
3.2. Approach II: Energy-Efficient CDS Construction
This section discusses the design of approach II, which is an improvement of approach I. The discussed approach in the previous sections (approach I) presents a distributed implementation of the presented centralized algorithm in [4, 5]. These algorithms rely on the construction of a rooted spanning tree, which makes it very costly in terms of communication overhead to maintain the CDS in the case of mobility and topology changes.
In order to eliminate the cost of calculating and maintaining the spanning tree and also to allow efficient maintenance to the constructed CDS, we simplify the ranking function by including the biding nodes’ ID instead of their level. Moreover, we attempt to prolong the lifetime of the constructed CDS by allowing nodes with higher residual energy for being more likely part of the constructed backbone.
In addition to employing a distributed logic to construct the CDS, the energy efficiency of approach II comes from three sources: (i) eliminating the need to construct and maintain a spanning tree in WSN which affects the time and message complexities of the algorithm (ii) allowing nodes with higher residual energy to be more likely part of the constructed backbone and (iii) allowing efficient maintenance of the backbone in the case of mobility and topology changes; for example, new sensors are introduced or connections to some backbone nodes are lost, as a result of mobility or energy dissipation. In similar scenarios, the improved algorithm does not require maintaining or recalculating the spanning tree to incorporate the encountered topological changes.
Considering approach I as our basic distributed approach, we summarize the following differences between constructing a CDS using approach I and approach II. For orange biding and evaluation, in approach II, orange bidding messages are changed to include orange node ID, residual energy value, and a number of its 3-hop black neighbors. Upon receiving an orange bidding message from an orange node by one of its neighboring yellow nodes, a yellow node checks the received bidding from all of its 1-hop orange neighbors, selects the orange node that has the maximum number of black neighbors, residual energy, and/or the lowest ID, and then it acknowledges the winning orange node by broadcasting an ACK message with the winning node ID.
For yellow biding and evaluation, yellow bidding messages are changed to include node ID, the value of its residual energy, and the number of its 1-hop yellow neighbors (called coverage factor). The yellow node that has the highest coverage factor and residual energy is selected and acknowledged by its yellow neighbors.
For gray biding and evaluation, the gray bidding messages are changed to include: node ID, its residual energy value, its dominator color and region ID, count and a list of its 1-hop different regions. The biding gray nodes are evaluated by their neighboring backbone nodes according to their region list and their residual energy value.
4. Results and Discussion
In this section, we discuss the performance of our proposed approaches and report simulation results. We first discuss the approximation factor and analyze the message and time complexities of our proposed approaches. Then, we describe the design of our simulation experiment, including environment setting, simulation input, deployment models, and energy model. Finally, we show simulation results, with each representing an average of 50 runs.
4.1. Performance Discussion
For the approximation factor of approach I, compared to the proposed centralized algorithm in [4, 5], the constructed
The information range shows the amount of neighborhood information that should be collected by a node to perform the CDS construction task. This factor has an influence on algorithm and message complexities. The information range of approaches I and II is three.
For time and message complexities, the construction of the spanning tree T depends on the employed algorithm. Spanning tree algorithms are expected to use linear messages and take either a linear or a linearithmic time. After a rooted spanning tree T is constructed, the construction of
To analyze the message complexity of our proposed approaches, we consider the different types of exchanged messages and their frequency in worst case scenario. For coloring announcements, some colors (black, red, and blue) are permanent colors and cannot be altered during the execution of the algorithm. Other colors (gray, yellow, and orange) are altered and need to be announced. Hence, during the execution of the algorithm, a node which experiences the different combinations of color changes will broadcast four coloring announcements at most.
For bidding announcements and evaluation, during the execution of approaches I and II, a yellow, orange, and gray node broadcasts its bidding in a single message which is confirmed by its yellow neighbors using one acknowledgment message. A bidding node x may need to rebid as a response to changes in the state of its neighbors. Assuming d is the maximum node's degree in the network (maximum number of nodes per unit of area), then a node x broadcasts d bidding messages at most. Accordingly, in worst case scenario, a node needs to broadcast: 4 color change announcements,
For time complexity, each node processes and responds once to
4.2. Simulation Setup
4.2.1. Simulation Variables and Setting
In order to compare the size of the generated CDS by the distributed approach (approach I) to the centralized approach that extends it [4, 5], we apply both approaches to the same network topology (the same input). Similarly, in order to study the impact of simplifying the ranking function, we applied approaches I and II to the generated networks. For each generated topology, we ran approaches I and II as well as their centralized version, in order to construct a CDS as well as to collect the total number of messages and the total energy dissipated.
For each reported simulation result, we generated 50 different network topologies. We investigated the performance of all algorithms with different input values for the number of nodes N, the transmission range R, and the deployment area A. We studied the performance with different input values for the numbers of nodes
We used UDG to model the network. Hence, the transmission range for all nodes is unified and equals R. We consider R values that keep the network connected. For the deployment area, the choice of different field sizes for the same input size allows the generation of relatively sparse (for larger squares) and dense (for smaller squares) graphs [17]. For a set of N nodes deployed in a field of area A, with each node having a transmission range R, we define a constant node density
4.2.2. Deployment Model
In our simulation, we mainly consider the uniform random deployment model [20]. For a given 2D square field of area A, we generate a total of N nodes. In a uniform random deployment, each of the N sensors has equal probability of being placed at any point inside the given deployment field. Consequently, the nodes are scattered onto locations that are not known with certainty. For example, such a deployment can result from throwing sensor nodes from an airplane. In general, a uniform random deployment is assumed to be both easy and cost-effective. Because random node deployment is expected in most WSN applications, we mainly included it to assess the performance of our algorithms [20].
4.2.3. Energy Model
In order to calculate the total dissipated energy by the distributed algorithm, we assigned the amount of energy dissipated by transmitter and receiver electronics to process a bit (

The dissipated energy to transmit (k bits) for a distance d is calculated as follows [3]:

We evaluated the lifetime of the constructed CDS, as a number of rounds, in a network that dissipates a total of
In addition to the conventional homogeneous energy model, we implemented a multilevel heterogeneous energy model for the underlying network [3]. In this model, the energy level that is assigned to each sensor is randomly distributed over the close set [
4.3. Simulation Results
Simulation shows that the implementation of our distributed approaches performs similarly and appropriately in constructing CDS for all network types and densities. It also shows that they satisfy the exact-three-hop property between each black node and its nearest black node. Moreover, red nodes are originally yellow nodes that are marked yellow using one of their 2-hop black neighbors (after receiving a “BLACK” message with
Figure 4(a) shows the average CDS size in approaches I and II and the centralized approach when the number of nodes N varies from 100 to 1000 nodes, the transmission range, and deployment area are fixed and equal to
The average performance and error margin of approaches I and II and the centralized approach when the number of nodes varies from 100 to 1000 nodes.
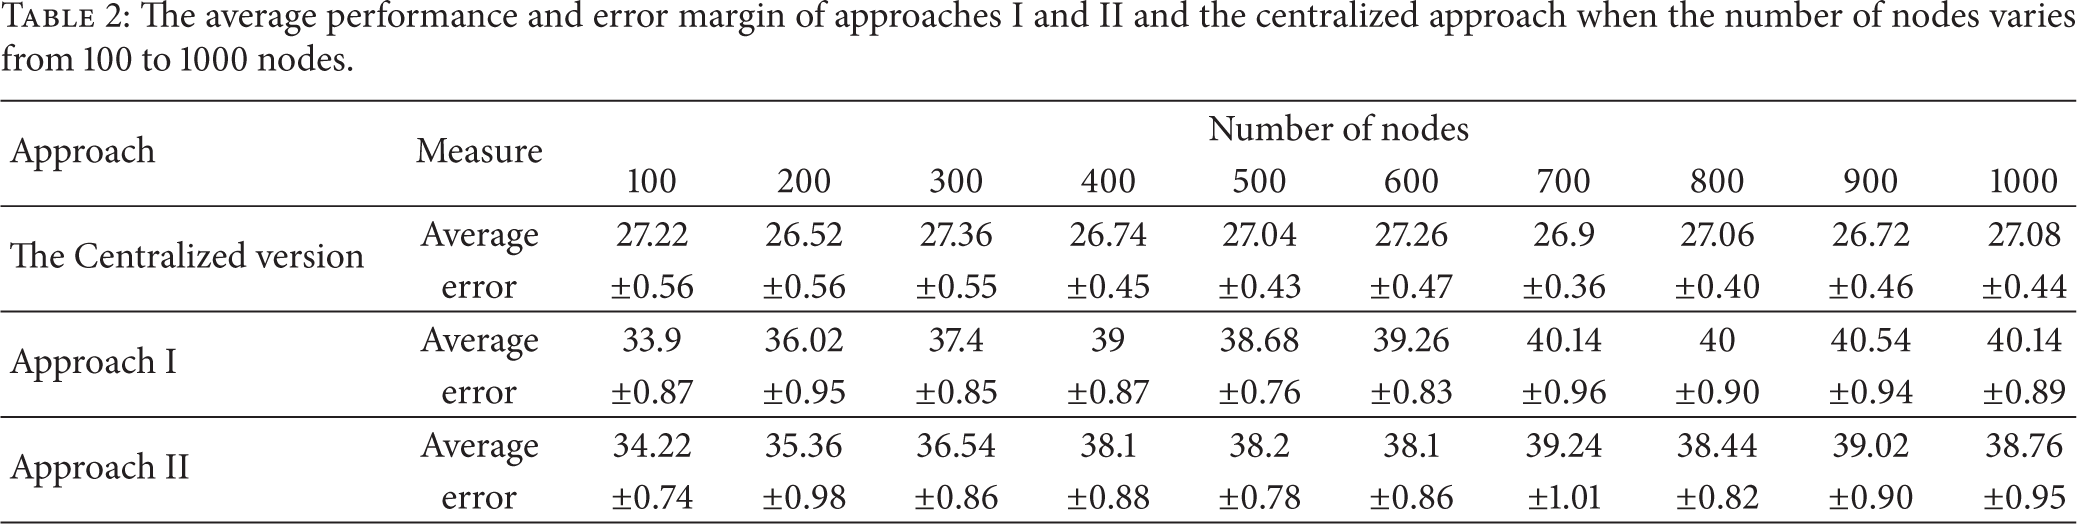
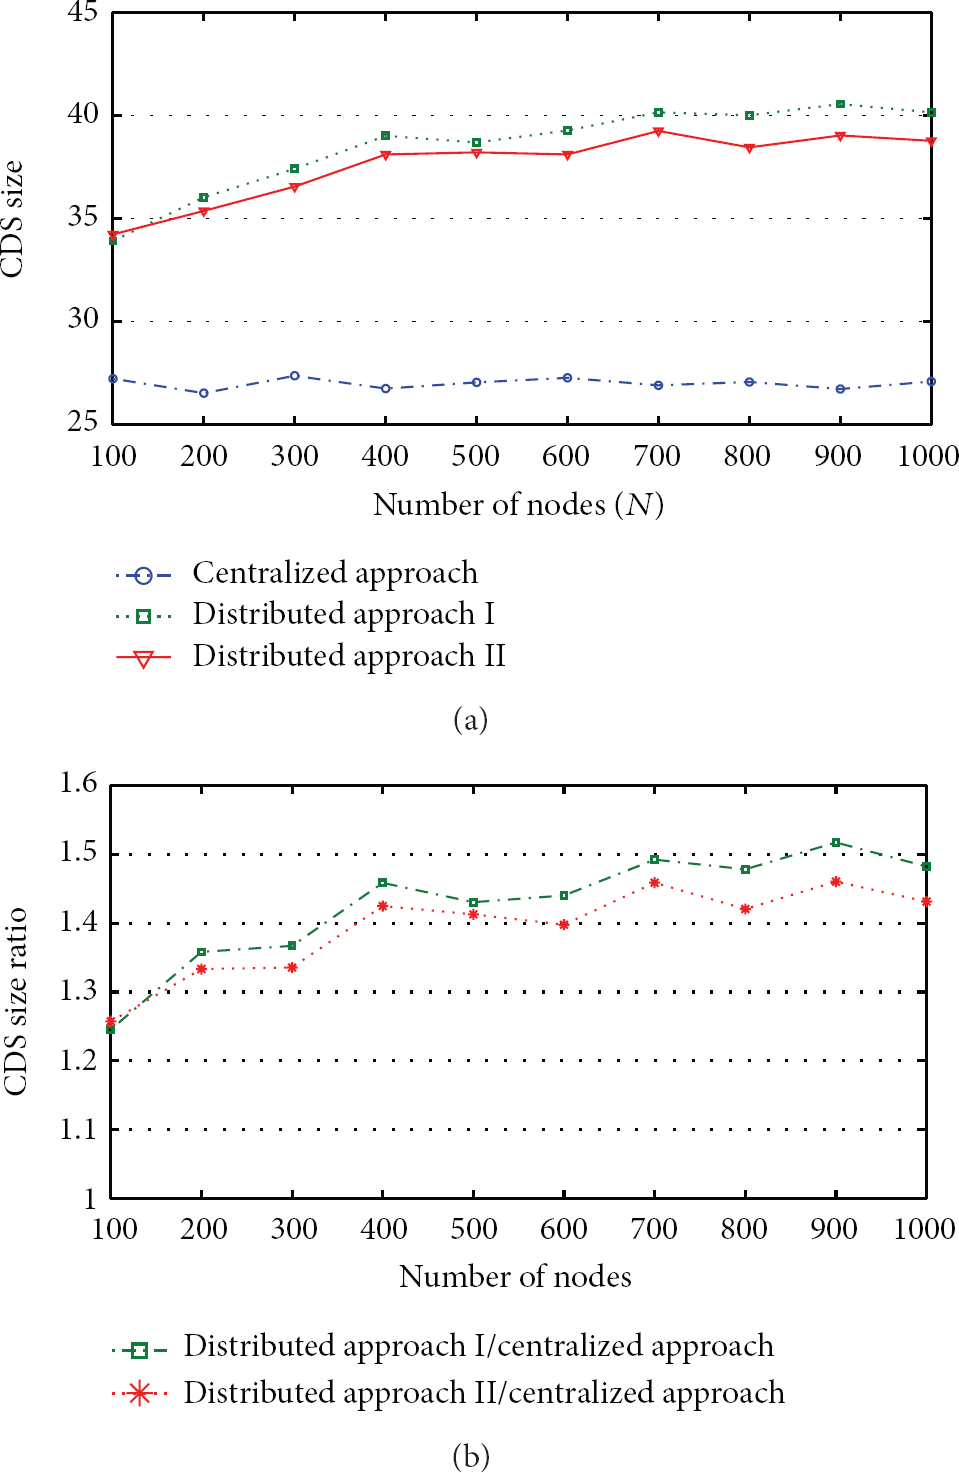
The average performance of approaches I and II versus the centralized approach when N varies from 100 to 1000 nodes. (a) Showing the average CDS size. (b) Showing the ratio.
Considering the energy efficiency and communication complexity of our distributed approaches I and II and the same simulation setting, Figure 5(a) shows the total dissipated energy in nanojoule (nJ) per number of nodes (the average energy dissipation per node). It is shown that energy consumption increases while the number of nodes increases due to the increase of nodes’ degrees. Energy consumption is proportional to the number of exchanged messages. Therefore, the increase in nodes’ degree increases the number of transferred/received control messages (color announcements, ACK, and bidding) by nodes. Each arrival/transmission of a message requires a certain amount of energy to be dissipated by the receiving/transmitting node. For message complexity, the corresponding average message complexity per number of nodes to above results is shown in Figure 5(b). The corresponding average node per unit of area (node degree) for the presented variation in number of nodes from 100 to 1000 is 12.5664, 25.1328, 37.6992, 50.2656, 62.8320, 75.3984, 87.9648, 100.5312, 113.0976, and 125.6640 nodes, respectively. Comparing the average number of transmitted messages per node to the average node degree in different setting, we identify that the average number of transmitted messages per node is bounded by the average node degree for the different variations of network setting. This comparison is based on the average number of exchanged messages by the algorithm and the average node degree. The average node degree is bounded by the number of nodes in the network (N). Therefore, our analysis for the message complexity of approach I as
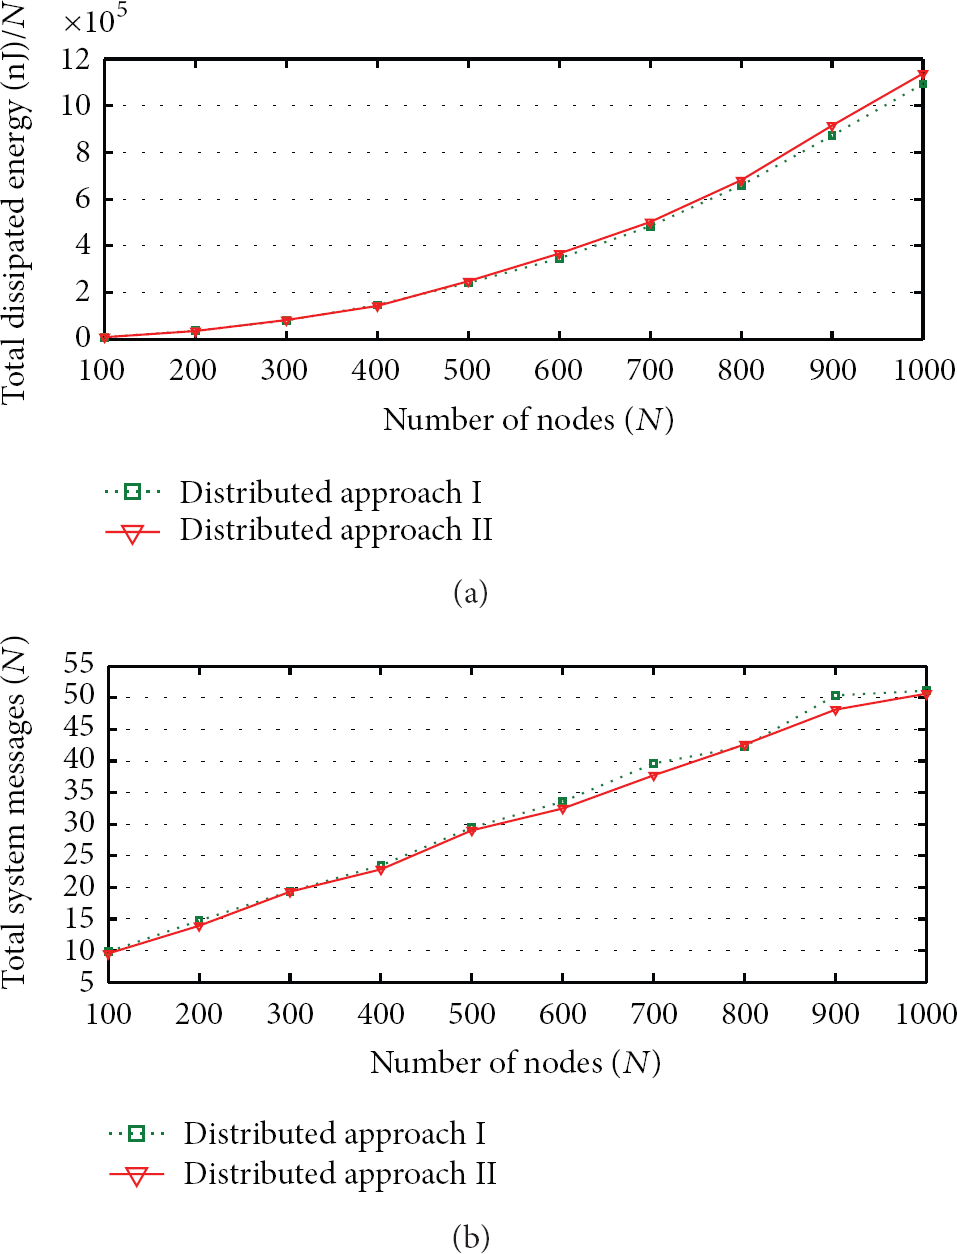
Energy efficiency and communication overhead of approaches I and II. (a) The average energy dissipation per node in (nJ). (b) The average number of transmitted messages per node.
For varying the transmission range, Figure 6 shows the impact of changing the transmission range R from 10 m to 50 m, when
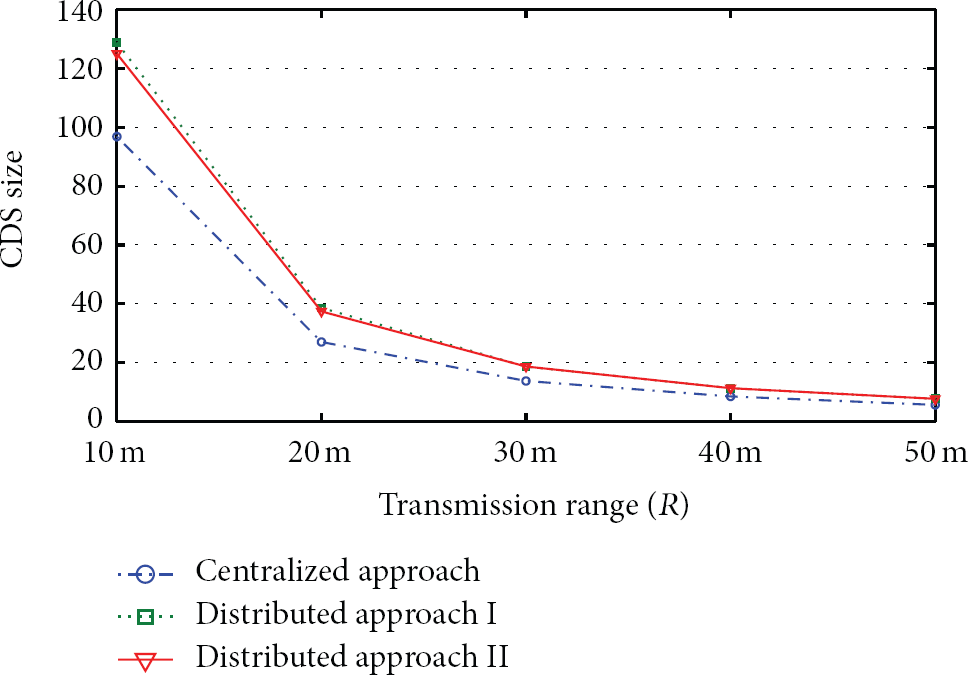
The average performance when the transmission range R changes from 10 m to 50 m.
For the deployment area, for
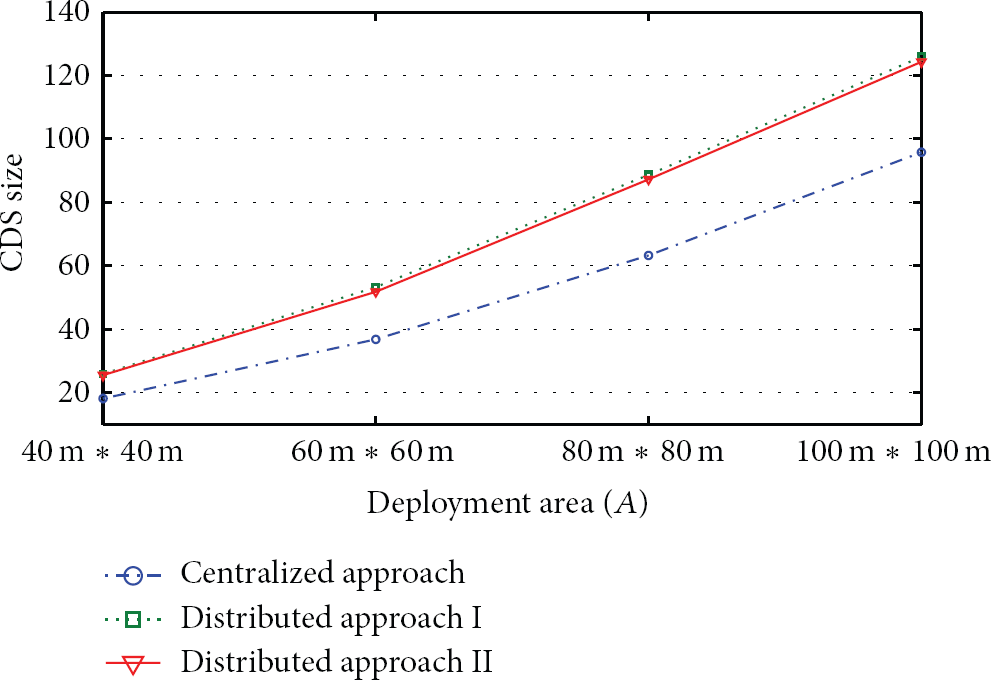
The average performance when the deployment area changes from 40 m × 40 m to 100 m × 100 m.
Considering approach II and the multilevel heterogeneous network, Figure 8 shows the estimated lifetime (in number of round): (a) when N varies between 200 and 1000 nodes, R = 10 m and A = 100 m × 100 m and (b) when R varies between 10 m and 50 m,
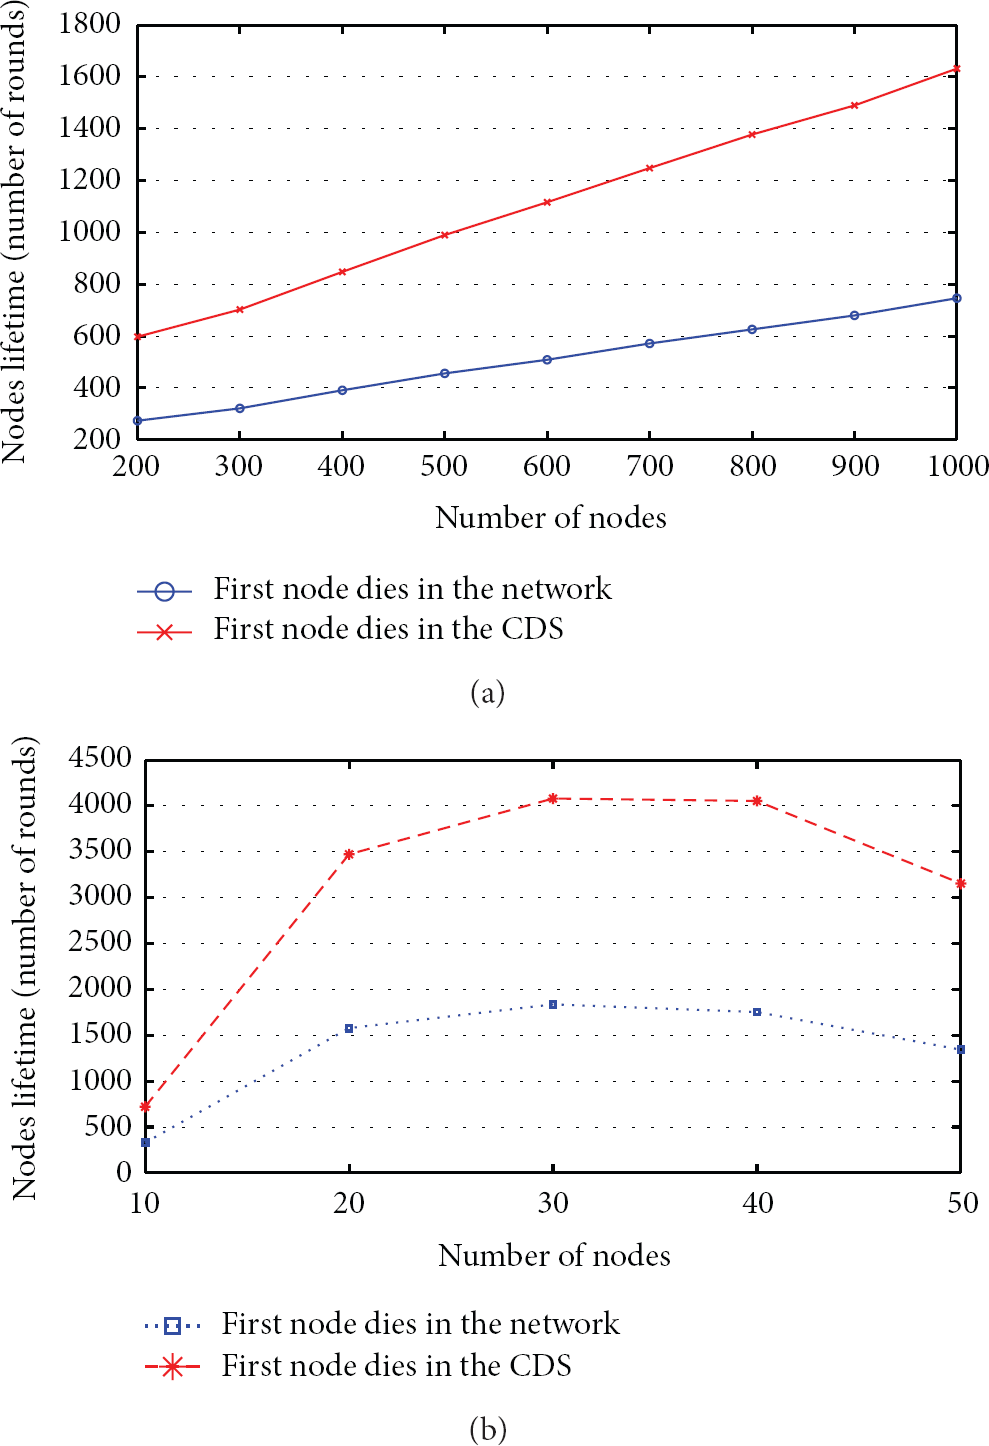
The average lifetime (as number of rounds) of the first node dies (FND) in the constructed CDS using approach V versus the FND of the other non-CDS nodes (the rest of network nodes) in the multilevel heterogeneous networks.
5. Conclusions
In this paper, we propose two distributed approaches for CDS construction in wireless sensor networks. Approach I aims to construct a small CDS in distributed setting. It extends the exact-three-hop property construction model that was introduced and implemented in centralized setting in [4, 5] to the distributed environment. Approach II aims to prolong the lifetime of the constructed CDS and achieve energy-efficient construction and maintenance. It implements a nonspanning tree-based CDS construction approach with energy awareness properties.
Throughout the simulation, we study the performance of our proposed distributed approaches and compare them to their centralized version [4, 5]. Simulation shows that our distributed construction approaches have a maximum size ratio of 1.5 to the centralized approach, and that they satisfy all the geometrical properties of the exact-three-hop property construction model. Based on this ratio, our distributed approaches achieve an approximation factor of 7.5 from the optimal CDS. To the best of our knowledge, this approximation outperforms the existing distributed CDS construction algorithms.
For the lifetime of the constructed CDS, considering a multilevel heterogeneous network, simulation shows that the constructed CDS using approach II obtains at least 50% extra rounds than the first node dies of other nodes (non-CDS nodes) in the network. Simulation also shows that approach II does not incur any increase in CDS size or communication overhead as a result of simplifying its ranking function to introduce energy efficiency.
In future, we consider applying a pruning algorithm to remove the redundant connectors from the final backbone. Furthermore, we plan to consider another source for heterogeneity by assuming sensor nodes to have variable transmission ranges.
Footnotes
Conflict of Interests
The authors declare that there is no conflict of interests regarding the publication of this paper.
Acknowledgment
The authors extend their appreciation to the Deanship of Scientific Research at King Saud University for funding this work through research group no. RGP-VPP-264.