
Abstract
This study was designed to gain insight into the influence of performing different types of secondary task while driving on driver eye movements and to build a safety evaluation model for secondary task driving. Eighteen young drivers were selected and completed the driving experiment on a driving simulator. Measures of fixations, saccades, and blinks were analyzed. Based on measures which had significant difference between the baseline and secondary tasks driving conditions, the evaluation index system was built. Method of principal component analysis (PCA) was applied to analyze evaluation indexes data in order to obtain the coefficient weights of indexes and build the safety evaluation model. Based on evaluation scores, the driving safety was grouped into five levels (very high, high, average, low, and very low) using K-means clustering algorithm. Results showed that secondary task driving severely distracts the driver and the evaluation model built in this study could estimate driving safety effectively under different driving conditions.
1. Introduction
With the increasing use of in-vehicle information systems (IVIS) in cars, an understanding of the safety implications of secondary tasks is becoming more and more crucial. These systems could place demands on drivers that might lead to distraction and diminish capacity to perform driving tasks. According to the report of Nevile and Haddington, drivers commonly engage in distracting activities and this accounts for 14∼21% of crashes caused by distraction [1]. Estimates from the 100-car naturalistic driving study are similar, placing secondary task engagement as an important contributing factor for more than 22% of crashes and near-crashes [2]. As complexities of in-vehicle and modernized technologies grow, this figure is expected to increase.
According to the report of World Health Organization, many countries have attached great importance to such activities and have taken effective measures to prohibit multitask driving. Countries such as United States, China, and Canada have enacted laws banning the use of hand-held cell phone, text messaging, hand-held GPS, or mapping services while driving. Although operating a motor vehicle while using a computer, making calls using a Bluetooth headset, and interacting with other wireless devices are often legal in these countries [3], these actions can still severely distract the driver. The issue of driver distraction still calls for further attention. On April 14, 2009, the National Highway Traffic Safety Administration of China listed on its website that 41% of traffic accidents were caused by driver distraction. On June 17, 2012, the website distraction.gov listed that over 3000 people were killed in distracted driving crashes in 2011 alone. One of the important reasons of these accidents is multitask driving, a main factor of driver distraction. Research is still needed on the effects of using in-vehicle hands-free devices on driver performance.
Jin et al. reported that during the driving process more than 80% traffic information was acquired by driver's visual channel [4]. Therefore, it has important significance to make a study on driver eye movements for traffic accidents prevention. Previous studies have shown that secondary task driving has significant influence on fixation measurements of fixation frequency, fixation duration, and pupil diameter. Chisholm et al. found that performing difficult music search tasks using MP3 player while driving increased the amount of mean fixations frequency from outside into the vehicle [5]. According to the report of Young et al., drivers typically made a large number of short fixations to the in-vehicle device during the secondary task driving. Pupil diameter was also significantly increased with the touch-screen secondary task while driving [2].
Saccade as another important measure of eye movement has been researched fewer than the fixation. Yang et al. found that in visual tasks, saccade duration and amplitude changed obviously [6]. Jin et al. reported that drivers made significantly few saccades with the cell phone task while driving [7]. Comparing to fixation and saccade, blink is a less well known measure of nonspontaneous eye activity. It responds differently to specific environment stimuli. When visual workload is high, blink frequency and duration decrease since visual input is disrupted when eyelids close. On the other hand, blink frequency increases when the task requires the eyes frequently moving from one object to another because blinks tend to punctuate the end of an episode of information intake [8].
As discussed above, secondary task driving is a significant and multifaceted road safety issue. However, researchers have been scarcely devoted to analyze the influence of different types of secondary task on driving safety and to build an evaluation model for secondary task driving safety to prevent traffic accident as far as possible. Aiming at that, the overall goal of this paper is to examine the influence of different secondary tasks on driver eye movements and develop a method to evaluate the safety for secondary task driving.
2. Description of Experiment
2.1. Participants
Eighteen participants (10 females and 8 males, mean age 26.4 years) between 22 and 31 years of age are recruited from JiLin University and surrounding communities. All participants hold a valid class C1 driver's license for more than 2 years and have an annual mileage of more than 5000 km. The participants are also required to be in good physical and mental health and not taking any medication or drugs that would affect their driving performance.
2.2. Apparatus and Materials
The experiment platform built by intelligent vehicle group in JiLin University includes an eye movements tracking system (SmartEye6.0), a Besturn B50 car, an embedded driving simulator, and three secondary task devices (a radio, a computer (IPad4), and a hands-free phone).
2.2.1. The SmartEye6.0 Eyes Tracking System
Driver eye movements while driving are captured by SmartEye6.0 (Smart Eye AB, Första Långgatan 28, Göteborg, Sweden). It uses four cameras mounted in front of windscreen to capture the driver's eye movements and three scenes cameras to record the simulated traffic environment. Video analysis is performed using SmartEyeAnalysis, an offline data review and reduction analysis program. As compared to head-mounted eye movement tracking systems, SmartEye6.0 has the advantage of being separately mounted and therefore has less influence on driving performance. In addition, 60 Hz is adopted as the sample frequency in SmartEye6.0.
2.2.2. Driving Simulator
The driving simulator is a fixed-base, static driving simulator equipped with a Besturn B50 car. The display system projects onto a screen with a width of 115° horizontal field view in front of the vehicle. The experiment apparatus is shown in Figure 1.

Experiment equipment.
2.2.3. Secondary Tasks
According to the report of Yang et al., auditory and visual tasks have different influence effects on drivers’ eye movements [6]. So two visual secondary tasks (radio tuning and computer (iPad4) touching) and one auditory task (a telephone conversation) are adopted as the in-vehicle devices operated by drivers while driving. As illustrated in Figure 1, all in-vehicle devices are fixed roughly in the same place, and drivers need to complete three secondary tasks while driving.
Radio task: an in-vehicle radio is selected as the interaction device and the task is a press-button task. While the driver is driving on the road, he/she needs to turn the channel from FM 88.0 to FM 173.8 using press button on the radio. The whole operation process has ten steps and takes about 7–10's to complete when tested alone.
Computer task: the computer task is used as a navigation system by touching the computer menu and needs seven completion steps. The first two steps are to unlock the computer, then find the main menu, touch “Additional Programs,” and find “navigation system.” At last, drivers need to open the “navigation.”
Conversation task: the task needs a hands-free mobile phone to have a conversation. Drivers must answer three simple questions in this process. (1) How long have you got the driving license? (2) How often did you drive within a week? (3) Did you interact with in-vehicle devices while driving? If yes, did you think these actions pose threat to the driving safety?
2.2.4. Road Environment
The highway from ChangChun to SiPing is selected as the driving road environment, for which a real-time 3D model is built using the visual simulation software Multigen Creator and Vega. This highway section has two lanes in each direction, separated by a grassy median. A “heavy” traffic scenario where there are 20 vehicles evenly distributed is adopted as the road environment. This ensures the same road environment for all participants.
2.3. Experimental Sessions
The experiment is conducted in two sessions.
Training session: participants practice with operating three secondary tasks and drive in the simulator first separately and then together. The practice session ends when the participants feel they can operate the secondary tasks safely while driving.
Test session: on the premise of security, drivers should complete four drives, a drive without secondary task (baseline) and three drives with three different secondary tasks. Participants are told to complete the secondary tasks at any time they feel safe while driving.
3. Ascertaining of Evaluation Index System
As we all know, that secondary task has great effect on driver eye movements, while different measures have different sensitivity of influence on driving safety. So measures which have higher sensitivity to secondary task driving safety are chosen to construct the evaluation index system. For this purpose, a repeated-measures ANOVA is adopted to analyse the significance difference between driving with secondary tasks and the baseline conditions.
Fourteen measures of driver eye movements are collected and analyzed in this study. We extract the data in the process of secondary task performing from the whole driving scene which is recorded by three panoramic cameras using video capture software. All eighteen drivers successfully completed the driving tasks and measures of driver eye movements under four driving conditions were collected.
3.1. Fixations
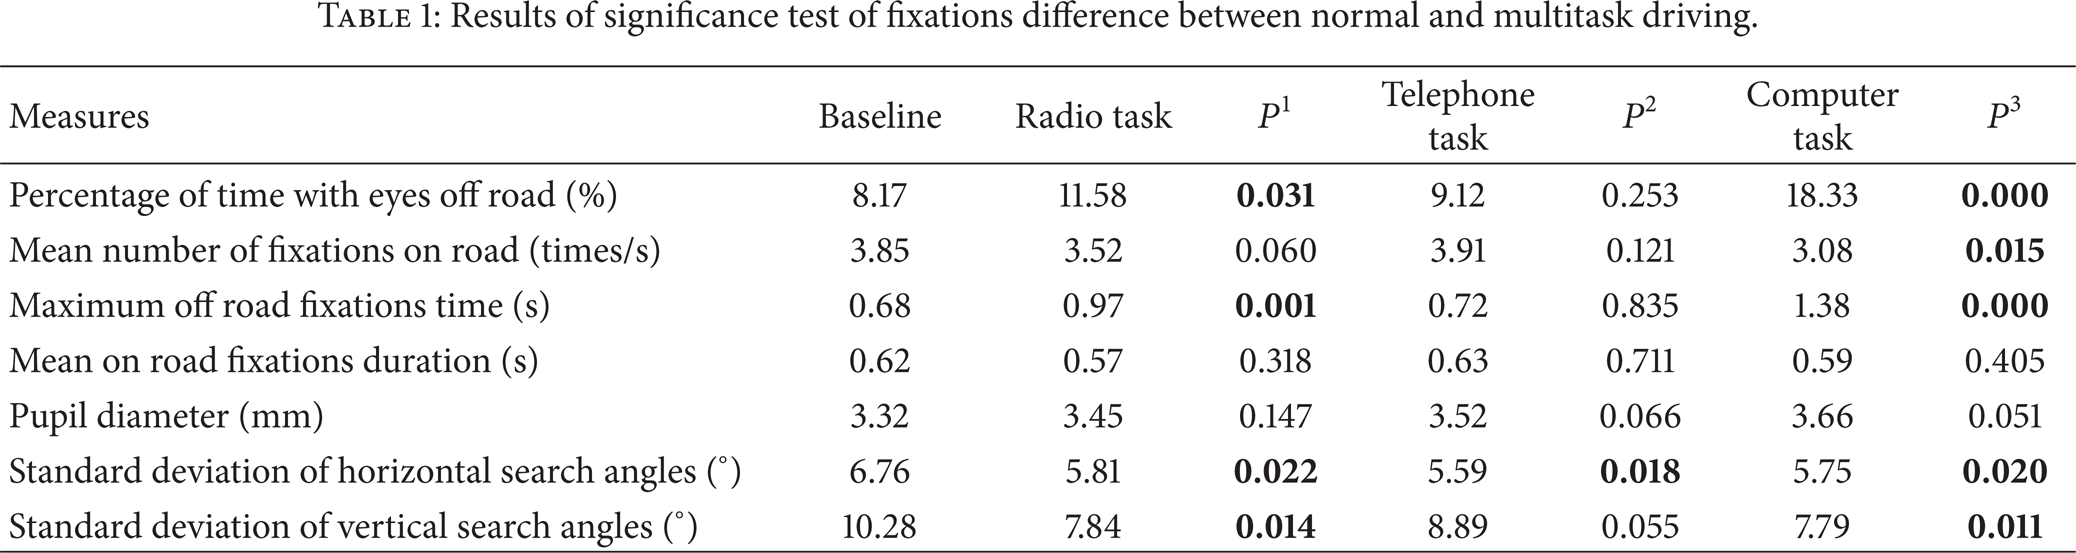
Measures of driver fixation which are adopted in the study include percentage of time with eyes off road, mean number of fixations on road, maximum off-road fixations time, mean on-road fixations duration, pupil diameter, and standard deviation of horizontal and vertical search angles.
Results of significance difference test between the baseline and secondary tasks driving conditions are showed in Table 1. P1, P2, and P3 are results of significance difference test among radio, telephone, and computer tasks compared to the baseline condition. Significant difference exists when P is less than 0.05, which is described in bold in Table 1.
Results of significance test of fixations difference between normal and multitask driving.
3.2. Saccades
As one of the important aspects of driver visual behavior, saccade is the process of substantial eye movements [9]. Measures of saccades summarized in Table 2 include mean saccade speed, mean saccade amplitude, average number of saccade, and maximum saccade speed, which have also been similarly analyzed using repeated-measures ANOVA. In Table 2, we show the significant difference in bold.
Results of significance test of saccades difference between the baseline and secondary task driving.

3.3. Blinks
Three measures of blinks: blink frequency, blink duration, and blink percentage are collected in the study. The blink frequency presents the measurements of averagely how many times blinks occur per minute. Blink duration is the average over duration of each blink in secondary task conducting. Blink percentage shows the percent in terms of time when blink happened in secondary tasks [10]. A repeated measure ANOVA found that the radio and computer tasks had no significant effect on driver blink behavior. However, significantly longer blink duration and larger blink percentage were found during the telephone secondary task (blink duration: M = 0.17 s, S.E. = 0.04 s; blink percentage: M = 0.14%, S.E. = 0.02%) compared to the baseline (blink duration: M = 0.154 s, S.E. = 0.032 s; blink percentage: M = 0.12%, S.E. = 0.02%), all P<0.05. Significant differences were also found in blink frequency between telephone task and the baseline condition, P<0.05.
3.4. Evaluation Index System
Through the above analysis we can see that measures of driver fixation are significantly different under four driving conditions except mean on-road fixations duration and pupil diameter. The tested saccade measures and three blink measures all had significant difference between secondary tasks and the baseline conditions. Therefore, twelve measures of driver visual behavior which have significant difference between the baseline and secondary tasks driving are selected to constitute the evaluation index system. These measures are percentage of time with eyes off road x1, mean number of fixations on road x2, maximum off-road fixations time x3, standard deviation of horizontal search angles x4, standard deviation of vertical search angles x5, mean saccade speed x6, mean saccade amplitude x7, average number of saccades x8, maximum saccade speed x9, blink duration x10, blink percentage x11, and blink frequency x12.
4. Safety Evaluation Model for Secondary Task Driving
4.1. Method of Principal Component Analysis
The principal component analysis (PCA) is a mathematical procedure that uses an orthogonal transformation to convert a set of observations of possibly correlated variables into a set of values of linearly uncorrelated variables called principal components. The number of principal components is less than or equal to the number of original variables. Principal components are guaranteed to be independent if the data set is jointly normally distributed. PCA is sensitive to the relative scaling of the original variables [11]. Therefore method of PCA in SPSS11.0 is selected to establish the safety evaluation model for secondary task driving.
4.2. Ascertaining the Principal Components
In the support of collected data, we have adopted method of principal components decomposition to obtain the diagonal matrix of eigenvalues. The screen plot which describes the contribution characteristic for each eigenvalue was obtained and shown in Figure 2.
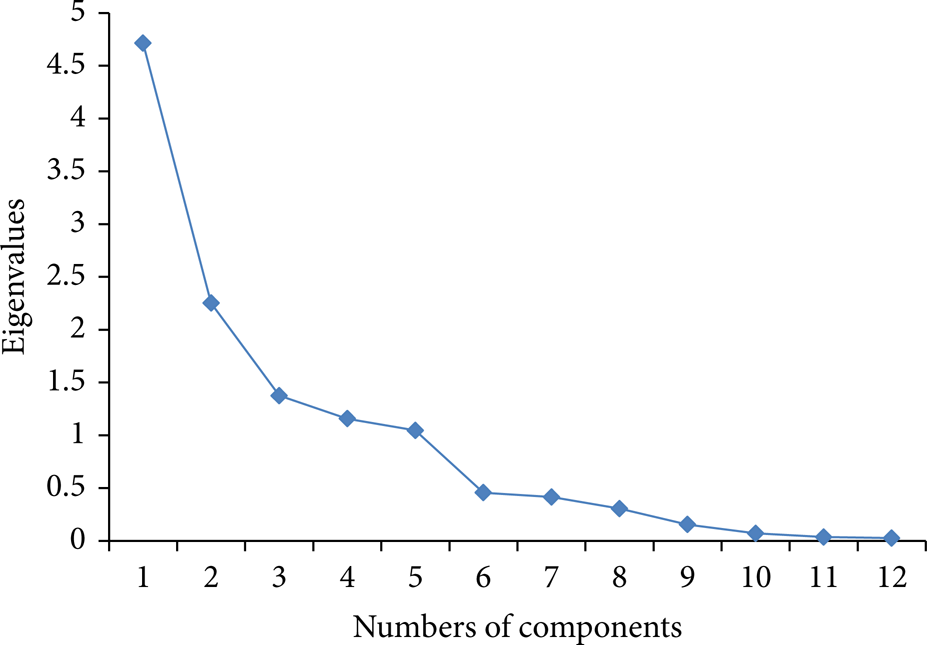
Screen plot.
From Figure 2 we can see that the curve tends to flatten after the 6th principle component. Contribution rate is the proportion of an eigenvalue to all eigenvalues of the sample covariance matrix. If λ
i
(i = 1,2,…, p) is an eigenvalue of sample covariance matrix,
The initial eigenvalues, variance contribution rates, and cumulative contribution rates are shown in Table 3. F1 to F7 are the first seven component principles.
Eigenvalues, variance contribution rates, and cumulative contribution rates of principal components.

As can be seen from Table 3, cumulative contribution rate of the first five principal components amounts to 87.831%, covering 87.831% of all information and meeting the requirement of cumulative contribution rate more than 85% [14]. So, five principal components are chosen to construct the evaluation model in the study. The initial impact load coefficients of driver eye movement measures for principal components are shown in Table 4.
Initial impact load coefficients.

As can be seen from Table 4, the weight coefficient of percentage of time with eyes off road x1, mean number of fixations on road x2, maximum off-road fixations time x3, average number of saccades x8, maximum saccade speed x9, and blink frequency x12 are relatively important indexes in the principle component F1 while F1 is the most important factor for the model; therefore the evaluation score is more greatly influenced by those five evaluation indexes. Initial impact load coefficients of principal components in Table 4 are divided by corresponding eigenvalues square root and the final coefficients corresponding to each evaluation index for measures from x1 to x12 are determined. The final expressions are shown in the following formula:

In formula (1), zx1–zx12 are the standardized variables of evaluation indexes from x1 to x12. Because the evaluation indexes have different unit and magnitude, incommensurability exists among these indexes, which increases the difficult of driving safety evaluation. So these original data need to be standardized and the dimensionless method of standard deviation is applied.
Taking contribution rate of each principal component as the weight, the evaluation model for driving safety based on driver visual behavior can be expressed in the following formula:

4.3. Driving Safety Classification Based on Method of K-Means Clustering
K-means clustering is a method of vector quantization originally from signal processing that is popular for cluster analysis in data mining. K-means clustering aims to partition n observations into k clusters in which each observation belongs to the cluster with the nearest mean, serving as a prototype of the cluster. This results in a partitioning of the data space into Voronoi cells.
Plugging standardized of evaluation measures data into the formulas (1) and (2), principal components scores of all drivers under different driving states can be obtained. According to the score of the evaluation model, levels of secondary task driving safety were divided into five different classes using method of K-means clustering. The safety levels included levels of very high, high, average, low, and very low. As the results of dividing, centers of clustering were −0.29, −0.06, 0.06, 0.19, and 0.30. Combined with experiment measures of driver and the driver type which was surveyed by questionnaire, the score intervals (−0.4,−0.2], (−0.2,−0.1], (−0.1, 0.1], (0.1, 0.2], and (0.2, 0.4] were classified as very high, high, average, low, and very low levels of driving safety, respectively. The evaluation scores and driving safety levels of different drivers under different driving conditions were shown in Table 5.
Evaluation scores of eighteen drivers under different driving conditions.
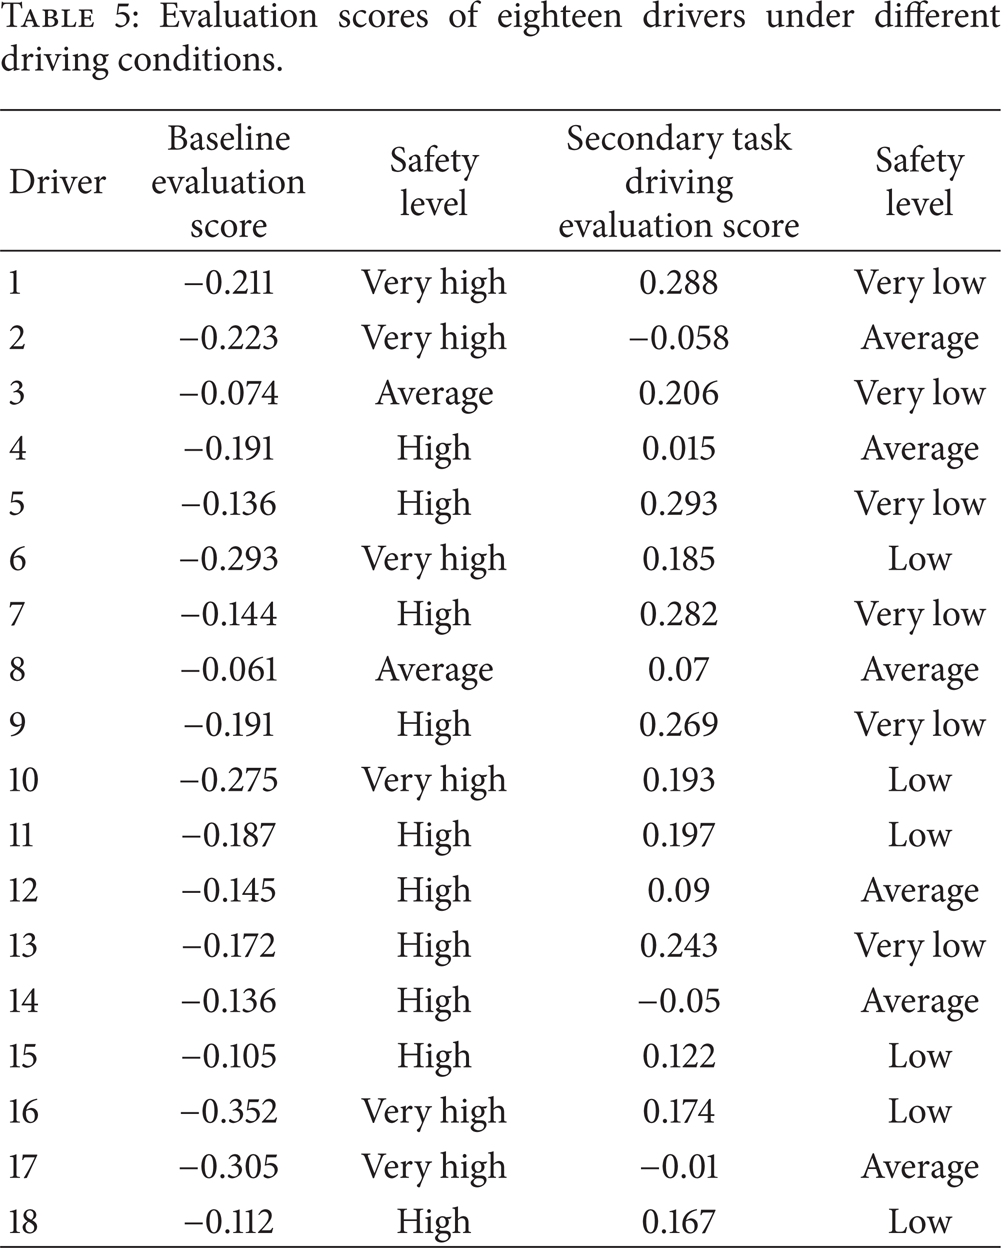
Table 5 shows the evaluation score under the baseline condition is generally lower than the secondary tasks driving, proving that the evaluation model built through principal component analysis can effectively evaluate the driving safety in different task conditions. Although there are a few drivers like the driver 2, get lower evaluation scores with secondary task, the driver still presents large score differences with or without secondary task (baseline evaluation score: −0.223; secondary task driving evaluation score: −0.058). In addition, it indicates from surveys that the driver 2 is a man of rich driving experience and belongs to the cautious type. Lower evaluation scores with secondary task indicate that the driver can keep safe under any driving conditions even with secondary task. In addition, driver 14 and driver 17 are also good at keeping driving safety.
In order to verify the validity and applicability of the model, MP5 operation was selected as the secondary task (10 steps altogether), other eight drivers performing normal driving and secondary task driving simulation in the same road environment as before. Twelve evaluation measures were collected and standardized, and then plugged into the safety evaluation model (2) to achieve corresponding evaluation scores. Results were shown in Table 6.
Driving safety levels of eight drivers interacting with MP5 while driving.
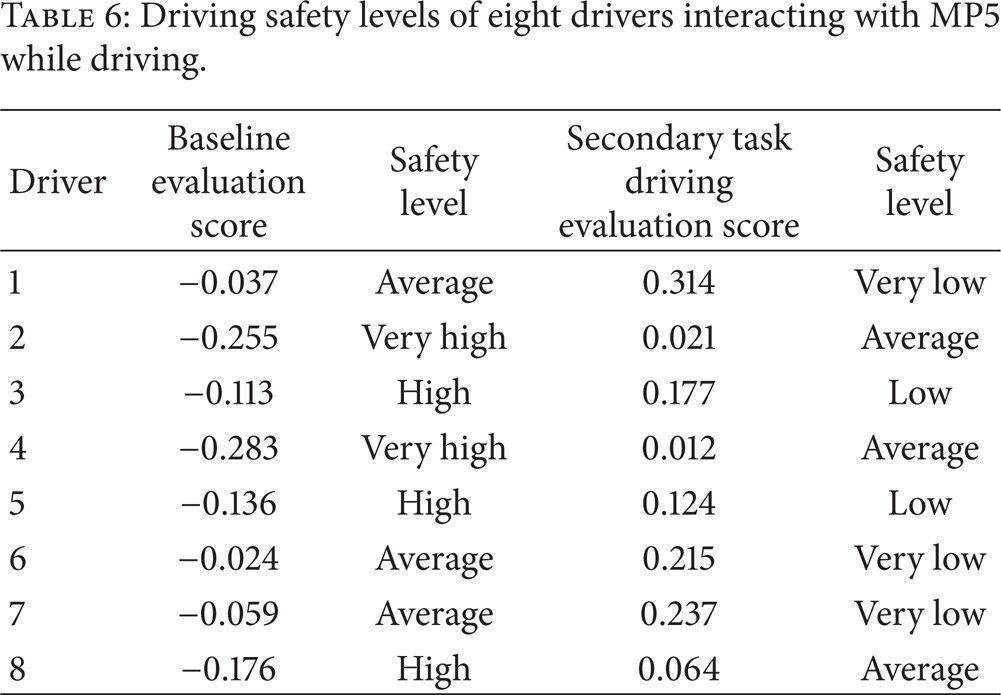
Table 6 showed that the model was still able to correctly classify driving safety levels under different driving conditions.
5. Discussion
The goal of this research was to gain insight into how human eye movements changed while interacting with different types of secondary task while driving and build the driving safety evaluation model based on these measures. Three types of in-vehicle tasks which could be classified into visual (radio and computer) and mental (telephone) tasks were selected. The results clearly show that different types of in-vehicle tasks have different influences on the driver eye movements. Comparing to some research on the effects of in-vehicle tasks on driver eye movements, the measures of eye movement selected in this study are relatively systematic and comprehensive. Because of the eye movement measures of fixation, saccade, and blink were all included.
5.1. Effect of Visual Tasks on Driver Eye Movements
The results showed that visual tasks (radio tuning and computer touching) had a significant effect on measures of fixation and saccade, but had little effect on driver blink behavior.
5.1.1. Driver Fixation Behavior
Analysis of the visual demands of using radio and computer tasks while driving revealed that drivers spent, on average, 1.7 times longer with their eyes off the road while performing searching task than they did when driving without a competing task. This finding is similar to that of Yang et al. who found that performing music search tasks using an IPod touch while driving increased the amount of time that drivers spent with their eyes off the roadway [6]. In addition, because the touch-screen computer is likely to place significant visual demand on the driver due to the absence of tactile and kinaesthetic feedback [15], significantly larger percentage of time with eyes off road was found compared to the press-button radio task. Because of the absence of tactile cues, users are required to glance at the interface more often to confirm that a correct selection or action has been made, a perturbing finding given the predominantly visual nature of the driving task [16, 17]. Furthermore, in order to minimize the distraction caused by searching task, drivers also regulated their fixation area, for narrow standard deviation of horizontal and vertical search angles. This finding is similar to the report of Xian et al. [18].
5.1.2. Driver Saccade Behavior
Although there were few researches on driver eye saccades behavior, significant differences were also found in mean saccade speed, mean saccade amplitude, average number of saccades, and the maximum saccade speed between visual tasks and the baseline condition. Drivers had 1.12 times higher saccade speed and 1.28 times higher maximum saccade speed when driving with visual tasks in comparison with the normal driving. It is because of this that drivers need to divert their sight quickly to the in-vehicle devices to ensure driving safety as far as possible. Significantly larger average number of saccades was also found in computer task compared to radio task. According to Yong's research, this phenomenon was caused by secondary tasks difficulty; the more difficult it is, the larger average number of saccades turns [6].
5.1.3. Driver Blink Behavior
Through analysis of repeated measure ANOVA, both radio and computer tasks had no significant effect on the blink.
5.2. Effect of Mental Task on Drivers Eye Movements
Results showed that mental task (conversation via telephone) had slight impact on measures of fixation and saccade, but had remarkable influence on blinks.
5.2.1. Driver Fixation and Saccade Behavior
Since there was nearly no visual demand required in telephone task, the effect of it was unsurprisingly different with that of radio and computer tasks. The results showed that most measures of driver fixation and saccade behavior were not influenced by the mental task performing compared with the baseline condition. These results supported previous research that has shown that the fixation and saccade are particularly not affected by mental tasks [19].
5.2.2. Driver Blink Behavior
Although there was no significant difference in driver blink behavior during the visual secondary task, a repeated measure ANOVA showed that three measures of driver blink changed significantly during the telephone task, blink frequency, blink duration, and blink percentage. These results were similar to the research of Yang et al. [6]. In their research, they found driver's blink percentage increased about 30%, blink duration increased 3%, and blink frequency per minute increased 25% while engaging in mental tasks. The blink percentage and blink duration data in our study show less increases, respectively, 17% and 1.12%.
5.3. Driving Safety Evaluation Model
Five principle components were extracted by using principle component analysis and the influential weights of different evaluation indexes were established to set up the evaluation model for driving safety. At last, combining experiment data with driver type, the relationships between the evaluation score and safety level were established by using method of K-means clustering. Results showed that the driving safety evaluation model built in this study could evaluate driving safety effectively in different driving conditions and provide an effective judgment method for driving safety monitoring and traffic accident early warning.
6. Conclusions
Significant differences were found in driver eye movements while driver interacts with radio, computer, and telephone tasks compared to the baseline condition. In general, radio turning and computer touching tasks which need many visual resources have a significant influence on driver fixation and saccade behavior. However, conducting telephone conversation task which represents a mental or an auditory needed task has obvious effects on driver blink behavior. The evaluation model for secondary task driving safety based on driver eye movement measures which were obtained from different types of secondary task could evaluate driving safety effectively. The findings of these results may contribute to evaluating the degree of driver's distraction and providing an effective judgment method for driving safety monitoring and early warning.
The present study concentrated on the model for the evaluation of secondary task driving safety based on measures of driver eye movements. Although the evaluation model can effectively evaluate driving safety with secondary tasks of telephone, radio, computer, and MP5, the rest of the types of tasks still remains to be analyzed in detail, such as speech-based in-vehicle devices, music and navigation. With the development of science and technology, more and more entertaining and information systems are embedded in the vehicle; thus various secondary tasks appear sequentially. So the evaluation of interacting with these tasks should also be studied further.
Conflict of Interests
The authors do not have any conflict of interests regarding the content of the paper.
Footnotes
Acknowledgments
This research was partially supported by Doctoral Study Special Research Foundation of Higher Education (20110061110036), Major Projects of JiLin Science and Technology Department (20116017), New Century Excellent Talent Foundation Program (NCET-10-0435), and Talent Development Foundation Projects of JiLin (801121100417).