
Abstract
This paper proposes a monitoring system for meat freshness and use-by date, based on the smart RFID (radio frequency identification) tag. Freshness can be checked by various factors, such as the presence of microorganisms, bacteria, and gases. This paper focuses on detecting the temperature, humidity, and the gases released by meat. We analyzed the factors affecting the freshness of meat and decided to use a gas sensor as the main detection method. We use temperature sensor and humidity sensor as auxiliary sensors to get the food poisoning index. The proposed system consists of an RFID tag, temperature sensor, humidity sensor, gas sensor, reader, and server. By comparing the temperature, humidity, and gas concentration of the meat storage environment, we can get the relationship between meat freshness and the sensor signal. This monitoring system can show the meat freshness at four distinct grades: High, Medium, Low, and Spoilage. In order to confirm the usefulness of the proposed system, we performed experiments on pork. With the smart RFID tag, we successfully estimated the freshness of the meat.
1. Introduction
People who live in 21st century pay more attention to food safety than price, because of the improvement in living standards. Freshness is the main index when customers want to purchase meat. Therefore, knowing the exact meat freshness and use-by date is necessary for customers, and there are many advantages in safety and economy. Meat freshness is most affected by food conservation methods. In general, many people agonize over whether to discard or eat old meat. If the meat freshness is known in advance, it is possible to prevent the economic loss of discarding meat. In addition, this will reduce the risk of food poisoning from eating rotten meat [1–4]. Furthermore, if we know the use-by date in advance, we can take measures, such as freezing treatments or other uses. This may provide a great deal of convenience for distributors, sellers, and consumers. At present, information on food, such as its place of origin, manufacture date, and ingredients, is checked throughout the distribution channels using barcodes, quick response (QR) codes, and radio frequency identification (RFID). Nonetheless, these current practices fail to deliver accurate expiration dates altered by the various factors encountered during distribution [5, 6]. There is a lot of research using electronic noses to measure the freshness of food. However, electronic noses are very large and expensive, and therefore are not suitable for monitoring the freshness of food during distribution processes [2, 7, 8].
The traditional meat freshness determination methods were sensory identification, physical detection, chemical detection, microbial appraisal methods, and so on. These methods had many shortcomings such as their long experiment cycle, tedious steps, and environmental requirements. A fast and intuitive meat freshness detection method is required. With the development of gas sensor technology, using gas sensors to detect food freshness has become possible. Meat is composed of water, protein, fat, and some carbohydrates; enzymes and bacteria will decompose the meat into volatile gases. The protein will decompose into ammonia, hydrogen sulfide, and ethanethiol; the fat will decompose into aldehydes and aldehyde acid; and the carbohydrate will decompose into alcohol, ketone, and carboxylic acid. In the process of spoilage, these gases' concentrations will increase exponentially. Using special gas sensors can allow the detection of these gases and so the judgment of the meat's freshness. Temperature and humidity have a large effect on the microorganisms that create spoilage. Through combining gas, temperature, and humidity sensors, we can make the detection more accurate [9–12].
The use-by date can be confirmed by computing the quality characteristics and analyzing the reaction time using the Arrhenius equation [13]. The use-by date is calculated and printed using the calculated reaction speed constant. However, as the environmental conditions can change over time in the actual distribution process, the freshness and use-by date will not be accurate if such changes are not reflected. Therefore, a real-time freshness and use-by date monitoring system in the distribution process is necessary for both managers and consumers.
In this paper, we propose a monitoring system for meat freshness and use-by dates. The proposed system consists of an RFID tag, temperature sensor, humidity sensor, gas sensor, reader, and server. The smart RFID tag can help customers ascertain meat freshness and the use-by date directly. These tags save data concerning the temperature, humidity, and freshness during the distribution process. Therefore, the consumers can know the meat's recent history. We can get the relationship between the sensor signal and meat freshness by temperature and estimate the use-by date through a food-posing index. In order to verify the effectiveness of the proposed monitoring system, we performed experiments on pork. The proposed RFID tag measures the temperature, humidity, and ammonia gas (NH3) concentration and transmits it to a server. The measured information can be calculated and can be displayed as one of four grades: High, Medium, Low, and Spoilage.
2. The Proposed Monitoring System
We propose a monitoring system that extrapolates meat's freshness and use-by date in the distribution process. The proposed system provides the freshness and use-by date of the meat using a smart RFID tag. This system consists of an RFID tag, temperature sensor, humidity sensor, gas sensor, RFID reader, and server. A block diagram of the proposed system is shown in Figure 1. A gas sensor measures the gas emanating from the meat and transmits the output signal to the micro controller unit (MCU). At this time, in order to give an accurate value, we use the interface circuit. The MCU transmits the data to a reader, and a PC determines the freshness and use-by date using the data from the reader. This is then recorded by the server.

The block diagram of proposed system.
Figure 2 shows the workflow of the smart RFID tag. The smart RFID tag can detect the freshness of meat and transmit the data to server by an RFID reader. The server analyses the ammonia data and shows the result directly to customers.

Workflow of the smart RFID tag.
2.1. The Smart RFID Tag
The block diagram of the smart RFID tag is shown in Figure 3. The smart RFID tag consists of a 950 MHz antenna, radio frequency (RF) front-end, power harvester, demodulator, modulator, MCU, sensors, and battery. The power harvester harvests power from the RF waves and supplies power to the MCU and temperature sensor. The battery supplies power to the ammonia and humidity sensors. The demodulator transmits the converted RF data to the MCU using an amplitude-shift keying (ASK) method. The modulator transmits digital signal of MCU to reader using the frequency-shift keying (FSK) and backscatter method. The MCU processes the sensor data and converts it into digital data, and the manufactured smart RFID tag is a semipassive-type tag worked by both the RF signal power and battery.

The block diagram of smart RFID tag.
When queried, the smart RFID tag responds with a unique identification number by reflecting the energy back to the reader through a technique called backscatter modulation. This RFID system consists of an RFID tag and an RFID reader. A typical passive tag consists of an antenna and an application-specific integrated circuit (ASIC) chip, both with complex impedance. The chip obtains power from the RF signal transmitted by the RFID reader: the tag then sends data back by switching its input impedance between two states, thus modulating the backscattered signal. At each impedance state, the RFID tag presents a certain radar cross section. One of the impedance states is usually high and another is low to provide a significant difference in the backscattered signal [14–17].
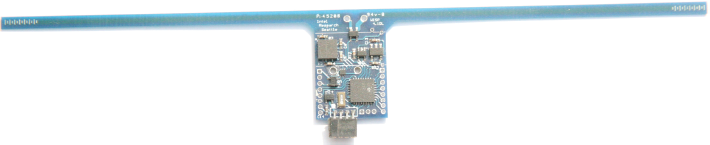
Figure 4 is a detailed view of the front side of the smart RFID tag PCB (printed circuit board); the antenna is not shown on this figure. The MCU is on the other side of the PCB, while the socket used to connect the smart RFID tag is on the right. The MCU used is the PS430. On the underside of the PCB are a series of pins that can be connected with multiple sensors. The ones used in this paper are P3.7, P2.3, and GND (Ground). P3.7 and P2.3 are used to measure the sensor outputs. There is also an internal temperature sensor inside the microcontroller; as such, we can measure the temperature directly. Figure 5 shows the manufactured smart RFID tag, which has a 950 MHz antenna. The data can be read at 40–50 cm, which dictates where, in an actual environment, we would put the container with the smart RFID attached. The data can be read with ease.

The smart RFID tag PCB layout.
Smart RFID tag.
2.2. Sensors
The MSP430 MCU has an internal temperature sensor; we use this to detect the environmental temperature of the meat. The smart RFID tag will be attached inside the meat container, so that the temperature can be near to the actual temperature of the environment. The characteristics of the internal temperature sensor are shown in Table 1.
Characteristics of the internal temperature sensor.

We use MM1001 to detect the humidity, which is a commercial product. This sensor responds quickly and accurately. Figure 6 shows the typical performance diagram of MM1001. The characteristics of the humidity sensor are shown in Table 2. Figure 7 shows the interface circuit of the humidity sensor. Unlike the internal sensors, the external sensors can be influenced by external noise. Therefore, in order to get accurate measurements of the sensor values, we use a noise filter. Figure 7 is the interface circuit of the gas sensor.
Characteristics of humidity sensor.

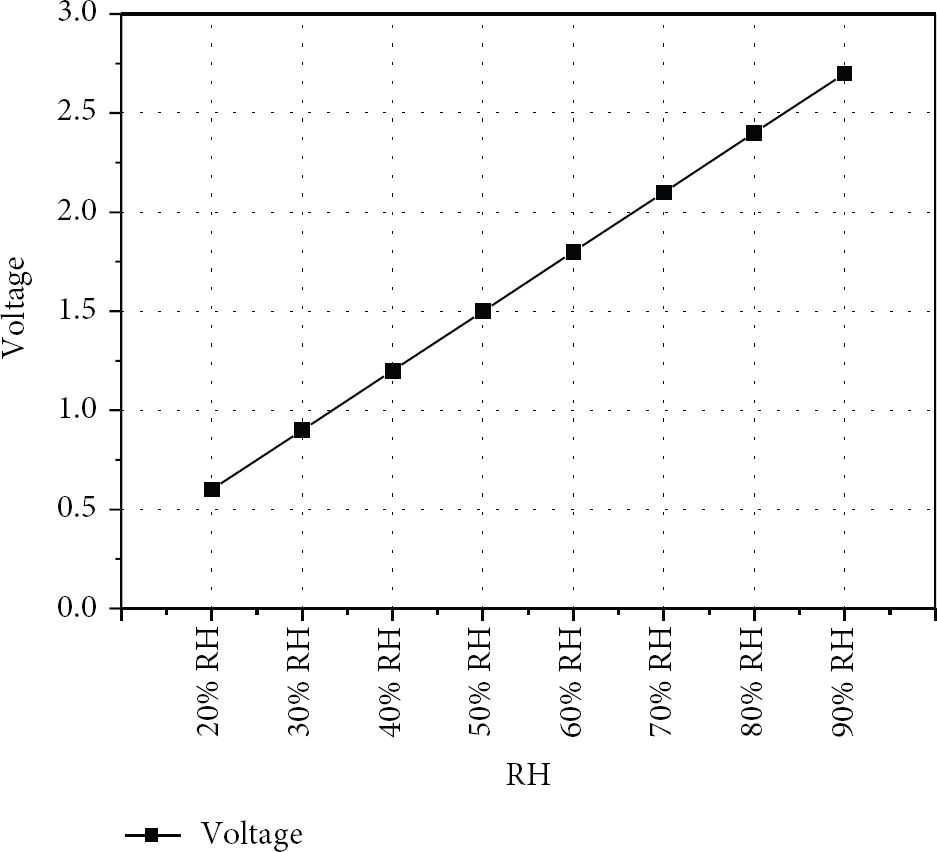
Typical performance diagram of MM1001.

Interface circuit of the humidity sensor.
We use MICS-5914 as the main gas detection sensor, which is also a commercial product. This sensor is small and requires low power consumption. Figure 8 shows
Characteristics of the ammonia sensor.


Sensor characteristics of MICS-5914.
We designed the interface circuit of this sensor for accurate data measurement, as the proposed system uses a single gas sensor to determine the freshness. Therefore, the precision of the gas sensor output is very important. In order to ensure the precise measurement of the sensor values, we used an amplifier to amplify the resolution. However, the amplifier also amplified the noise. Therefore, we included a noise filter to remove the noise and then amplified the signal. There was a small amount of noise that could not be removed with the noise filter, so we used an RC filter as a secondary filter. Through the interface circuit above, the data could be obtained with greater precision. Figure 9 is the interface circuit of the gas sensor. The interface circuit is constructed from three parts: a noise filter, an amplifier, and a low pass filter.

Interface circuit of MICS-5914.
2.3. RFID Reader
The RFID reader in the proposed system is a speedway revolution ultra-high frequency (UHF) RFID reader made by Impinj [18]. This reader works at 950 MHz and can read and write RFID tags at a range of 10 cm–10 m. Figure 10 is the RFID reader of the proposed system, the white box on the left is the antenna, and the right box is the RFID reader control box. The specifications of reader are shown in Table 4.
Specification of reader.

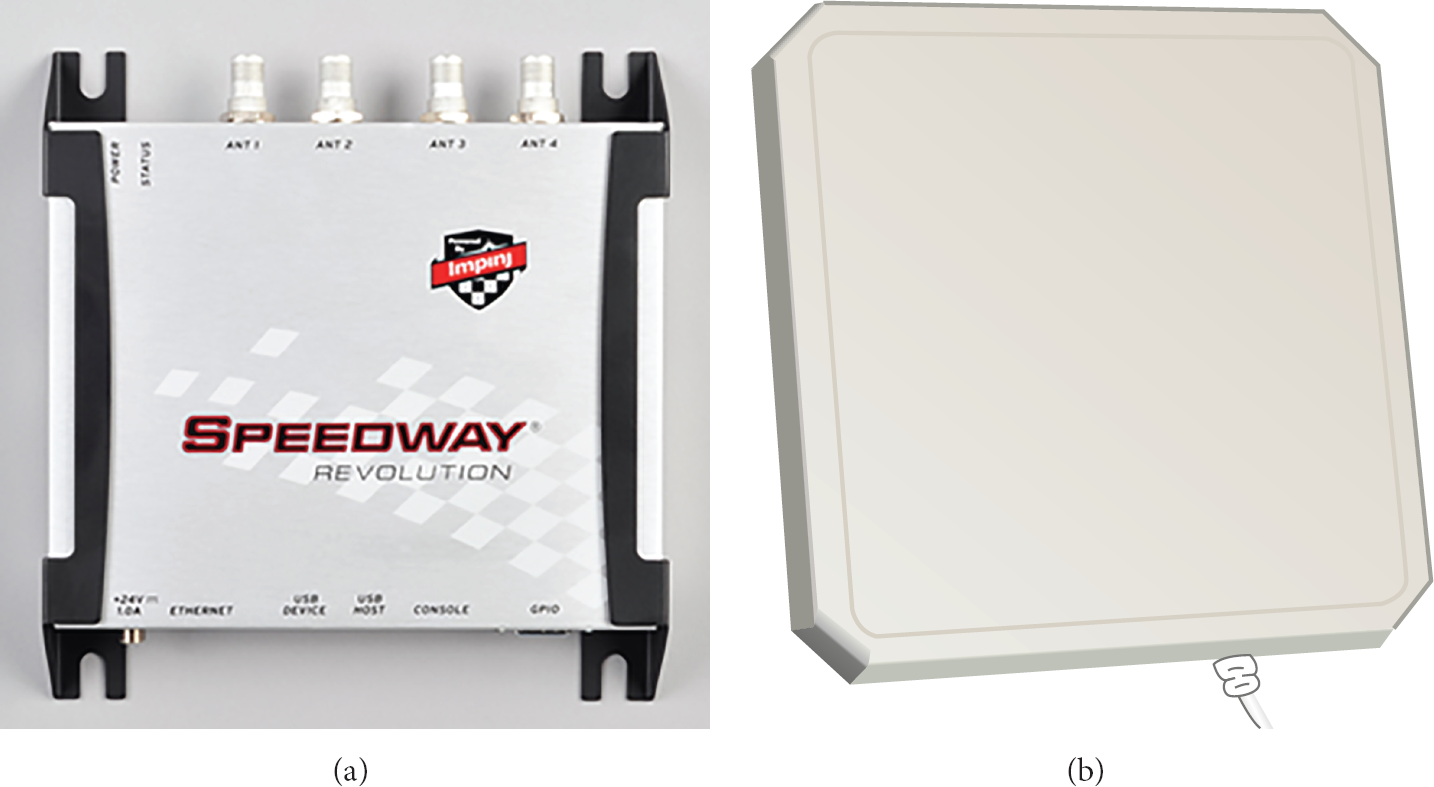
RFID reader (a) and antenna (b).
2.4. Meat Freshness Monitoring
The food poisoning index is an important indicator of food decomposition. Table 5 is the food poisoning index that was provided by Food and Drug Administration of Korea [4]. The food poisoning index uses percentages to express the corruption speed with which spoilage microorganisms grow under particular temperature and humidity conditions. The spoilage microorganisms grow rapidly at high temperature and humidity. The food poisoning index is only determined by the temperature and humidity; therefore, customers do not know the risk of food poisoning from the meat. However, by knowing the meat's freshness, temperature, and humidity, the use-by date can be analogized.
The food poisoning index.

Attention: 10~35, caution: 35~53, warning: 53~85, and risk: 86~100.
Meat is composed of water, protein, fat, and some carbohydrates; enzymes and bacteria will decompose these into volatile gases including ammonia, hydrogen sulfide, and ethanethiol. In the process of spoilage, these gases' concentrations will increase exponentially. Using ammonia gas sensors allows us to detect these gases and judge the meat's freshness. The freshness of meat can be determined based on the microorganisms' growth time and the food poisoning index. Meat freshness can be expressed as one of four grades: High, Medium, Low, and Spoilage. If the sensor output is located near the borderline, repeatedly check the sensor value and accurately make a decision using sensor values and model equation, which were previously checked. We have confirmed the output voltage of the sensor for each grade by experimentation. Table 6 is a description of each grade from the experimental data. The temperature data, humidity data, and ammonia concentration data are calculated in conjunction with the food poisoning index. We compared the relation between the food poisoning index and the concentration of ammonia.
Description of meat freshness.

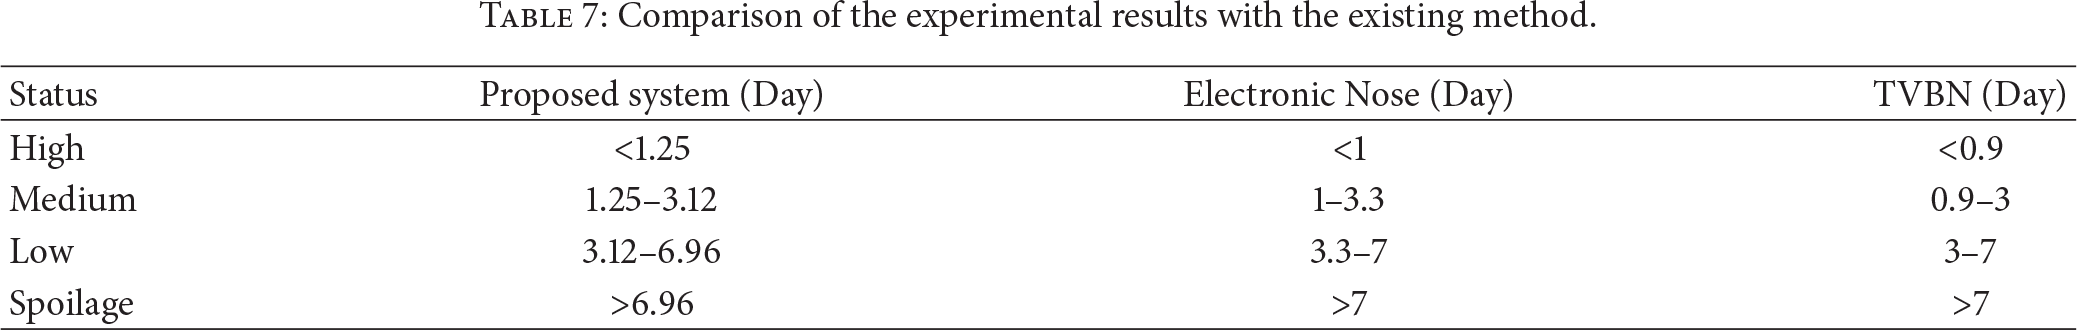
In order to confirm reliability of the proposed system, we performed experiments on pork and compared it to the experimental results of an electronic nose and TVBN (total volatile basic nitrogen) measurements. When the meat freshness was “High,” the TVBN value was less than 10.95 mg/100 g; “Medium” was from 10.95 mg/100 g to 16.94 mg/100 g; “Low” was from 16.94 mg/100 g to 25 mg/100 g; and “Spoilage” was more than 25 mg/100 g [9]. Table 7 is a comparison of the experimental results with the existing method. The proposed system and TVBN measurements were recorded at 4°C, and the electronic nose's experimental results were recorded at 5°C. We have confirmed that the same results as for the existing method were obtained [2, 9, 10].
Comparison of the experimental results with the existing method.
There are three levels of hierarchy for the software; Figure 11 elucidates the hierarchy of software. At the top level is the MainFrame GUI of the project, at the bottom level is the LLRP/Ethernet code of the project, and in the middle is a wrapper for the LLRP code called “RFID reader.” There are several supporting classes.
MyTag is a wrapper for the tag seen by the reader. MyTag knows how to parse sensor data from the tag. The RFID reader generates MyTags and passes them to the graphical user interface (GUI) layer for display. TagStats keeps track of the tags that have been seen and updates the grid box tag list on the GUI. Stage, Saturn, and other classes in the SaturnDemo project are for the Saturn accelerometer.

Hierarchy of software.
Figure 12 shows the main interface of the software. Box A shows the four grades of the test results and Box B shows the received data from tag. These data include the temperature, humidity, and ammonia concentration. Box C shows the previous data. The received number includes information such as the tag type, sensor data, HW version, and HW Serial. The general protocol is [1 byte | tag type] + [8 byte | data] + [1 byte | HW Version] + [2 byte | HW Serial #] [19].
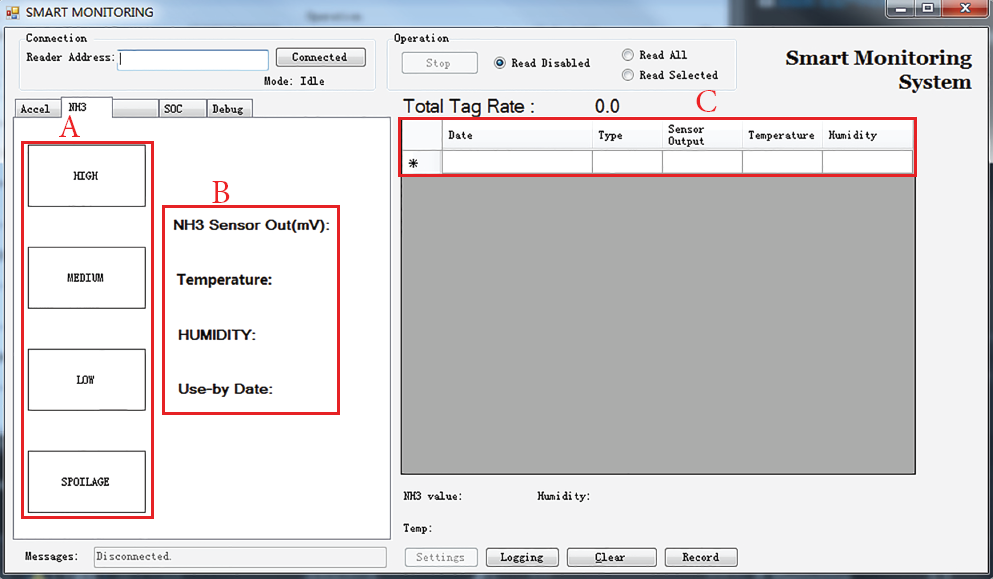
Interface of software.
3. Experiment
In this paper, we performed three experiments on the pork. Figure 13 is the experimental pictures of the demo system. Through the experiment, we measured the output of the ammonia sensor, humidity sensor, and temperature sensor. The tag and sensors are attached inside the container in order to get the actual environment's data. The first experiment was at room temperature (22°C). The second experiment was at refrigerator temperature (4°C). The third was under both 22°C and 4°C. Figure 13 shows that the RFID reader can read tags at a certain distance; it can also read tags when a pork container is inside a refrigerator. We judged the pork to be Spoilage if the ammonia sensor value was more than 1000 mV. When the ammonia sensor value was more than 1000 mV, the smell and color of pork were very poor. The spoilage speed is based on the food poisoning index.

The experimental picture of the demo system.
Figure 14 shows the concentration of ammonia at 22°C and 50% humidity.

Concentration of ammonia at 22°C.
During the experiment process, we found that the humidity inside the container was always kept at 50%. We found that at room temperature the spoilage speed is rapid. Model equations were determined using the measured data and are given as follows:


We set the output voltage of end of use-bye date as 1000 mV; the use-by date is calculated by (3) and is 12.029 hours.
Figure 15 shows the concentration of ammonia at the refrigerated temperature (4°C), when the humidity was 50%.

Concentration of ammonia at 4°C.
At low temperatures, pork does not corrupt as rapidly. In this experiment, we put the pork container inside a refrigerator and put the RFID antenna outside. The test results show that the RFID data can be read well, even when there is an obstacle such as a refrigerator wall. The following is a model of the equation when the temperature is 22°C and the humidity is 50%, and the use-by date is 181.28 hours:

Figure 16 shows the difference in the concentration of ammonia between 4°C and 22°C. We first left the pork at 4°C, put it at 22°C for about 10 hours, and then put it back in the refrigerator at 4°C. In this experiment, the humidity remained at 50%.

Concentration of ammonia between 4°C and 22°C.
The spoilage accelerated from 4 h to 14 h. Although after 14 h, the spoilage speed slowed down; it still corrupted more rapidly than before, because the spoilage microorganisms had started growing. The following is a model of the equation in these conditions, and the use-by date is 50.47 hours:

From the above results (4°C and 4°C–22°C), we found that if the temperature condition changes during distribution period, the use-by date shortens to 130.82 hours.
The temperature data, humidity data, and ammonia concentration data are calculated as suitable for the food poisoning index. We compared the relationship between the food poisoning index and the concentration of ammonia; the calculated result is displayed as four grades: High, Medium, Low, and Spoilage. Figure 17 shows the monitoring screen of experiment at 22°C, 50% humidity, and 60 hours.

Monitoring screen of experiment at 4°C, 50% humidity, and 60 hours.
4. Conclusion
In this paper, we proposed a monitoring system for meat freshness detection, based on the smart RFID tag. Through combining the RFID technology with a gas sensor, temperature sensor, and humidity sensor, we successfully obtained the relationship between meat freshness and gases released. The proposed RFID tag measured the temperature, humidity, and ammonia during the distribution and storage processes, and we used the food poisoning index as a standard of judgment. Through comparisons with the food poisoning index, the measured information was calculated and divided into four categories: High, Medium, Low, and Spoilage. In order to confirm the usefulness of the proposed system, we performed experiments on the pork. The first experiment was at room temperature (22°C), the second was at refrigerator temperature (4°C), and the third was at both temperature conditions of 22°C and 4°C at certain time. The first experiment was at 22°C and the humidity was at 50%. In this state, the spoilage speed was rapid, and the use-by date was 12.029 hours. The second experiment was at refrigerator temperature (4°C), with the humidity at 50%. In this state, the pork did not corrupt as quickly and the use-by date was 181.28 hours. The third experiment was carried out at both temperature conditions, 4°C and 22°C. We initially had the meat at 4°C, then left it out at 22°C for about ten hours, and then returned it to 4°C. During the 10 hours at 22°C, the spoilage speed was accelerated. Even though we returned it to 4°C, the spoilage speed was still faster than before, because the spoilage microorganisms had started growing and the use-by date was 50.47 hours. The experimental results show that the system can detect meat freshness quickly and accurately. The freshness determination results were similar to the existing methods; electronic noses measure freshness using many gas sensors, so these systems are very large and expensive. However, the proposed system uses just one gas sensor, so this system is smaller and cheaper. In addition, our system can predict the use-by date. In the future, our proposed system should be applied to other food, so that their production cost can also be reduced.
Footnotes
Conflict of Interests
The authors declare that there is no conflict of interests regarding the publication of this paper.
Acknowledgment
This research was supported by the Agriculture Research Center (ARC, 710003-03) program of the Ministry for Food, Agriculture, Forestry and Fisheries, Republic of Korea.