
Abstract
A numerical approach to simulate the crack initiation and propagation process of the nonlinear fracture behavior of the quasi-brittle materials under tensile loading is presented. The nonlinear fracture of Mode I of quasi-brittle material is analyzed by considering the effects of microscopic softening rate and heterogeneity. The results show that the softening rate and the heterogeneity of quasi-brittle material affect the values of stress intensity factor K I . The softening index affects merely the size of the plastic zones while the heterogeneity causes the more sophisticated response of quasi-brittle materials.
1. Introduction
In accordance with the mechanical behavior, commonly materials can be broadly grouped into two categories: the brittle material and the ductile material. The steel, the copper, and the aluminum usually fall in the class of ductile materials while the glass, the ice, and the cast iron fall in the class of brittle ones. The two categories can be distinguished according to their respective stress-strain curves, such as the ones shown in Figure 1.

Ductile, brittle, and quasi-brittle material behavior.
Ductile materials exhibit yielding before the specimen fail and withstand large strains before the specimen ruptures; brittle materials fracture at much lower strains and fail suddenly without much warning. The yielding region for ductile materials often takes up the majority of the stress-strain curve, whereas for brittle materials it is nearly nonexistent (Figure 1).
However, it should be emphasized that not all materials can be easily classified as either ductile or brittle. Many materials are quasi-brittle. They are moderately strain hardening prior to the attainment of their ultimate tensile capacity, reminiscent of the response of high strength metallic materials. However, unlike the latter, they are characterised by an increase in deformation with decreasing tension carrying capacity past the ultimate strength. Such a response is called tension softening. The materials that exhibit moderate strain hardening prior to the attainment of ultimate tensile strength and tension softening thereafter may be called quasi-brittle (Figure 1). The softening is due to many fracture processes, such as localised microcracking, bridging by coarser aggregates, and crack branching.
Included in the class of quasi-brittle materials are concrete, rocks, coarse-grained ceramics. Yet when attempts were made to apply classical brittle fracture theories of Griffith and Irwin to concrete, these proved unsuccessful in the sense that the onset of fracture could not be quantified uniquely by the critical stress intensity factor. It is known that the more the behaviour of quasi-brittle materials deviated from the linear elastic fracture mechanics (LEFM) predictions, the coarser or the more heterogeneous the microstructure of material became. The reasons for the lack of success of LEFM stem from the role of the fracture process zone (FPZ) in the response of all quasi-brittle materials are traditionally regarded as being brittle but in reality exhibit a far more sophisticated response. The scale effect is a manifestation of the more sophisticated response. Leicester [1] seems to have been the first to identify two fundamental causes of size effect in structures made from quasi-brittle materials, such as concrete, namely, the material heterogeneity (i.e. statistical size effect) and the occurrence of discontinuities in the flow of stress, such as at cracks and notches (i.e. deterministic fracture mechanical size effect). Hereafter attention to the size effect is emphasized [2] and it has already led to some useful extensions of fracture theory and new method for determining material fracture properties [3–6].
During the past few years, with the rapid development of computing power, numerical tools have become a good option for gaining some insight into fracture. Rabczuk [7] and de Borst [8] reviewed the computational methods to model fracture in brittle and quasi-brittle materials. The regularization techniques include nonlocal models [9, 10], gradient enhanced models [11, 12], viscous models [13], cohesive zone models [14, 15], smeared crack models [16], cohesive grain boundary integral formulation [17], and mesoscale bundle-of-bars model [18].
The computational methods for fracture include element erosion techniques [19–22], interelement separation methods [23, 24], embedded finite element method (EFEM) [25], extended finite element method (XFEM) [26, 27], meshfree methods (MMs) [28–30], boundary elements (BEMs) [31, 32], multiscale boundary element method [33], and cellular automaton model [34].
Among these computational methods, FEM method is the most robust one which can efficiently solve the elasticity-plasticity equation relating to the fracture opening. Two approaches, the discrete crack model and the smeared crack model were introduced to FEM by Ngo and Scordelis [35] and Rashid [36], respectively. Over the years, strong opinions have been expressed regarding both approaches. Nevertheless, it seems that recent developments in computational mechanics have narrowed the gap between these apparently disparate formulations [37]. For example, the cohesive segments method [37] or micromodel [38] approach can embody characteristics of both approaches and can behave as either. The basic characteristics of the latter which are adopted in the paper can be generalized as follows [38].
(1) By introducing the heterogeneity of material properties into the model, the approach can simulate the nonlinear deformation of a quasi-brittle material with an ideal quasi-brittle constitutive law; (2) by introducing a reduction of the material parameters after element yield, the model can simulate strain-softening and discontinuum mechanics problems in a continuum mechanics mode.
This work presents a procedure to simulate the growth and propagation of localized tensile cracks in quasi-brittle materials. A similar method of smeared crack, which consists in standard finite element method (FEM) and micromodel, is recovered and improved in order to represent crack localization and avoid spurious mesh-bias dependence in the discrete problem. This is achieved by means of the implementation of strain softening microconstitutive model and heterogeneity model which can reproduce individual (discrete) cracks and ensure objectivity of the finite element problem solution.
The present paper focuses on the influences of microscopic heterogeneity and softening rate upon Mode I elastoplastic fracture behavior. It is anticipated that this research would make a useful contribution for a better understanding of the effect of the micromechanical behavior upon the nonlinear fracture behavior of quasi-brittle materials.
2. Microconstitutive Model
Since each individual crack is not numerically resolved, the smeared crack model captures the deterioration process through a constitutive relation, thus smearing out the cracks over the continuum. It describes a cracked solid by an equivalent anisotropic continuum with degraded material properties in the direction normal to the crack orientation and no remeshing is needed, but mesh-bias dependence still exists.
The approach of the paper is similar to smeared crack method, but the simulated domain is needed to be discretized into large numbers of microelements to take into account of the small local variations of the material properties. At each loading step, the stress and strain in the elements are calculated and examined against the predefined material strength. Those elements with the stresses above the material's strength are considered to be isotropically damaged. The material properties of the damaged element are reduced and no equivalent anisotropic continuum is needed. When a microelement strain reaches the ultimate strain, the microelement fails and converts into a crack element with very small strength and elastic modulus. This approach can effectively simulate fracturing in rocks and without mesh-bias dependence [38].
2.1. Strain Softening Model
The primary reason for the observed deviation of the behaviour of quasi-brittle materials from the LEFM prediction is the formation of an extensive fracture process zone (FPZ) ahead of a preexisting notch/crack in which the material progressively softens. Therefore a fracture theory capable of describing the behaviour of quasi-brittle materials must include in it a description of the material softening taking place in the FPZ. Such a theory will necessarily be a nonlinear one. A detailed description of the methods for FPZ extent estimation was performed in [39, 40].
This strain softening model which is adopted in the paper is based on the Mohr-Coulomb model with nonassociated shear and associated tension flow rules, which is different from elastic damage constitutive model [38]. Cohesion and friction may soften after the onset of plastic yield and the softening can be obtained by defining the cohesion, friction as linear functions of a plastic strain. In the simulations, the total plastic shear and tensile strains are obtained at each time step, and the model properties vary to the linear functions accordingly.
The tensile yield and shear yield are both considered here. An element is considered to be yielded in the tension mode if its minor effective principal stress exceeds the tensile strength of the element,

where σ3 is the minor effective principal stress, and σ t is the tensile failure strength of the element.
An element is considered to be yielded in the shear mode if the shear stress satisfied the Mohr-Coulomb failure criterion,

where τ is the shear stress, σ is the normal stress, c is the stress cohesion intercept, and ϕ is the stress angle of friction or shearing resistance.
Once a microelement is judged to be yielded, the microelement is damaged and the material properties are reduced. The two softening parameters for this model, κ s and κ t , are defined as the sum of some incremental measures of plastic shear and tensile strain. The shear-softening increment for a particular tetrahedron is a measure of the second invariant of the plastic shear-strain increment tensor for the step and is given as

where

The tetrahedron tensile-softening increment is the magnitude of the plastic tensile-strain increment,

The shear-softening behaviors for the cohesion and friction are in terms of the shear parameter κ s . Tensile-softening of the tensile strength is described in a similar manner using the parameter κ t . After determination of the new stresses for the step, the softening parameters for the mesh element are updated. If appropriate, these parameters are then used to determine new values for the mesh element cohesion, friction, and tensile strength. When the plastic strain of a microelement reaches ε p , the microelement fails and crack propagates.
The stress-strain curves of strain softening model is depicted in Figure 2. A softening rate index N is defined as the ratio of plastic strain to elastic strain,

where ε e and ε p are shown in Figure 2. The index was used by Kurguzov and Kornev [41] to describe quasi-brittle behaviour.

Example strain-softening curve.
2.2. Heterogeneity Model
Heterogeneity is an important factor influencing the material behavior. Numerical tools incorporating heterogeneity can provide a better description of the mechanical behavior [6, 17, 18]. Statistical modeling has emerged as a promising technique for analysis of fracture in heterogeneous materials such as rock [42]. The combinations of statistical theory with numerical models such as the lattice model [43], the bonded particle model [44, 45], BEM [17, 33], cellular automaton model [34], or the RFPA model based on FEM [38] are found to be appropriate for modeling brittle materials such as rocks.
Assume that the local mechanical parameters are distributed following a certain probability distribution. Weibull's distribution describes very well the experimental data for the distribution of microdefects within rock [38]. Here, we assume that the elemental parameters (failure strength, friction angle, and cohesion) of material follow Weibull's distribution law. That is,

where σ is the element parameter, σ0 is the mean value of the element parameter and m is the homogeneous index. A larger m implies a more homogeneous material and vice versa. Figure 3 shows the shape of the probability density function with a typical homogeneous index.

The distribution of peak value of tensile strength (MPa) for five different heterogeneous specimens (the friction angle and the cohesion follow the same distribution).
3. Numerical Examples and Results
Figure 4 shows a rectangular plate with a span centre crack under uniform tensile stress along two sides of the plate. All analyses are based on the plane strain condition. The dimensions of the plate are 40 mm long and 40 mm wide and the crack length is 1 mm, which meet the LEFM requirements of geometry. The domain for simulation is discretized into meshes of 16,900 microelements. The Numerical simulation parameters are listed in Table 1.
Numerical simulation parameters list.


Finite plate with single edge cracked.
In accordance with LEFM, if the length of the FPZ is considerably smaller than the length of the initial crack ai, the stress intensity factor K I due to the stresses σ is calculated by the formula

3.1. The Variation of K I with Softening Rate
Figure 5 plots a set of curves of K I versus softening index N for the quasi-brittle material. Four kinds of softening index are considered and the material properties are kept homogeneous. From the curves in Figure 5, it can be seen that softening rate N exerts significant influence on the value of K I .

The influence of softening index N on K I .
The variation of K I value with external loading is rather small at lower stress stage. However, with increasing external load and the crack tip entering into a plastic state, the variation of K I value then increases rapidly. With the increasing of the external load, K I increases until a peak value is reached. The materials with larger N values have larger K I peak values.
The curves for effects of N upon the load/displacement are plotted in Figure 6. It can be seen that the materials with larger N have larger displacements under the same external load after strength peak and the slope of the load/displacement curve through the strain softening region is decreasing when N increases. That is to say, the larger the values of N are, the more ductile the material is.

The influence of hardening index N on load/displacement curves.
The effects of softening rate N upon the plastic zone are shown in Figure 7. It can be seen that the lengths of the plastic zone increase with the increasing of N, which indicate that a more ductile material has a larger plastic zone.

The plastic zone when crack initiation.
General belief is that the quasi-brittle materials have much lower tensile strengths than metallic materials and, therefore, have larger plastic zones. The results of the six simulations to the materials of the same strength and different softening index N showed that the softening index N has a great impact on the size of the plastic zone. More brittle materials have smaller plastic zones.
Figure 8 shows the development process of plastic zone which is consistent with the construction of FPZ evolving during fracture in quasi-brittle materials and the results of ReFraPro [47].

The development process of plastic zone (N = 9).
3.2. The Variation of K I with m
Five kinds of Weibull parameters m are considered and the softening index N is constant. Figure 9 illustrates the values of K I versus m. The effects of m on K I are intangible when the quasi-brittle material is under lower stress. The curves of K I versus load with different m values ramify when the external stress surpasses 0.17 MPa. The peak values of K I are higher if the values of m is larger.

The influence of Weibull parameters m on K I .
Figure 10 shows the load/displacement curves with different m. The curves depict three regions, that is, elastic region, plastic hardening region, and failure (strain softening) region after reaching peak load. The peak load is smaller with a lower value of m, which implies more heterogeneous material (a smaller m) is relatively weaker and less tough. The reason is that at lower Weibull parameters the quasi-brittle material has a broader peak stress distribution and weaker peak stress. Therefore, before the catastrophic material failure, the breaking of quasi-brittle material with weaker peak stresses can be relatively faster than that of more homogeneous quasi-brittle material at low stress levels.

The influence of Weibull parameters m on load/displacement curves.
Comparing Figures 5 and 9 and Figures 6 and 10, it can be found that the effects of m are significantly different from the effects of N. The effects of m can be significantly divided into three stages. The first stage is the elastic stage, the second stage is the plastic hardening and softening stage, and the third stage is the softening stage; five curves gradually converge. The m only has a significant effect at the second stage. But N has kept effect after entering into the plastic stage.
Figure 11 shows the influence of Weibull parameters m on plastic zone when initiation crack length is 3 mm. The term “plastic zone” used here is different with the traditional plastic zone which is a complete continuous area. In reality, the failure mechanisms in quasi-brittle such as cementitious composites are of a different nature (e.g., microcracking, aggregate interlock, crack bridging, and branching [48–50]). The m is smaller, the plastic zone is more dispersed and the crack is more tortuous.
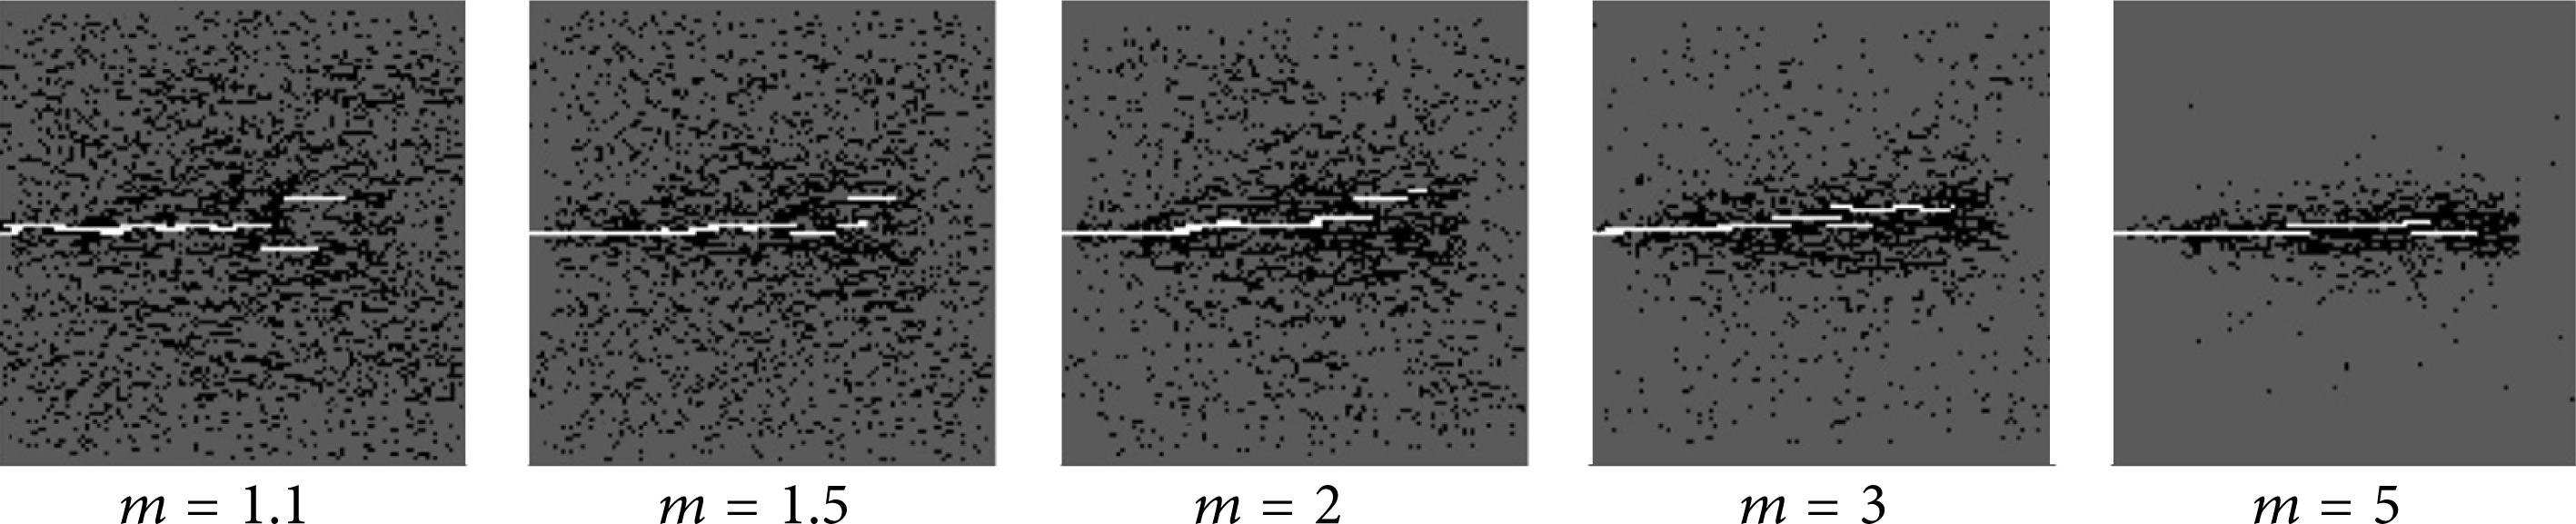
The influence of Weibull parameters m on plastic zone (initiation crack length = 3 mm).
Figure 12 shows the development process of plastic zone when m is 3. The plastic zone extent was estimated experimentally using acoustic emission (AE) scanning during fracture process [46]. The extent of the zones in which the AE sources were located (indicated by the small circles in Figure 13) in the specimens is then compared to the plastic zone in Figure 12. Very good agreement can be seen.

The development process of plastic zone (m = 3).

The damage zone estimated experimentally using AE [46].
3.3. The Variation of K Ic with Softening Rate Index N and Weibull Parameters m
It can be seen from Figure 14 that softening rate N exerts significant influences on the value of critical intensity factor K Ic . With the increase of softening rates, K Ic gradually increases and reaches a stable value. It can be found that the more brittle material has smaller plastic zone (Figure 7) and smaller K Ic .

The influence of softening index N on K Ic .
If K Ic is the basic characteristic of the material, it should be independent of initial crack length. From Figure 15, more ductile material requires longer initial crack length to achieve a stable K Ic . When the initial crack is long enough, even if N is large, the K Ic will reach a stable value; LEFM should be applied under this condition. So softening rate is not the reason for the lack of success of LEFM.

The influence of softening index N and initial crack length on K Ic .
Figure 16 shows four groups K Ic -m curve, and the parameters of each group curve are randomly generated again. Overall, the materials with larger m have greater K Ic , but there are some erratic fluctuations in each curve. The increase of initial length cannot eliminate the fluctuations (Figure 17). The erratic fluctuations are induced by heterogeneity. Crack extension is governed by the weakest element among the elements near the crack front. Mechanical characteristics of the elements are randomly distributed, thus K Ic show some erratic fluctuations.
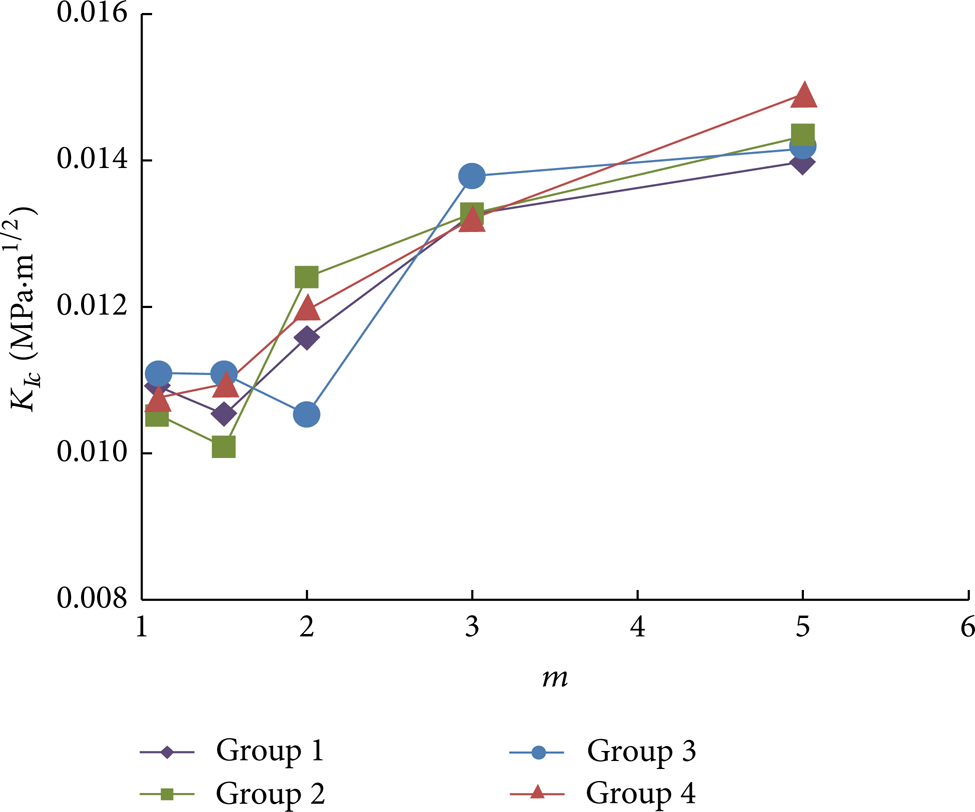
The influence of m on
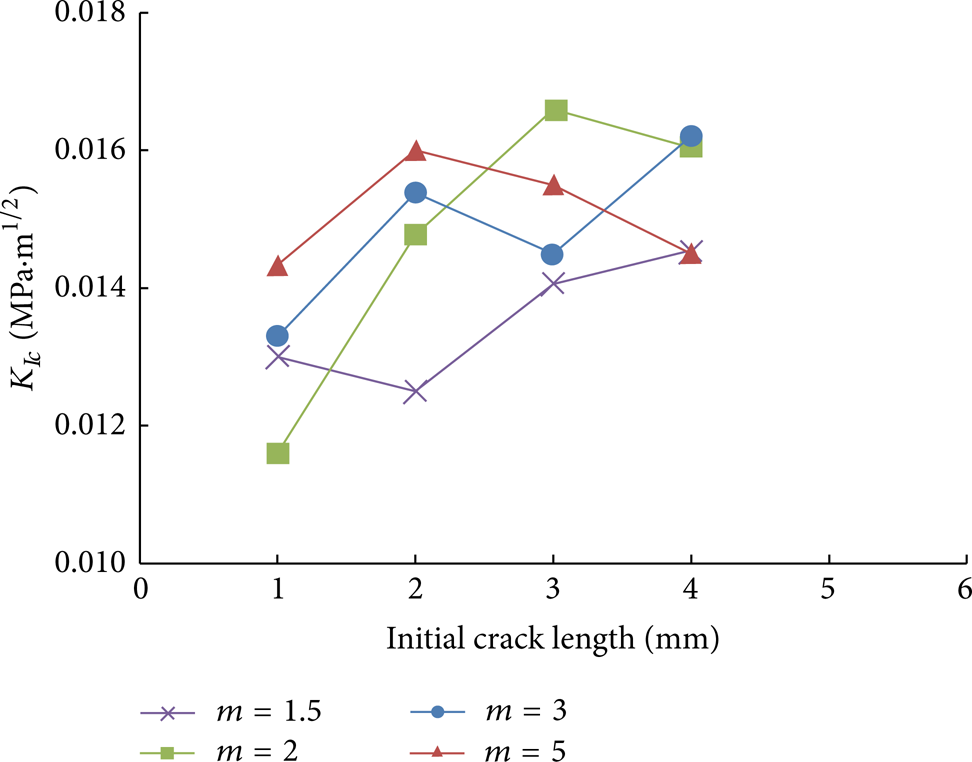
The influence of m and initial crack length on K Ic .
It can be found from Figures 11 and 12 that in heterogeneity materials, any crack or notch tips are blunted by the formation of a process zone ahead of them. The materials with more heterogeneity have more tortuous crack and branches, which agree with the in situ observation of Piotrowski et al. [51].
In this process zone the stresses are redistributed and energy dissipated which is thus not available for crack propagation, this is due to microcracking, aggregate interlock, crack bridging and branching, and so forth caused by heterogeneity. Softening rate of microelement only affects the size of the plastic zone (Figure 7). So it can be found that the far more sophisticated response of quasi-brittle materials than of brittle materials is mainly caused by heterogeneity.
4. Conclusion
Macroscopic material models of the continuum type, which have been traditionally used in structural analysis, may be realistic for simple loading scenarios. However, as loading histories become more complicated and, especially, as new phenomena, such as microcracking, aggregate interlock, and crack bridging and branching, come, accurate understanding of the material response can only be achieved via micromechanical analysis. In this context, the combination of microscopic softening rate and stochastic heterogeneity analysis via FEM is performed on meshes in which the first-level microstructure (sometimes called mesostructure) is explicitly discretized. The simulations of crack initiation and propagation process of the quasi-brittle materials under tensile loading are presented. The following findings were obtained from the numerical results.
For Mode I fracture in quasi-brittle material, the softening rate and stochastic heterogeneity clearly influence the value of K Ic and the size of fracture plastic zone.
Softening rate only affects the size of the fracture plastic zone and it is not the reason for the lack of success of LEFM.
The far more sophisticated response of quasi-brittle materials than of brittle materials is mainly caused by heterogeneity, which leads to the behaviour deviation of quasi-brittle materials from the LEFM predictions.
The approach and the subsequent findings as listed above provide a useful understanding of the effect of softening rate and microscopic heterogeneity upon the nonlinear fracture behavior of quasi-brittle materials.
Conflict of Interests
The authors declare that there is no conflict of interests regarding the publication of this paper.
Footnotes
Acknowledgments
The authors gratefully acknowledge the financial support of the National Basic Research Program of China under Grant 2010CB732100 and the National Natural Science Foundation of China under Grant 51278041.