
Abstract
A hybrid numerical method was used to calculate the flow-induced noise and vibration of the centrifugal pump in the paper. The unsteady flows inside the centrifugal pumps with different blade outlet angles were simulated firstly. The unsteady pressure on the inner surface of the volute and the unsteady force applied on the impeller were analyzed. Then the vibration of the volute and sound field were calculated based on an acoustic-vibro-coupling method. The results show that the pump head has increased 7% while the hydraulic efficiency decreased 11.75% as blade outlet angles increased from 18° to 39°. The amplitude of pressure fluctuation at the first blade passing frequency has decreased but increased at the second-order blade passing frequency as the angle growing. The total fluctuation power near volute tongue goes up about 12% every 3° increment of blade outlet angle. The results also show that vibrating-velocity of the volute at second-order blade passing frequency is much higher than at other frequencies, and the velocity increases rapidly as blade outlet angle varies from 18° to 39°. At the same time, the sound pressure level outside the pump has increased about 8.6 dB when the angle increased from 18° to 39°.
1. Introduction
Centrifugal pump is one of important auxiliary equipment widely used for transporting fluids through pipe systems, such as heating and cooling systems and water supply. Noise will be generated when the pumps work at various rotating speeds. However, noise and vibration generated by the pump are harmful to the acoustic stealth performance of the ships as the pump is running. As discussed by Jiang [1] and Tan et al. [2], the pressure fluctuation on inner surface of the volute and the unsteady force applied on the impeller are the primary exciting forces, which induce the noise and vibration of the pump. The method of predicting the noise and vibration generated by the former is presented in the paper, and the effect of blade outlet angle on the flow induced-noise is reported too.
Most previous noise-analysis work has focused on theoretical and experimental measurements or formulations. Choi et al. [3] designed an experiment on the generation mechanism of pump noise with a simplified model. By comparing the frequency features, it was found that the sound pressure produced by the interaction between the impeller and volute was much higher than the others. The interaction between the impeller and volute tongue was also studied by Parrondo et al. [4] based on numerical method. It was observed from the result that the acoustic source near volute tongue can be simplified as two dipole sources. Jiang et al. [5] also analyzed the pump noise with numerical method; by using the technology of fluid-solid coupling, the radiation acoustic field of a fresh centrifugal pump was predicted.
The influence factors on pump flow-induced noise such as the gap between volute and impeller, impeller geometric parameters, and blade loadings had also been analyzed by researchers in recent years. Based on an acoustic source separation method, Feng et al. [6] studied the influence of volute tongue gap on flow-induced noise of a small water centrifugal pump. The results show that the sound pressure level was decreased as increasing the volute tongue gap. Guo et al. [7] also got the similar conclusion. Wang et al. [8] predicted the radiation acoustic field of a centrifugal pump and analyzed the influence of geometric parameters as blade thickness, blade number, profiles, and so on.
The above summary shows that the researches are almost about the mechanism of flow-induced noise and the relationship between sound pressures with some important parameters, such as volute tongue gap and working points. However, detailed research about influence of the blade outlet angle on the flow exciting force, flow-induced noise, and vibration is insufficient. In this paper, the unsteady flow and hydraulic noise of a centrifugal pump were simulated for eight impeller models with different blade outlet angles, but keeping diameter of the impeller, blade inlet angle, and the volute the same.
2. Numerical Method
2.1. CFD Approach
The flow fields inside the centrifugal pump were simulated with commercial software FLUENT in the paper. The RANS simulation was completed firstly and the hydraulic performance of the pump was obtained. Then the unsteady flow field inside the pump was solved with large eddy simulation (LES) to catch the detailed characteristics of the unsteady flow. In LES, the three-dimensional time-dependent large-scale turbulent motion was resolved directly and the effect of the unresolved (or subgrid) scales was taken into account by appropriate subgrid-scale (SGS) models. The governing equations describing the behavior of the large scales are as follows [8]:
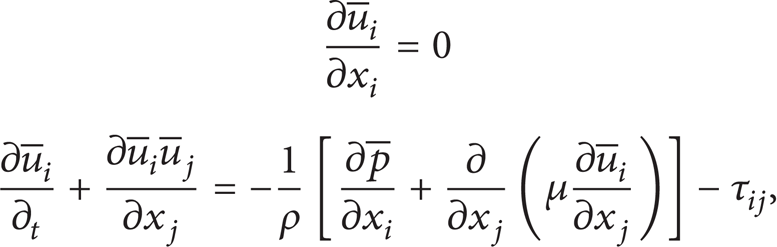
where, the overbars indicate the spatial filtering. ρ is fluid density and u, p, and μ are velocity, pressure, and viscosity of the fluid, respectively. tand x are time and space coordinate; τ ij is the subscale stress modeling. The subscripts i, j are the direction component of coordinate.
Because the computational domain was composed of rotating zone and static zones, moving reference frames (MRF) and moving mesh were used, respectively, for steady and unsteady calculation. The second-order spatial discrete scheme and implicit temporal scheme were applied for the simulation of the unsteady flows. Time step of unsteady flow was taken as 5.747 × 10⁻⁵'s; namely, the time impeller rotates through one degree. According to Nyquist criteria, the highest frequency which can be analyzed is 8700 Hz and it can completely meet the requirements as the primary fluctuating energy appears around the first blade passing frequency (abbreviated as BPF) and its harmonic frequency, and the fluctuating energy at high frequency is relatively low.
The boundary conditions involved in the case are solid wall, periodic boundary, inlet, and outlet. No slip condition was used for the stationary and moving walls. At the inlet, the mass discharge was appointed and the fully developed flow was supposed at the outlet.
2.2. Acoustic Approach
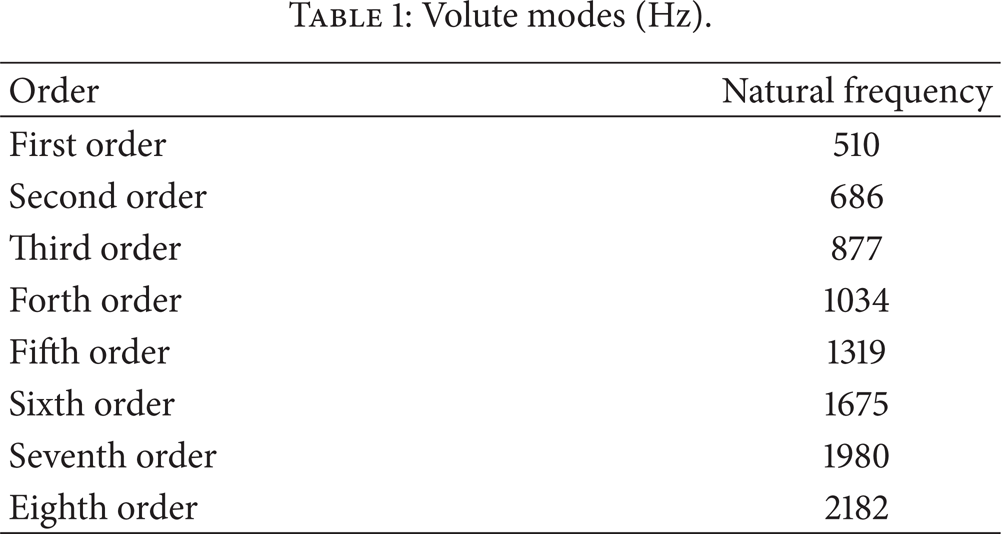
Figure 1 presents the process of calculating the flow-induced noise and vibration of the pump in the paper. Obviously, there are three important steps to complete the calculation. At first, unsteady pressure on inner face of volute had to be obtained by unsteady flow solver, and it was imported into the acoustic solver as exciting forces. The second is the analysis of vibrating modes of the volute, and fifty-order modes were also imported into the acoustic solver. The former eight-order modes of the volute are shown in Table 1. Finally, the noise and vibration induced by the unsteady pressure were simulated based on LMS Virtual Acoustic Lab. To consider the effect of coupling between the volute, the vibration, and acoustic field, acoustic-vibro-coupling approach was applied. The ducts at inlet and outlet were assumed to be infinite, so the no reflecting condition was used in the simulation. The details can be seen in [9].
Volute modes (Hz).

Schematic diagram of acoustic approach.
2.3. Validation
The unsteady flow in an axial pump and the flow-induced vibration of the pump were simulated to validate the CFD and acoustic approaches. The head of the axial pump is 6 m as it runs at discharge 1000 m3/h and rotary speed 1470 rpm. The blade number of the impeller is 4. Figure 2 presents the location of the monitors for flow field and vibration. Monitor A was an unsteady pressure monitor located on inner surface of the pump and was just placed at the inlet of the impeller. Monitor B was shifted 33 mm from monitor A along z-direction. Monitor C was a vibrating monitor located at the base flange of the pump. Two Dytran dynamic pressure sensors (2005 V) were employed to measure the pressure of monitors A and B, and a PCB three-way accelerometer was fixed on the base flange to monitor the vibrating acceleration. The dynamic data were acquired by LMS SCADAS mobile data acquisition system. The experiment pipe system was a closed circulation system, in which water tank and damping screens were employed to stabilize the flow. The flexible pipes and vibration isolators were adopted to control the effect of the motor and other pipe systems on the pump's vibrating.

Location of monitors in experiment.
Figure 3 presents the unsteady pressure of monitor A in time and frequency domains as the pump working at discharge 1000 m3/h and rotary speed 1470 rpm. The Figure shows that BPF is the primary frequency of the unsteady pressure. The magnitude of the fluctuating pressure at high order harmonic frequency is small. It also indicates that the simulation values fit well with the experimental values. The error between them at BPF (98 Hz) is about 38.6%. Figure 4 describes the unsteady pressure of monitor B at the same conditions. It can be seen that the numerical solution also coincides with the experiment well, and the error between them is about −11.6%.

Unsteady pressure of monitor A as pump working at 1000 m3/h and 1470 rpm.

Unsteady pressure of monitor B as pump working at 1000 m3/h and 1470 rpm.
The vibrating-velocity and acceleration induced by unsteady pressure applied on the wall were obtained based on acoustic-vibro-coupling calculation shown in Figure 1. Table 2 gives the acceleration level of the monitor C at BPF and the total vibration level from 10 to 315 Hz. The reference acceleration 10−6 m/s2 was used to calculate the acceleration level. The data show that the errors between numerical values and experimental values are not large. The difference of acceleration levels at blade passing frequency is only 0.3 dB. The results imply that the approaches employed in the paper are reliable.
Vibrating acceleration level of monitor C.

2.4. Computational Meshes
The head of the original centrifugal pump is 30 m when it is running at 100 m3/h discharge flow and 2900 rpm rotating speed. The main geometry parameters of the impeller are presented in Table 3 and Figure 5(a). To discuss the influence of the blade outlet angle, eight impeller models are generated just by varying the angle β2 from 18° to 39° with keeping other geometry parameters the same. The same volute is chosen to match all impeller models in the paper. Therefore, only the grid of impeller domain needs to regenerate for different cases. Because of the requirements of large eddy simulation employed in unsteady flow simulation, the y + value of the mesh just close to the wall was appointed as one. According to the analysis of the mesh independence of the numerical solution, the final grid number is set as 1.1 to 1.2 million for all cases. Figure 5(b) shows the meshes of the impeller area.
Main geometry parameters and rotating speed of the centrifugal pump model.


Mesh of volute and rotation area.
3. Results and Discussion
Figure 6 shows the pump head and hydraulic efficiency curves of centrifugal pumps with different blade outlet angles. The horizontal axis is the nondimensional rate of flow with rated flow discharge Q s . It can be observed that the pump head decreases while the efficiency increases as the rate of flow increasing from 0.7 Q s to 1.3 Q s . On the other hand, the tangential-velocity component at outlet of the impellers increases when the blade outlet angle varies from 18° to 39°, and so that the continuous rise of the pump head is observed. But the flow loss is also increased because of the increased variation in flow direction.

Performance of pump models with different blade outlet angle (n = 2900 rpm).
To observe the characteristic of the unsteady flow in the volute, five monitors were located on its inner face shown in Figure 5(a). Figure 7 gives the distribution of the pressure coefficient C p of the five monitors as the pump running at 1.0 Q s . C p is defined as follows:
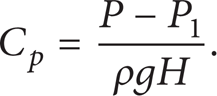
Therein, P is static pressure of monitors, P1 is its time-averaged static pressure, and H is the pump head at corresponding operating condition. It is found that the pressure of the monitor 5 near volute tongue fluctuates much stronger than that of other points. It can be inferred that flow near the volute tongue is the primary source of the flow-induced noise because of the violent interference between the volute tongue and the rotating impeller.
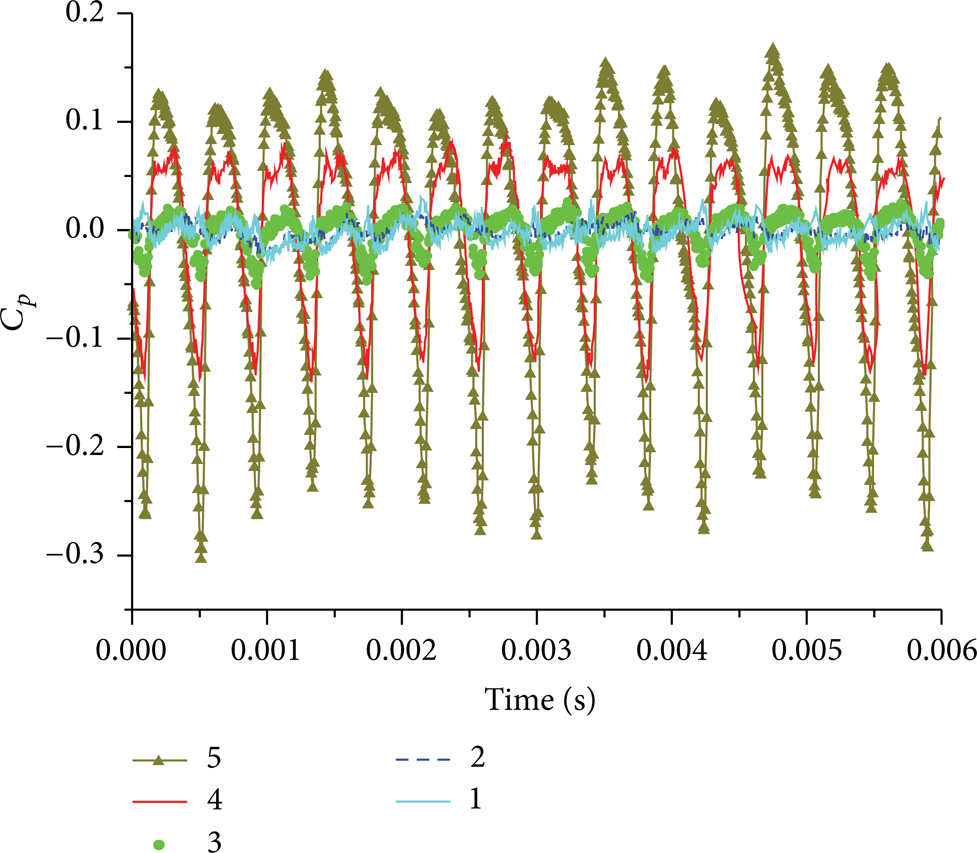
Distribution of unsteady pressure of five monitors (β2 = 33°, Q = 100 m3/h, and n = 2900 rpm).
Figure 8 presents the pressure distribution of monitor 5 with different blade outlet angle. Only two-fifth of rotating circle is shown in the figure, and T represents the rotating period. It can be observed that the coefficient fluctuation is raised as the blade outlet angle grows, but the increment is small. At times 0.1T and 0.3T, no obvious fluctuation occurred when β2 = 18° and 21°, while, as the blade outlet angle increases, the fluctuation intensity turns stronger.
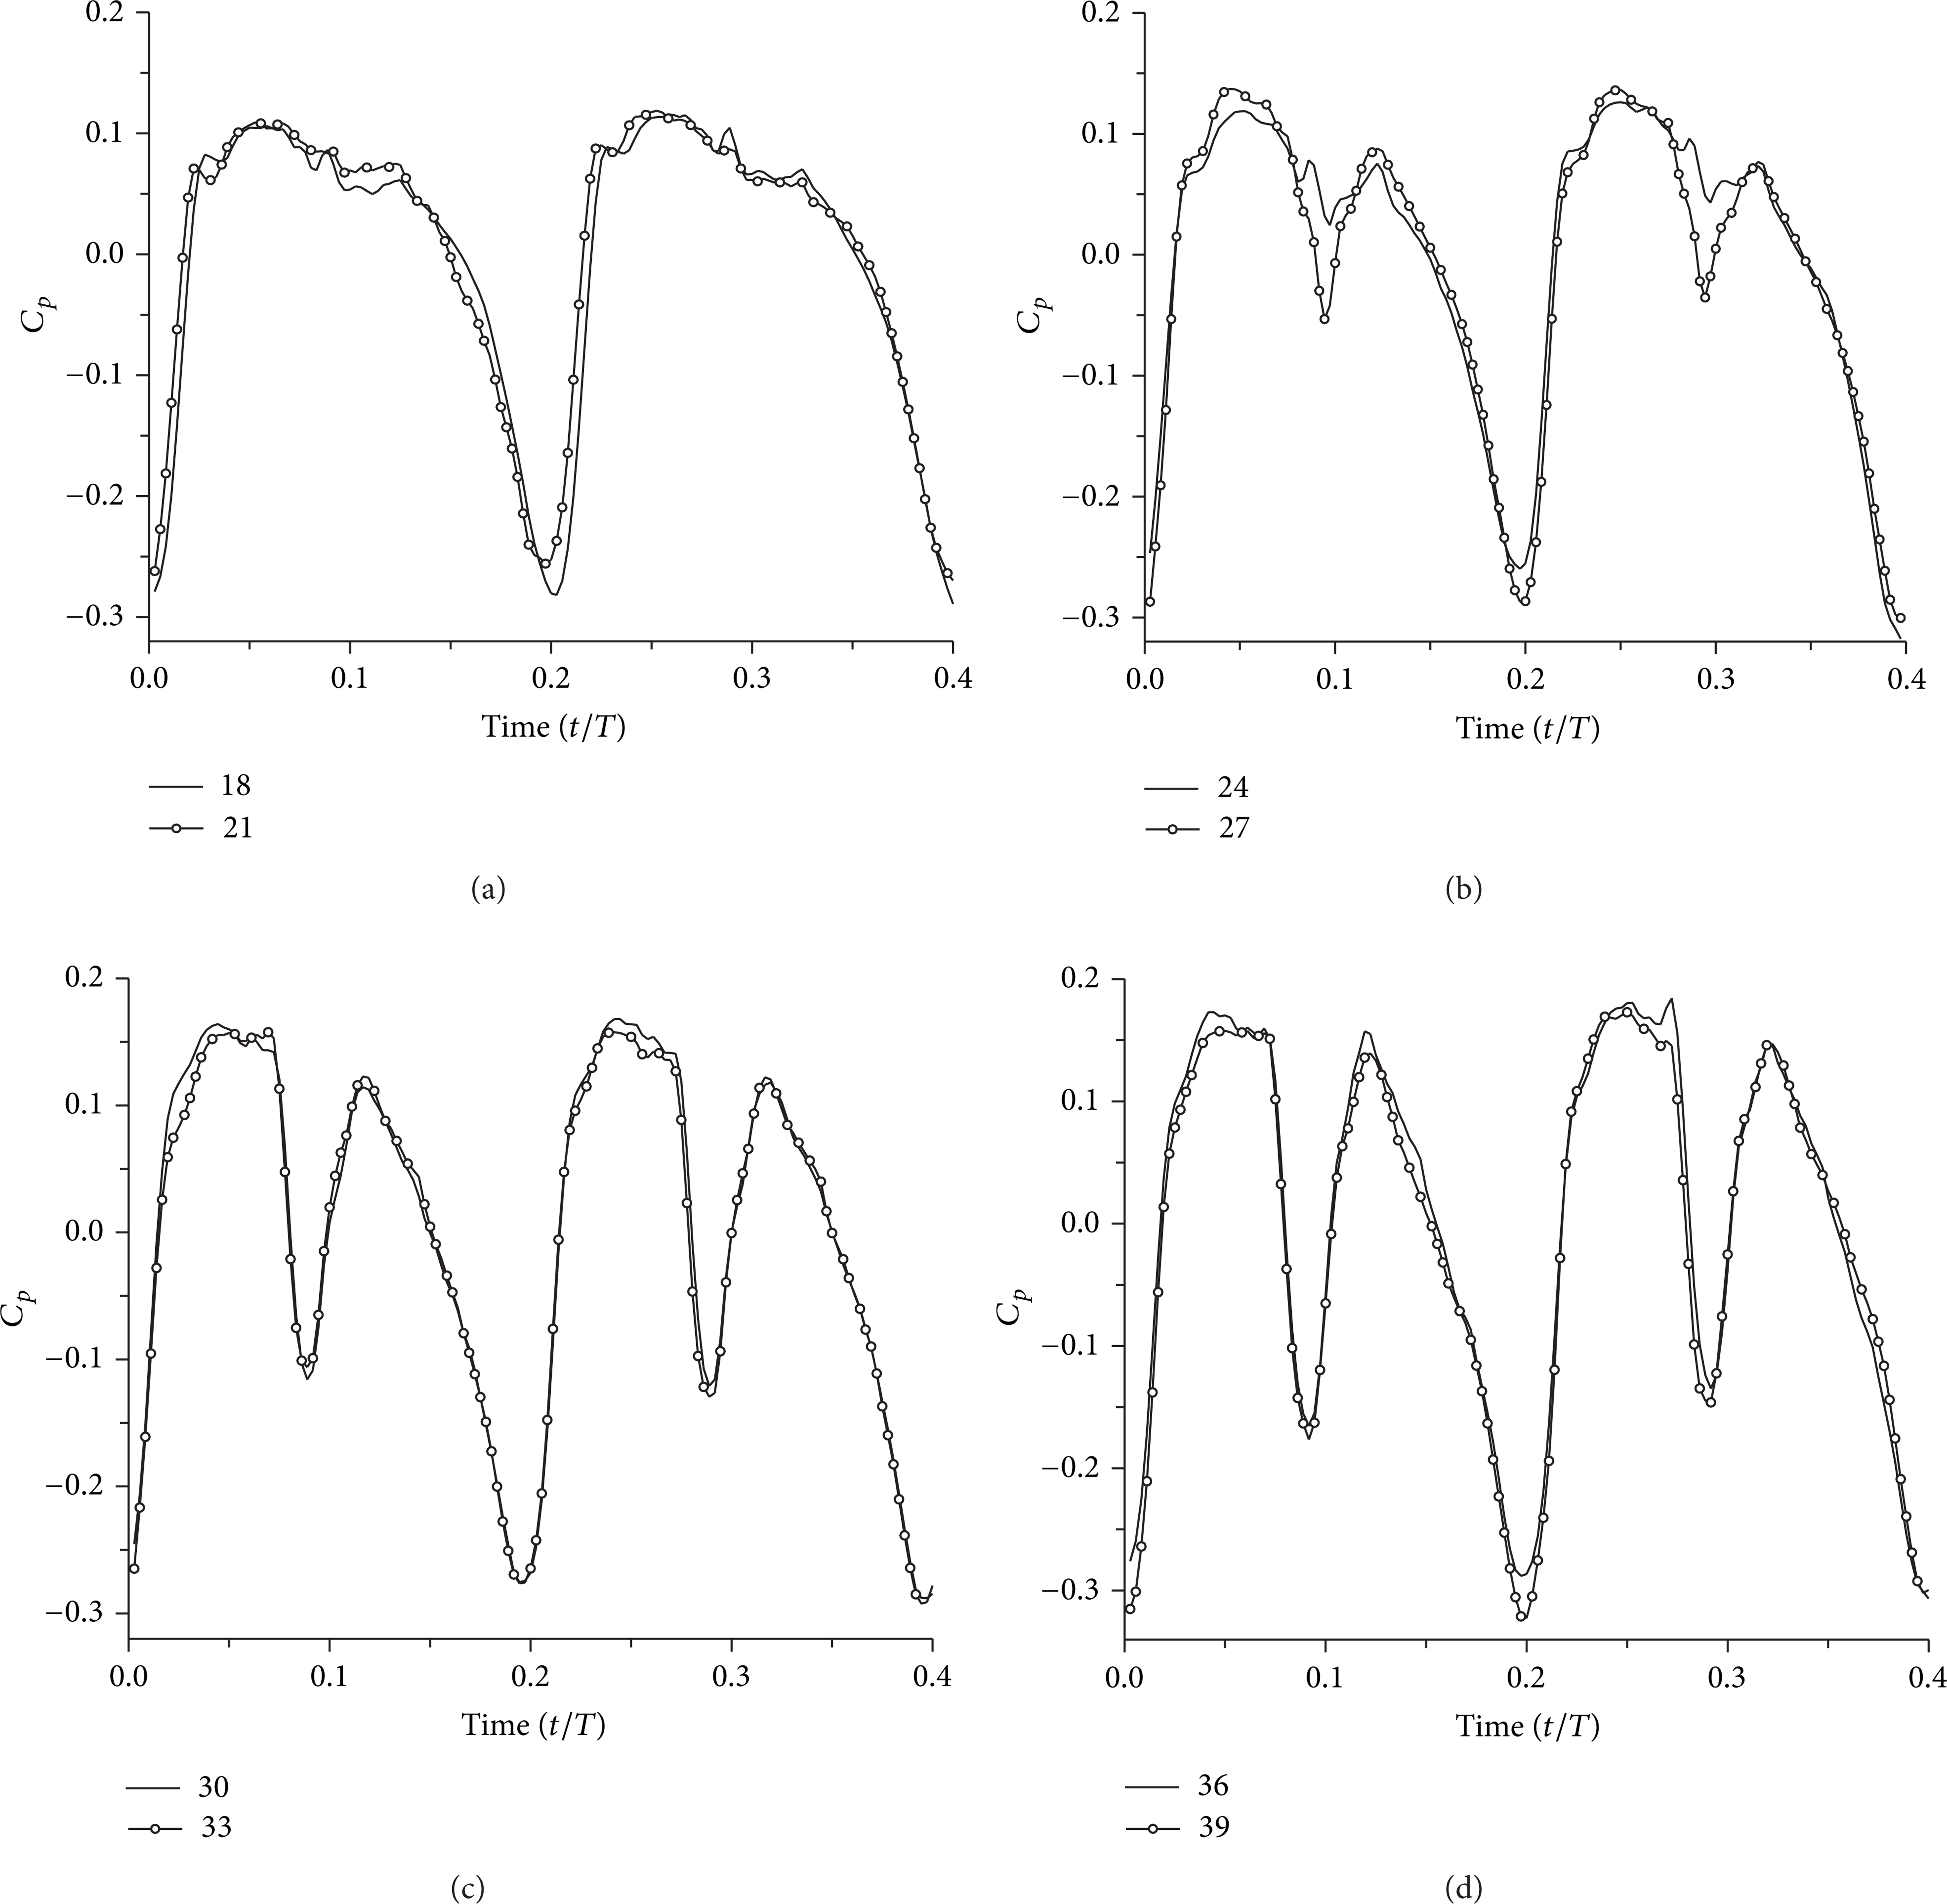
Pressure fluctuation of monitor 5 under different blade outlet angles (Q = 100 m3/h and n = 2900 rpm).
The frequency spectrums of fluctuating pressure of the monitors are obtained by FFT transfer. Figure 9 shows the frequency spectrum of monitor 5. S r is a nondimensional frequency defined as follows:

In this formula, f is frequency, Z is the number of blade, and n is rotation speed. Therefore, the first BPF just corresponds to S r equaling one. Figure 9 indicates that the fluctuating peaks mainly appear at the first BPF and its harmonic frequencies. It can be seen that the fluctuation at the second-order harmonic frequency becomes stronger as the blade outlet angle increases, while it turns weaker at first BPF.

Pressure fluctuation of monitor 5 in frequency domain under different blade outlet angles (Q = 100 m3/h and n = 2900 rpm).
The total pressure fluctuation power of monitor 5 is shown in Figure 10. The label of y-axis E v is defined as

A i is the fluctuating amplitude of the pressure, and fi is the first BPF and its harmonic frequencies. It is clearly shown that the total power of pressure fluctuation continuously grows as the blade outlet angle increases. It has increased about 12% as the outlet angle grows at 3°. This means that he fluctuating energy has grown.

Total power of pressure fluctuation of monitor 5 (Q = 100 m3/h and n = 2900 rpm).
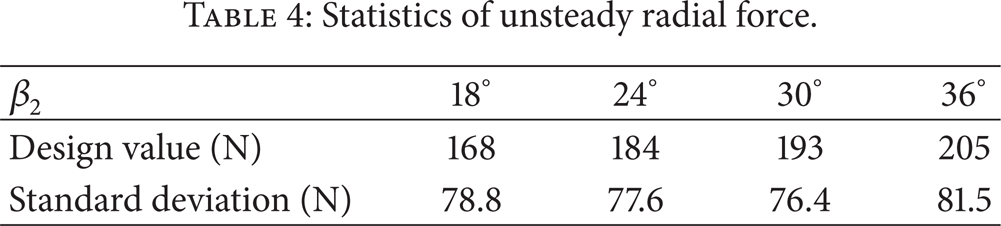
The unsteady forces applied on the impeller of the pumps with different blade outlet angles are shown in Figure 11. Fr and Fz represent the radial and axial component, respectively. Obviously, the unsteady force is periodical and the period is equal to blade sweeping period. The figure indicates that the amplitude of radial force component is larger than the axial one and the blade outlet angle may influence the intensity of fluctuating force. Table 4 gives the design value and standard deviation of the radial component Fr. It is seen that the standard deviation descends firstly and ascends as the blade outlet angle increases from 18° to 36° and the minimum appears at about 30° blade outlet angle. It implies that there is an optimal blade outlet angle which makes the radial fluctuating force minimum.
Statistics of unsteady radial force.

Unsteady force applied on the impeller with different blade outlet angles (Q = 100 m3/h and n = 2900 rpm).
Figure 12 presents four vibrating-velocity monitors and thirty-sixth sound pressure monitors to view the vibrating performance of the volute and the characteristics of outer sound field. Four vibrating monitors A, B, C, and D are located on the volute wall. The sound pressure monitors are set on a 1-meter-radius circle around the pump.

Distribution of monitoring points.
Figure 13 shows the vibrating-velocity of monitors A, B, C, and D as the blade outlet angle equaling 18°, 27°, 30°, and 39° from the first BPF to the fifth-order harmonic frequency. As can be seen from the figure, the velocity of every monitor at the second- order BPF is much higher than other frequencies. Because the vibration value was calculated by coupling sound field and volute modes, it can be observed from Table 1 that the first-order mode frequency of volute is close to the second-order BPF of pressure fluctuation and it is inferred that resonance maybe occurred at this frequency. The figure also indicates that the vibrating-velocity of monitor B is maximum relative to other monitors and the vibrating-velocity increases as the blade outlet angle increasing. For example, the velocity of monitor B with 39° blade outlet angle is 1.67 times that with 18° blade outlet angle.

Vibration velocity of monitoring points (Q = 100 m3/h, n = 2900 rpm, and β2 = 33°).
The vibrating of the volute wall has to radiate noise into the environment. The directivity diagram of radiation field around the pump models is shown in Figure 14. It can be seen that the SPL (sound pressure level) of the noise outside the pump is about 60∼70 dB. It also can be observed that the SPL increases as the outlet angle grows. This characteristic accords with the law of pressure fluctuation analyzed before. The increment of SPL is about 8.6 dB as the blade outlet grows from 18° to 39°.

Directivity diagram of radiation field of pump models under different blade outlet angles (Q = 100 m3/h and n = 2900 rpm).
It is not appropriate to directly compare the noise levels of the pumps because they have different pump head at the same flow discharge. A parameter PWL s is defined to evaluate the influence of blade outlet angle on the sound pressure level in the paper. PWL s is as follows:
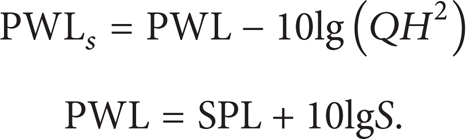
Therein, Q is volume discharge (m3/s), H is pump head (m), and S is area of the radiation surface (m2). This parameter represents the sound power level induced by the pump transporting 1 m3/s rate of flow and generating one meter head. The results are listed in Table 5. It can be clearly seen that the PWL s increase as the blade outlet angle grows. So, smaller blade outlet angle should be chosen due to the needs of low noise.
PWLs under different outlet angles.

4. Conclusion
A numerical method, which combines computational fluid dynamics with acoustic boundary element method, was used to solve flow-induced noise and vibration of the centrifugal pump models with different blade outlet angles in the paper. The results can be summarized as follows.
Under the same design parameters, the pump head increases while the efficiency decreases as the blade outlet angle grows.
The amplitude of pressure fluctuation at the first BPF has decreased and it has increased at second-order BPF as the blade outlet angel grows. The total fluctuation power near volute tongue of the pump model increases about 12% as the blade outlet angle grows every 3°.
Vibration velocity at second-order blade passing frequency is much higher than at other frequencies. It means that the coupling interaction of acoustic field and structure cannot be ignored for the prediction of flow-induced noise in the centrifugal pump.
As blade outlet angle increased from 18° to 39°, sound pressure level radiated by the vibrating volute has increased about 8.6 dB.
Conflict of Interests
The authors declare that there is no conflict of interests regarding the publication of this paper.
Footnotes
Acknowledgments
The work in the paper is supported by National Natural Science Foundation of China (no.51106099) and the leading academic discipline Project of Shanghai Municipal Education Commission (no. J50501).