
Abstract
Wireless sensor network technologies are experiencing an impressive development, as they represent one of the building blocks upon which new paradigms, such as Internet of Things and Smart Cities, may be implemented. Among the different applications enabled by such technologies, automatic monitoring of the water grid, and smart metering of water consumptions, may have a great impact on the preservation of one of the most valued, and increasingly scarce, natural resources. Sensor nodes located along water pipes cannot rely on the availability of power grid facilities to get the necessary energy imposed by their working conditions. In this sense, an energy-efficient design of the network architecture, and the evaluation of Energy Harvesting techniques to sustain its nodes, becomes of paramount importance. This paper investigates the suitability of a Wireless Metering Bus-based solution for the implementation of smart water grids, by evaluating network and node related performance, through simulations, prototype design, and experimental tests, which confirm the feasibility and efficiency of the proposal.
1. Introduction
Wireless sensor networks (WSNs) are becoming a pervasive technology to monitor very different systems, from wide geographical areas to small-scale phenomena (as in body area networks). They are able to promptly detect particular events or working conditions and deliver related information to a specific destination. WSNs are currently deployed in many application fields, such as buildings construction, traffic monitoring, environmental analysis, healthcare assistance, weather forecast, and many others [1–3]. WSNs can improve the way people interact with surrounding environment, to increase their quality of life, and reduce the wasting of natural resources (water, oil, and gas), while optimizing their usage. A relevant task from this perspective is represented by metering, that is, the capability of measuring the amount of a certain resource, available at a specific grid point. In particular, companies in the utility sector providing electricity, gas, or water services are clearly interested in advanced metering infrastructures (AMIs), to improve their real-time monitoring over consumptions and optimize plants management.
While the application of smart metering and monitoring solutions is now well established in the field of electricity distribution and power management, the situation is much less mature in the field of water plants management and monitoring. On the other hand, the availability of almost real-time data about water consumptions could enable a number of actions, such as control of water consumptions in a district, at a given time; planning of maintenance operations; dynamic water flow rate management; dynamic in-pipes pressure management, to reduce failure rates and optimize water delivery at the users’ outlets [4]. Obtained data can also help detecting leaks in water pipelines: indeed, a leak changes the hydraulics of the pipeline and therefore flow or pressure readings, after some time [5].
Water availability and consumptions represent critical issues that need specific tools to anticipate problems and resolve them proactively, to analyze data for better decisions, and to coordinate resources for operating effectively. In fact, water is needed and used, for more than drinking only. Global industry uses
Following the preliminary evaluations presented in [6–8], this paper analyzes the adoption of the Wireless Metering Bus (or in short WM-Bus) standard [9] in future smart water grids, for real time monitoring of water plants and leakages prevention. The M-Bus is a well-known field bus technology, specialized for transmitting metering data from gas, heat, oil, or other meters to a data collector. The WM-Bus represents the wireless implementation of the M-Bus standard; at the authors’ best knowledge, the WM-Bus has been adopted sporadically in power grid and gas metering applications, to deploy AMI solutions, but it has not yet found a significant adoption in the design of smart (i.e., ICT-enabled) water distribution infrastructures. This is due partly to their still relatively scarce development, partly because of the adoption of different wireless techniques, often proprietary, or borrowed from other applications (such as ZigBee-like transmission techniques). Water distribution networks are typically set up as cyber physical systems (CPSs), with related sensing and actuating technologies for monitoring and maintenance operations, only till the hierarchical level of districts. Most of the water distribution systems totally miss dedicated ICT capabilities at the edge branches of the network, from the district-level node to the final meters, located at the customers’ premises. A capillary network operating according to the WM-Bus standard can provide a viable and effective solution to implement an overlay ICT infrastructure that fills in the technology gap in the edge domain of water distribution networks. The goal of this paper is to outline an integrated approach, encompassing the transmission technology for the capillary network, the design of the smart devices to be applied on water meters, and the evaluation of the channel behavior affecting the link performances, to achieve a smart water grid reference design, which also takes into account the problem of powering the nodes and enabling reliable data transmissions. The main contributions of the present research work deal with a performance analysis of the different WM-Bus modes on a real embedded platform, according to a holistic approach addressing packet error rate, transmission coverage, and message collision probability, and with a comparative evaluation of the different WM-Bus modes from the point of view of battery lifetime and Energy Harvesting (EH) sustainability, in particular with reference to the smart water grid applicative context.
The paper is organized as follows: Section 2 discusses the state of the art in the field of smart water grid technologies and projects, whereas Section 3 focuses on the WM-Bus protocol selected for the proposed solution, its related message formats, and transmission profiles. In Section 4, a prototype development of the WM-Bus peripheral nodes and gateway for the smart water grid is presented. Section 5 deals with the results of preliminary experimental evaluations performed on the prototype nodes and discusses the possibility to involve Energy Harvesting modules, to supply the required energy. Finally, Section 6 concludes the paper.
2. Overview of Smart Water Grid Technologies
Most of the WSN implementations proposed in the technical literature rely on the ZigBee (or IEEE802.15.4 based) short range radio communication technique, over the 2.4 GHz band. In the context of smart metering, the first version of ZigBee Smart Energy (ZSE) profile was ratified and published, in 2008 [10]. It was driven by many market players and a variety of products were certified only a few months after the standard was finalized. ZigBee Smart Energy version 2.0 provides new capabilities, such as control of plug-in hybrid electric vehicles (PHEVs) charging, home area network (HAN) deployments in multidwelling units, such as apartment buildings, support for multiple energy service interfaces into a single premise, and support for any transport based on IETF IP compliant protocols, such as ZigBee IP specification. It is basically designed for energy-related scenarios and less general purpose than the W-MBus protocol. Other protocols for different kinds of short range wireless networks also exist, as the 6LoWPAN protocol [11], which supports IPv6 over IEEE802.15.4. These solutions foresee nodes equipped with IP stack: the design of the single node has to face an increased complexity (each node needs some processing capability, memory, and power supply), but the network management and data communication are made easier, by the adoption of the standard IP architecture and related protocols.
On the other hand, due to the lack of a common network layer, ad hoc solutions, not based on IP, require an application-layer gateway to communicate with other systems, or even the wider Internet. Gateways provide a mapping between different protocols, with a significant effort in functional and semantic translation. In this sense, complexity is shifted from the edge node to the core of the architecture. This approach may be valid when the application scenario requires minimizing complexity at the edge of the network infrastructure, where the available resources (processing, memory, and power) are very limited. Such a condition holds in the case of smart water grids: sensor nodes of minimal complexity are located at the boundaries of the water plants (i.e., at each user's premise, either urban or rural), where even power supply may be a concern, whereas concentrators (acting as gateways) may be installed in intermediate positions, where weaker constraints about power supply or processing resources hold. This is the reference architecture considered within this paper, in the framework of which the WM-Bus protocol is evaluated, as the selected solution for the transmission of metering and quality-related data, generated from sensor nodes located along water plants.
Research related to monitoring water distribution systems has increased in recent time. The availability of continuous monitoring is critical to detect any change in water quality or pipeline health, such as damages or water leakages. Several solutions based on WSNs for water grid are reviewed in [12], where the main operational challenges to face are evidenced. Among them, the need of suitable power supply for peripheral nodes is a critical factor. Most of the current solutions proposed in the technical literature, or available on the market, rely on batteries to feed the leaf nodes and sensors, which cannot be connected to the power grid. But the difficulties related to maintenance and substitution of batteries and their relatively short lifetime (with respect to the very long lifetime of the water grid pipelines) make such a solution not completely satisfactory or reliable. In [13], the authors outline the application of a WSN for monitoring a common water treatment process. The WSN is arranged in a simple star topology configuration, with the base station acting as the central hub; wireless communications are carried out by an 868 MHz RF transmitter. Issues related to power supply for the network nodes are not discussed. A WSN to monitor water distribution systems is presented in [14], and the main focus of the paper is on the need of defining a suitable model for the underground-to-above-ground communication channel, in order to properly estimate the performance of a wireless transmission from a sensor node to a gateway, and the related power requirements. The results provided by such a channel definition are then used to estimate the maximum operating range for any sensor node working according to the IEEE 802.15.4/ZigBee transmission standard, in the 2.4 GHz band.
Despite the challenges ahead, smart grid technology for water makes plenty of sense and deployments of new technology will be steady. Beyond improved metering, emerging solutions involve new algorithms to optimize water release in urban areas depending on the real needs [15, 16], new sensor capabilities for better leak detection [17, 18], enhanced monitoring of water quality, and the ability to better detect security threats to water systems. The drivers for smart grid technology in water are compelling: worldwide demand for water is expected to soar 40% from current levels, according to the 2030 Water Resources Group [19]; and losses from unmetered water total $14 billion in missed revenue opportunities each year, according to the World Bank [20]. These drivers will help fuel a move to smart technology solutions that promise more efficient water systems. Evidence of this trend continues to mount. A few examples include, among the others, Australia's Sydney Water that began deployment of high-efficiency meters to replace its aging stock; the three-year program will enable Sydney Water (which serves 4.6 million people) to eventually take advantage of automated and advanced metering technology. In England, Thames Water is extending a smart grid trial in the town of Reading to the city of London to better manage consumption and leakage. In Charlotte, NC, a public-private effort called Smart Water Now is taking place to measure consumption and improve efficiency; the city has partnered with private industries to collect information with the aim of lowering operational costs and improving sustainability.
In the next future, the adoption of WSNs in the field of water distribution monitoring and consumption metering will probably undergo a large market growth, if policy makers and national institutions will recommend or enforce the massive use of smart meters and monitoring systems, to control water distribution, detect leaks, and preserve water resources.
3. The WM-Bus Protocol
Short or medium range communication technologies must ensure minimum power consumption. ZigBee or other solutions based on IEEE 802.15.4 have been widely used for low-power sensor networks, but other protocols, such as the WM-Bus, have been recently proposed by the Open Metering Systems group [21] for metering scenarios. WM-Bus transceivers require low energy thanks to a low-overhead protocol, transmission-only modes (which do not require an idle receive phase), and long range sub-GHz transmission bands. While the first document (EN 13757-4:2005) prescribed the use of the 868 MHz ISM and 468 MHz bands, the later version (EN 13757-4:2011) added new transmission modes at 169 MHz, with lower data rates. The lower 169 MHz frequency band enables longer transmission range due to the inherently lower path losses, while the reduced data rates enable higher sensitivity for the receiver, allowing a reduction of the transmission power at the transmitter, or a longer transmission range, at a parity of the transmission power.
Based on the specific application, there are combinations of communication modes for data collectors and metering devices. These settings define the communication flow and the configuration of the radio channel. Table 1 lists the available communication modes.
Operating modes of Wireless M-Bus.

The basic WM-Bus modes of interest are the following ones:
T mode: frequent transmission mode (several times per second or per minute), 868 MHz, 100 kbps data rate from meter to gateway; in mode T2 the transmitter requires an acknowledgment (ACK), different from T1;
S mode: stationary mode (several transmissions per day), 868 MHz, 32.7 kbps data rate; in mode S2 the transmitter requires an ACK, different from S1.
Further, in the 169 MHz band, the standard also foresees the following modes:
Nc mode: 169.431 MHz, 2.4 kbps data rate; N2c requires ACK, N1c does not;
Na mode: 169.40 MHz, 4.8 kbps data rate; N2a requires ACK, N1a does not;
Ng mode: 169.437 MHz, 38.4 kps data rate; it always requires ACK;
and submodes:
N1a-f: one-way transmission; the node transmits on a regular basis to a stationary receiving point; single hop repeaters are allowed;
N2a-f: two-way transmission; the node transmits like N1a-f; its receiver is enabled for a short period after the end of each transmission and locks on if a proper preamble and synchronization word is detected.
The WM-Bus link layer is compliant with EN 13757-4:2011.10. It provides services that transfer data between PHY and application layer, generates outgoing CRC, and verifies CRCs for incoming messages. Further, the link layer provides WM-Bus addressing, acknowledges transfers for bidirectional communication modes, deals with WM-Bus frame formation, and verification of incoming frames. Two frame formats are foreseen, named A and B, identified by a specific preamble/synch sequence. The standard provides a number of predefined messages that are not used to carry application-specific data (that depend, for example, on the specific sensor used to monitor the grid), but to manage operational conditions. As an example, a three-way handshake is foreseen during the meter installation step, to enable the meter registration at the concentrator. Once registered, the meter automatically leaves the installation mode, whereas the concentrator requires manual intervention or timeout. Figure 1 shows the three-way handshake process featuring the meter installation step.
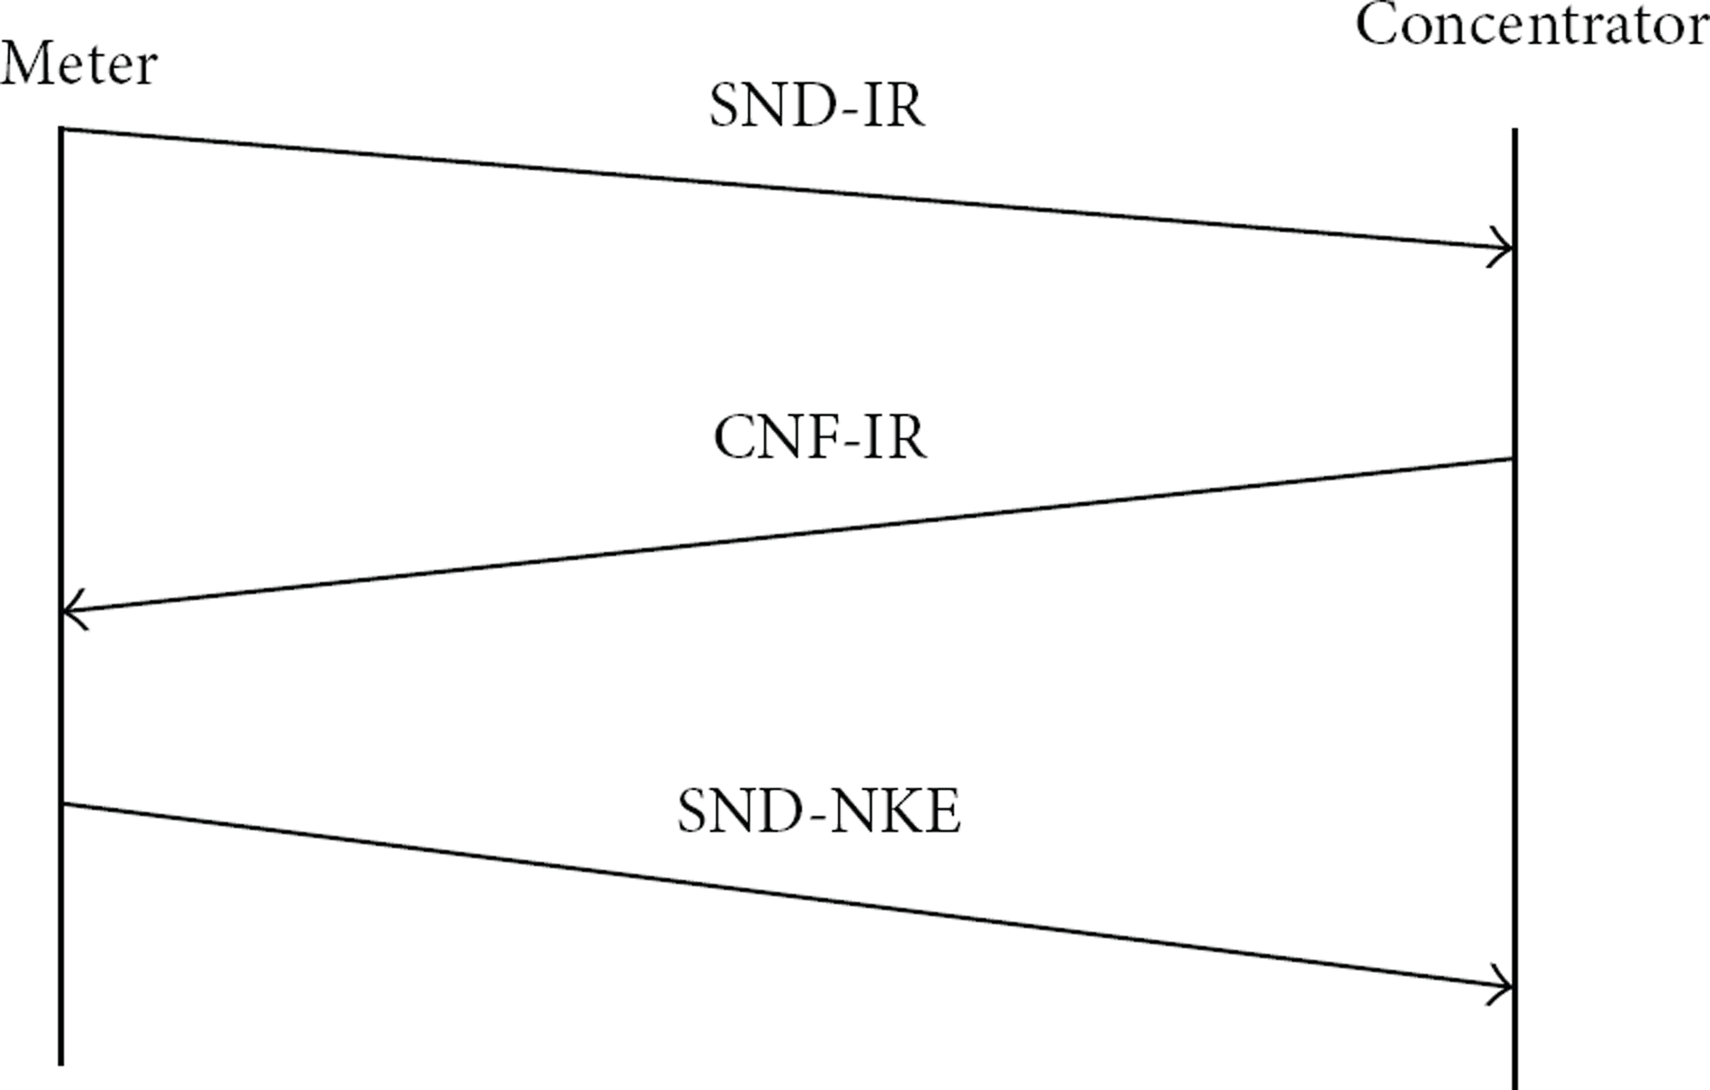
WM-Bus three-way handshake for the meter installation step.
The advantages of the 169 MHz band with respect to the 868 MHz are implicitly related to the narrowband transmission concept. The greater the bandwidth, the greater the noise at the receiver input: so, with a signal bandwidth of 25 kHz or less, the N mode introduces much higher link budget and provides longer range solutions than the ones allowed at 868 MHz. A narrowband solution results in a radio performance improvement without significant problems, because the amount of data to be transmitted in a metering scenario is very low, thus avoiding bottlenecks that would slow down the entire network performance.
The WM-Bus protocol also foresees the division of the available bandwidth in a number of channels. Up to six channels can be allocated for the data exchange between meter and concentrator, spaced by 12.5 kHz. If only one channel is not sufficient to meet the bandwidth requirements of the smart water grid, it is possible to consider the simultaneous use of more channels within the same interference domain. Such a frequency division multiplexing (FDM) capability is exposed to potential adjacent channel interference phenomena, but experimental tests have shown that the interference cancellation filters onboard of the WM-Bus transceivers are more than able to reduce the interfering signal power level 20 dB lower than the power level of the channel central frequency.
Another evident advantage of the 169 MHz band is related to the reduced path loss experienced by the propagating radio signal. The path loss exponent n in the generalized Friis’ equation on propagation loss [22] varies according to the characteristics of the propagating environment, as detailed in Table 2. For
Typical values of the path loss exponent n.

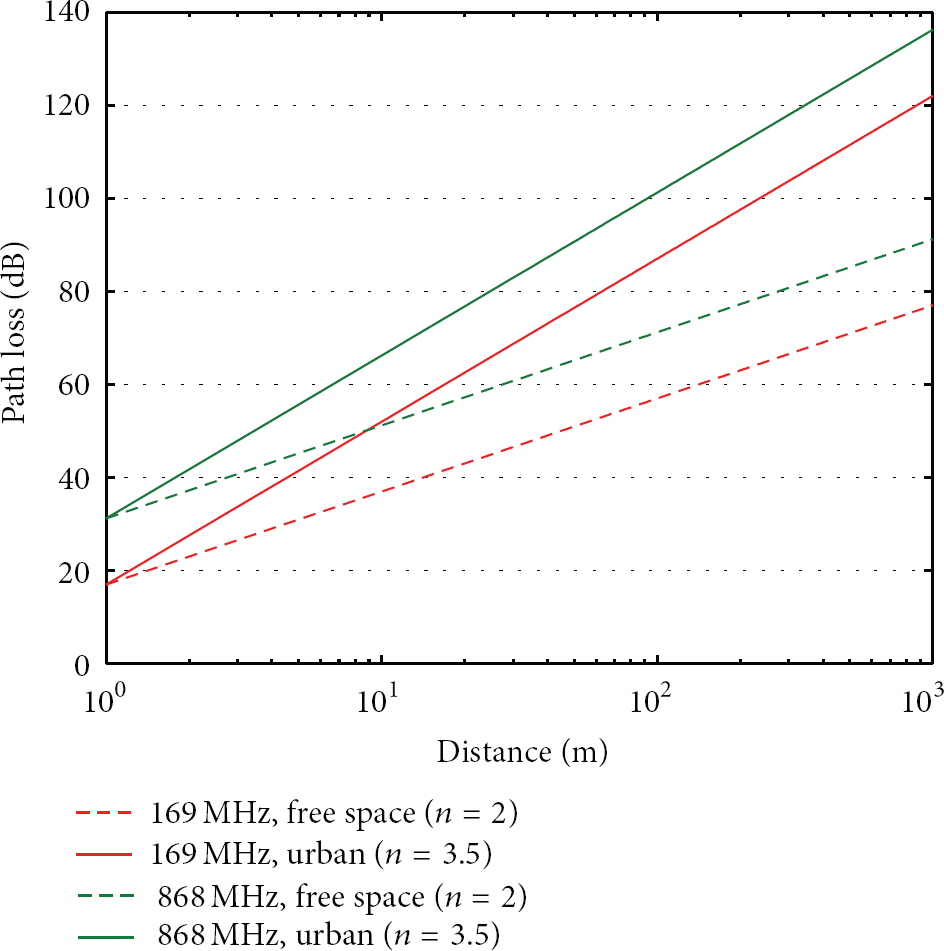
Path loss profiles at 169 and 868 MHz for different values of the index n.
The WM-Bus is able to achieve longer distance communication with respect to IEEE 802.15.4. Leaf nodes equipped with ZigBee/IEEE 802.15.4 transceivers can only cover a few tens of meters. Should greater distances be covered in ZigBee/IEEE 802.15.4 technology, a multihop data transfer strategy can be foreseen, according to which each leaf node can also act as a relay to another node, depending on the distance from the master node. Obviously, the ability of relaying depends both on the estimated amount of data each leaf node may generate and on the overall transmission capacity of the single ZigBee transceiver that must act as a relay: therefore it will be necessary to plan the placement of the nodes, once provided the amount of data to be transferred. Although the WM-Bus enables long ranges, it also provides relaying method to cover longer distances, by multihop techniques described in [23].
4. Prototype Implementation of a WM-Bus Solution for Smart Water Grids
4.1. Network Topology for the Smart Water Grid
The deployment of water grid networks is a basic step in the delivery of AMI services, besides enabling a continuous, prompt, and reliable monitoring of the water plants. In AMI scenarios, sensor nodes are usually displaced for domestic or industrial water accounting purposes, in a typical communication architecture that is organized according to a hierarchical topology, as the one shown in Figure 3. Peripheral WSN nodes are connected to master nodes, which act as gateways by collecting data and sending them to a centralized control and monitoring system, where data are stored and processed.

Sample WSN architecture for the water grid.
The hierarchical topology relies on the assumption that peripheral nodes are able to perform short or medium range radio transmissions, at low power consumption. On the contrary, master nodes are typically equipped with long range transmission capabilities, up to a geographic scale. Data generated from several peripheral nodes are collected and organized by each master node, so that they can be delivered to the central monitoring unit, where they are processed by suitable algorithms, to identify and locate possible faults along the pipes, in a real time fashion. Each network element, especially the numerous remote nodes, shall be designed in such a way as to keep global maintenance operations at a minimum.
The architecture proposed for the monitoring network assumes master nodes equipped with GSM/GPRS modules. In fact, master nodes that collect monitoring-related data from multiple leaf nodes must be able to deliver them to the central unit, typically along distances of a few kilometers. Long range transmissions generated by master nodes are sustained by power supplied from the grid, or from solar cells; short/medium range communications, as those of leaf sensor nodes, must require the minimum power consumption, usually provided by batteries. At the same time, in order to limit the overall costs related to the water grid deployment, the number of peripheral nodes should be somehow kept small. Based on the analysis of these requirements, the WM-Bus standards is assumed as a good tradeoff among the power needs due to radio transmission and the minimum coverage range necessary to limit the number of sensor nodes that shall be located along the water grid.
4.2. Sensor Node Implementation
Through the use of a suitable Texas Instruments (TI) development kit [24], a prototype node is implemented, which is useful to evaluate the performance of the WM-Bus protocol, in a possible and realistic smart water grid scenario. The kit provides a complete development platform for TI's Sub-1 GHz devices, comprising two SmartRF Transceiver Evaluation (TrxEB) boards, which include an MSP430F5438 MCU [25], a USB interface, a dot matrix LCD, and other useful features. A fully integrated single-chip radio transceiver, the CC1120 [26], is used, mainly intended for the ISM and SRD frequency bands, in the ranges 164–192 MHz, 410–480 MHz, and 820–960 MHz. The RF implementation guarantees good performance in terms of covered area, and power consumption. The output power can be increased up to +27 dBm (500 mW) by equipping the module with a power amplifier. The available application note [27] has been fruitfully used to develop WM-Bus applications. In the experimental tests performed, one of the boards shown in Figure 4 acts as sensor node and the other as gateway.

TI boards used to implement prototype WM-Bus sensor node and gateway.
4.2.1. Estimation of WM-Bus Power Requirements
The power requirements of the WM-Bus protocol have been estimated by measuring the related currents. It is not a trivial task, when currents are in the sub-mA range, as in low power modes (LPMs): the device awakens from sleep only a few times a day for transmission; hence the main current draw is due to sleep currents. To measure the current at steady state, a current probe (picoamperometer) could be added in series to the supply circuit. However, to measure peak and transient current draws, an oscilloscope must be used. This requires reading a voltage across a precision resistor, by applying Ohm's law. For sub-mA currents, the voltage must be amplified by a precision amplifier [28] and realized as shown in Figure 5. The amplifier used in experiments is an AD621 from analog devices, which provides a 100 V/V gain up to 200 kHz, whereas the load is a 10 Ω resistor, yielding a gain factor equal to 1000.

Measurement setup to evaluate WM-Bus related currents.
4.2.2. MSP430 Power Consumption
In the active state, and in the sleep mode LPM3 (low power mode 3) of the MCU, the steady state current draw has been measured by using a picoamperometer. To achieve the minimal power consumption, the MCU and its peripherals must be initialized properly and/or shut down. The measured current draw in LPM3 amounts to 2.7 μA, very close to the figure of 2.1 μA reported in the device datasheet. Other possible LPMs were discarded as not adequate for the application scenario of interest. For instance, LPM0 keeps all the system clocks running, thus yielding a current draw of about 85 μA; LPM4 disables the CPU and all the clocks, yielding the lowest possible current consumption, around 0.1 μA. However, the latter mode requires an external circuitry to transmit a wake-up signal, which is out of the current research focus.
Differently from the LPMs, the measure of active MCU current draw gives many degrees of freedom, for example, choice of the clock frequency, FLASH or RAM use, selection of active peripherals, CPU instructions, and so forth; hence the measured value must be considered indicative of average MCU energy requirements. In the water metering application scenario no particular computational power or processing speed is required. As a consequence, the clock frequency was kept to the lowest value of 1 MHz; all the peripherals were disabled, together with the clock signals (as a consequence, user-specific application will require accurate profiling of peripherals power requirements). The CPU cycled in a while loop, performing memory reading and writing and arithmetic instructions, to simulate a moderate CPU workload. In this case the measured MCU consumption is 370 μA, very close to theoretical datasheet figure of 330 μA.
4.2.3. CC1120 Power Consumption
To measure transient and peak current, a Tektronix TPS2024B oscilloscope was connected to the setup shown in Figure 5. The transceiver supply current ran through a 5 Ω shunt resistor. Values read are thus amplified and transformed from amperes to volts. Typical time profiles of current drawn by the transceiver (top), and the MCU (bottom), are shown in Figure 6, whereas Table 3 lists the measured current consumptions. The protocol requires a transmission phase, corresponding to the initial high current peak featured by the transceiver, followed by a longer receive phase, providing the subsequent flat in the transceiver current measure. The MCU requires an almost constant current during the active phase, with a slightly higher average value during the transceiver transmission phase. Before and after its activation, the MCU is in a sleep state, and the transceiver is idle.
Measured current consumptions for the CC1120 transceiver.


Current profile for the CC1120 transceiver (top) and the MSP430 MCU (bottom), during the transmission of a WM-Bus message in the N2g 38.4 kbps mode. Please note that the oscilloscopes read the transceiver current values from a 1 Ω resistor, while the MCU values are amplified and transformed into voltage signals, by the setup of Figure 5.
4.3. Protocol Energy Requirements
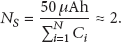
The energy requirements exhibited by the protocol are evaluated for a single communication cycle, on a bidirectional link, at an operational frequency of 169 MHz and 868 MHz respectively, assuming the hardware and the firmware stack described above. All the transmissions are performed at a 15 dBm radiating power. To perform this test, Wireless M-Bus packets of 96 bytes are considered. This value is required to calculate the transmission period at the different data rates, according to

4.3.1. Energy Requirements at 169 MHz
The WM-Bus protocol prescribes several data rates for the N mode. One of these,

Similar evaluations can be obtained for the
4.3.2. Energy Requirements at 868 MHz
As for the 169 MHz modes, the energy requirements are also discussed for the 868 MHz modes. The highest data rate mode is the 100 kbps T mode. The high data rate allows for very short transmission and receive time (10 ms and 78 ms, resp.), so that the energy requirements of the T mode are the lowest over all the WM-Bus modes, 6.7 mJ. Furthermore, the transceiver at hand has slightly lower power consumption for the same radiating power (15 dBm) at 868 MHz. It must be noticed, however, that the communication range will always be shorter than in the 169 MHz modes, due to higher path loss.
The S mode sends data at a rate of only 32.768 kbps. The energy consumption for a single transmission cycle is 9.7 mJ, slightly higher than the most energy efficient mode at the 169 MHz carrier frequency.
5. Simulations and Experimental Evaluations
5.1. Battery Lifetime
In order to estimate the power constraints of a leaf node in the smart water grid, a battery lifetime model is considered. It is assumed to power the board with a typical 3 V Lithium CR2354 battery (Panasonic lithium coin data sheet: http://www.alliedelec.com/search/productdetail.aspx?sku=70197003.), featuring a charge capacity equal to
Device current draws.

Classical equations used to describe battery lifetime [29] can be applied also in the WSN case study, by adding a duty cycle factor and including the possibility to have different current values in compliance with the task executed by the sensor node processor. In particular, each current draw can be weighted by the activity time related to the corresponding transmission, receiving and sleep tasks, as described above. The following values hold, with one transmission per hour in the S operating mode:
transmission:
receiving:
sleep: this phase is active for the majority of time; therefore it is reasonable to assume that
MCU consumption:
where
Battery lifetime for different WM-Bus operating modes.

Figure 7 reports the battery lifetime curves in dependence on the time period between two consecutive transmissions (varying this value from a minimum of 1 hour, i.e., 24 per day, to a maximum of 6, i.e., 4 per day). It is evident that when the daily transmissions are less frequent the battery lifetime is very low and varying with the number of transmissions, therefore mostly dependent on the sleep consumption. In contrast, when the transmission frequency is higher, the power required to sustain the TX and RX phases is much more relevant. Moreover, the WM-Bus at 169 MHz is more demanding with respect to the 868 MHz counterpart, as expected from the energy measurements discussed above.

Battery lifetime versus the time period between two consecutive transmissions, for different frequencies and operating modes.
Moreover, to evaluate the energy requirement of a more performing radio performance setup, the CC1120 transceiver has been equipped with a power amplifier to reach an irradiated power of 27 dBm (500 mW), with a consequent current consumption increase up to 140 mA. To analyse the battery lifetime in this case, a comparison between 15 dBm and 27 dBm has been carried out in the
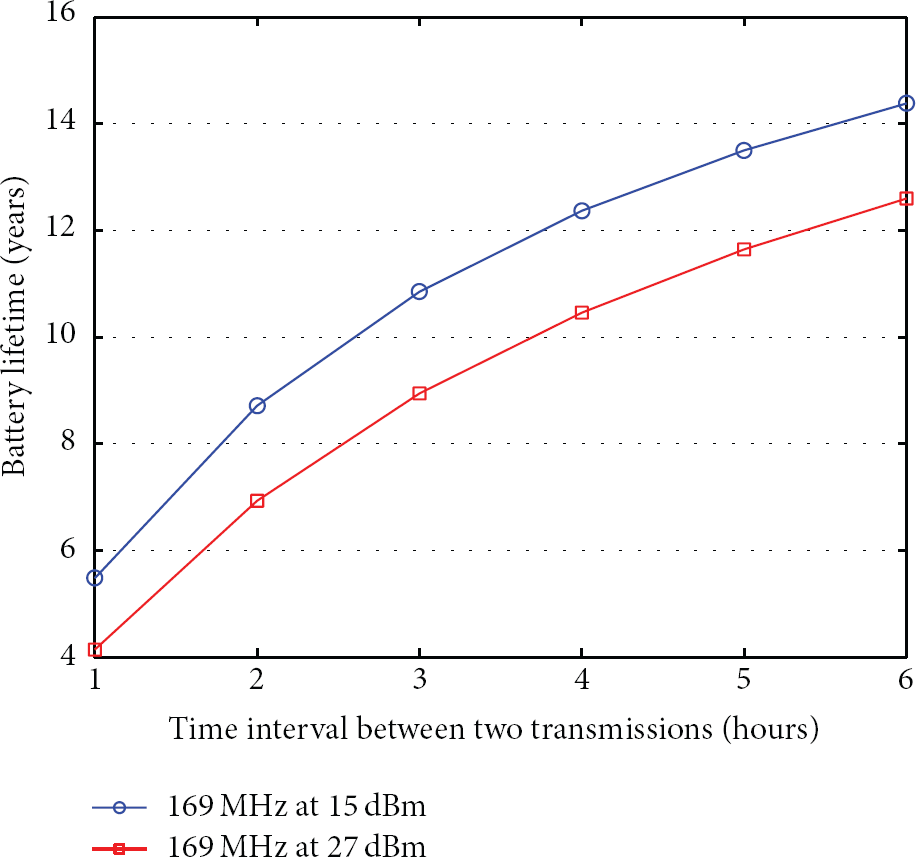
Battery lifetime versus the time period between two consecutive transmissions at 169 MHz, at 15 and 27 dBm.
Assuming also in this case a transmission every 6 hours, the resulting battery lifetime for the 27 dBm transmission is about 12 years and 7 months, almost 2 years less than the 15 dBm case.
5.2. Sensor Node Powering by Energy Harvesting
The possibility to involve Energy Harvesting (EH) modules to supply the required energy for smart water metering sensor nodes is discussed in this section. Such an issue has a strong relevance in the addressed application scenario, since the deployed WSN could be characterized by nodes which are not easily accessible and therefore the eventual substitution of batteries over time can have an impact in costs management.
Among the various EH boards available on the market, the EH300A module (EH300A, Advanced Linear Devices Inc. available at http://aldinc.com/pdf/EH300ds.pdf) has been taken as reference and used in our evaluations. The EH300A module supplies and stores power for inputs higher than 4 V and 500 nA. Its storage capacity is 100 μAh. Inputs with values below this threshold do not activate the EH300A circuitry; thus, a solar panel providing maximum 200 mA at 5 V has been chosen to feed the EH300A module. The EH300A outputs a signal at the same voltage as the input signal, in this case 5 V. The TrxEB, however, can only accept input power in the range 3–3.5 V; hence a voltage regulating circuit has been cascaded between the EH300A and the TrxEB board, based on the LM317 integrated component. Under good solar radiation the TrxEB is able to work continuously without issues. However, with no solar power and fully charged storage buffers, the TrxEB was able to only sustain a second of continuous transmission as if the load required 600 μA. This is mainly due to additional circuitry on the TrxEB which cannot be disabled. That is why the related energy effort has not been accounted for when measuring the MCU and transceiver current draws.
5.2.1. Affordable Transmission Cycles
In order to evaluate the number of allowed transmission cycles in optimized HW, the aforementioned consumption values related to current draws only due to MCU and transceiver active and sleep states are considered. Thus, knowing the battery capacity

Assuming to have a transmission cycle every 6 hours, as in Section 5.1, and a power irradiation of 15 dBm, the following are the values for most relevant S mode variables:
energy storage capacity:
cpacitors discharge cut-off threshold:
total current consumption for TX:
average TX time:
total current consumption for RX:
average RX time:
sleep time:
The discharge cut-off threshold of capacitors limits the storage capacity: for instance, with
Approximately the same result stands for the other WM-Bus modes. Figure 9 reports the N values calculated for all the WM-Bus modes and parameterized with respect to the sleep time

Maximum number of transmissions versus the time period between two consecutive transmissions. All possible operating modes at 15 dBm are evaluated.
Similarly to what is done in previous section, a comparison between 15 dBm and 27 dBm has been carried out from this perspective too, again in the sole
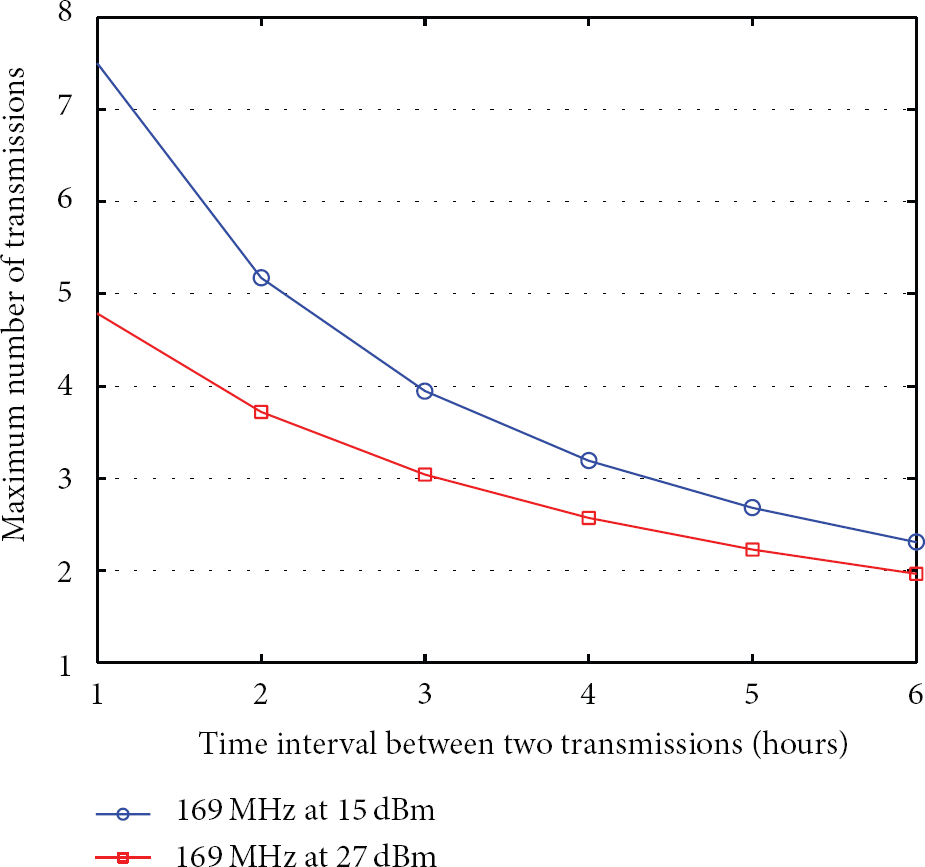
Maximum number of transmissions versus the time period between two consecutive transmissions. The
This evaluation proves the theoretical possibility of supplying power with intermittent energy harvesting to a sensor node implementing the WM-Bus protocol (both at 15 dBm and 27 dBm), with time between transmissions of 1 to 6 hours, which are typical of the metering scenario.
5.2.2. Considerations on Water Kinetic Energy as Energy Harvesting Source
Different energy harvesting sources can be effectively employed in the addressed application scenario. Solar power can be effective but the inherent energy intermittency and logistic problems in placing solar panels for meters in buildings suggest finding some more suitable solutions. That is why water kinetic energy can be used on purpose and a negligible amount of this kinetic energy can be converted into electric energy to power the sensor nodes: in this section a brief analysis of its suitability is discussed.
Water kinetic energy can be converted to electrical energy by a small dynamo turbine placed in contact with the flowing water (e.g., in a duct). Even in small ducts or at small flow rates (in the order of approximatively 10 L/min), this device allows for the harvesting of a moderate quantity of energy and proves very cheap in production and low in embodied energy with respect to solar panels, for instance. Preliminary tests were conducted with a commercial turbine from Seeed Studio Works (http://www.seeedstudio.com/depot/36v-micro-hydro-generator-p-634.html?cPath=155) for microhydropower generation. The turbine is 80 × 81.4 × 43.8 mm in size, with a nominal output of 3.6 V and 300 mA for water flow ranging from 1.5 to 20 L/min. It must be noted that a small capacity 300 mAh buffer battery is provided inside the turbine to achieve a continuous supply of energy and regulated voltage output.
The maximum nominal output power of the turbine is 1 W, enough for powering a sensor node with the power requirements discussed in the previous section when continuous water flows at sufficient speed in the duct. Even with intermittent water flowing (of the entity of those in a domestic, industrial, or public building), the EH still satisfies the SN needs. To recharge a typical water closet, for instance, 7 L of water is required to flow in 30 s on average. This is enough to supply approximately 1 W for 30 s, equivalent to 30 J of energy that can be stored in the battery and ideally cover, for example, 120 days of transmission with WM-Bus Nc mode (the most expensive energy, as highlighted above) at a rate of 1 transmission every 10 minutes [6].
5.3. Experimental Tests and Results on WM-Bus Transmissions
As a first estimate of the WM-Bus transmission performances, the amount of error packets for different values of the received power has been evaluated, through the packet error rate (
In order to test the transmission performances in presence of a controlled attenuation, the WM-Bus transceivers have been connected by cables (thus replacing their antennas), through two different lab attenuators: 355C attenuator by HP, which provides an attenuation ranging from 0 to 12 dB by steps of 1 dB; 355D attenuator by HP, which provides an attenuation ranging from 0 to 120 dB, by steps of 10 dB. Both the attenuators are able to operate in the VHF band, from DC to 1 GHz frequency. In order to check the level of received power, a suitable registry of the CC112X transceiver has been monitored, the RSSI (received signal strength indication) one, which is used to store the signal power value each time new data are received. In the experiments, the
Two transmission modes, T and S, have been tested for the 868 MHz operational band, as shown in Figure 11;
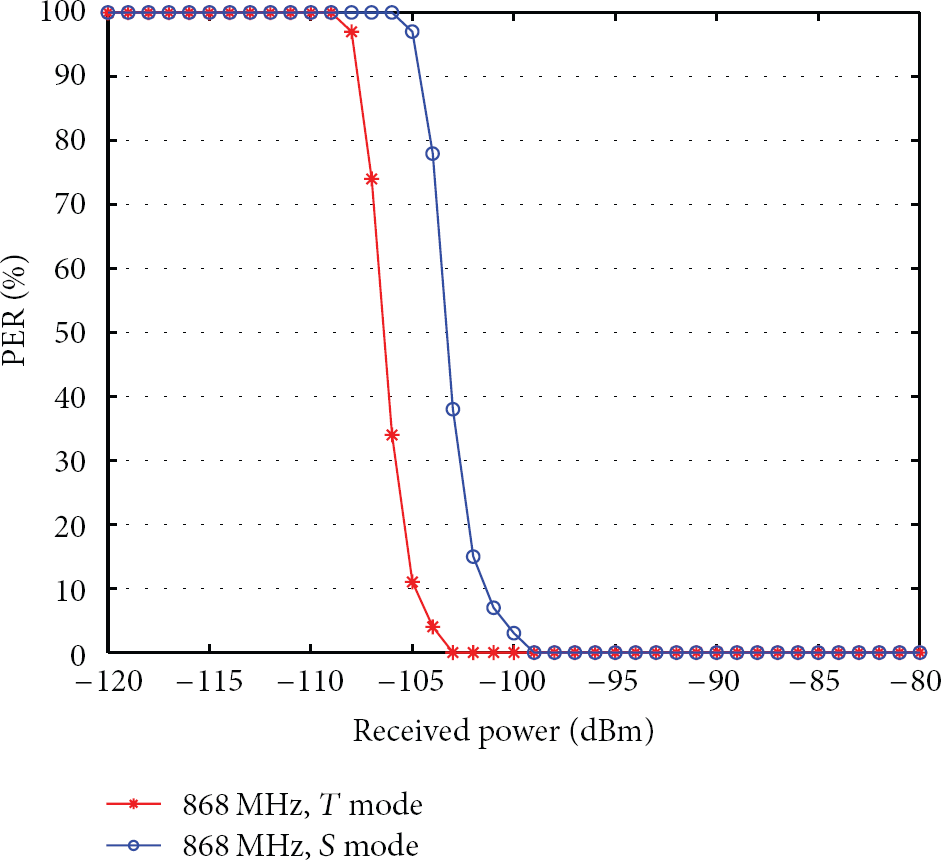
PER evaluation in the 868 MHz band.

PER evaluation in the 169 MHz band.
In order to explain the results obtained by the experimental tests, it is necessary to point out that when noise increases, also the receiver sensitivity increases, that is, the minimum power the receiver can detect. Noise may be due to several sources and phenomena; however, among the most significant contributions, the equivalent noise power at the device input N, which depends on bandwidth B, shall be accounted for. The relationship among the input receiver sensitivity

where NF is the noise figure of the receiver and
Sensitivity depends on bandwidth more than on frequency; this relationship is further evidenced by the comparison between S mode at 868 MHz and
5.4. Evaluation of Maximum Transmission Coverage
The evaluation of WM-Bus transmission coverage has been performed either by simulation, resorting to classical analytical models used to estimate the signal attenuation in different environments, or by practical measurements on the field, by using the same prototype devices discussed in the previous subsection.
In order to get a simulated estimation of the presumable maximum transmission range, the Okumura-Hata model [30] has been applied, due to the frequency range in which it can be used,

where f is the operating frequency (in MHz) and

with
By assuming that

Received power according to the Okumura-Hata open area model, at 868 and 169 MHz.
The simulation shows a maximum coverage distance of 500 m at 868 MHz and up to almost 2 Km at 169 MHz. The WM-Bus 169 MHz operational band seems more suitable to ensure adequate coverage along the water pipes infrastructure, by means of a limited number of sensor nodes displaced, thanks to the greater transmission range supported. Simulated performances have been confirmed for the 868 MHz band, by experimental tests executed on the field, locating the WM-Bus transmitter and receiver in an open environment (an empty stadium park area). Figure 14 shows a good agreement among the expected and measured received power values, at different distances.

Received power according to the Okumura-Hata open area model and field measurements, at 868 MHz.
On the contrary, a strong disagreement among simulated and measured power values was evidenced at 169 MHz. This misbehavior was actually due to the helix antennas first adopted at 169 MHz in the prototype, which were far from ideal ones. The problem was solved by resorting to better designed and refined antennas, able to provide the expected performance.
5.5. WM-Bus Signal Coverage and Node Location
In order to compare the expected performance of the WM-Bus protocol at 868 and 169 MHz, a reference urban scenario has been simulated, in which we assume to have 4 buildings (each
Figures 15 and 16 show the distribution of the received signal power, when a single concentrator is used, at center and vertex position, respectively, for 169 and 868 MHz operational frequencies. Due to the geometry of the scenario and the signal propagation effects, the better performance is obtained when a single concentrator is located in central positions and works at a frequency of 169 MHz.

Received signal power, single concentrator in central position: (a) 169 MHz, (b) 868 MHz.

Received signal power, single concentrator in vertex position: (a) 169 MHz, (b) 868 MHz.
Similar results are obtained when simulations account for two concentrators, located at the center of the building area, or at two vertices, as shown in Figures 17 and 18. Better behavior of the WM-Bus transmission is obtained at 169 MHz; in this case, however, the position of the concentrators does not affect signal coverage significantly, as the sensor nodes are almost uniformly covered.
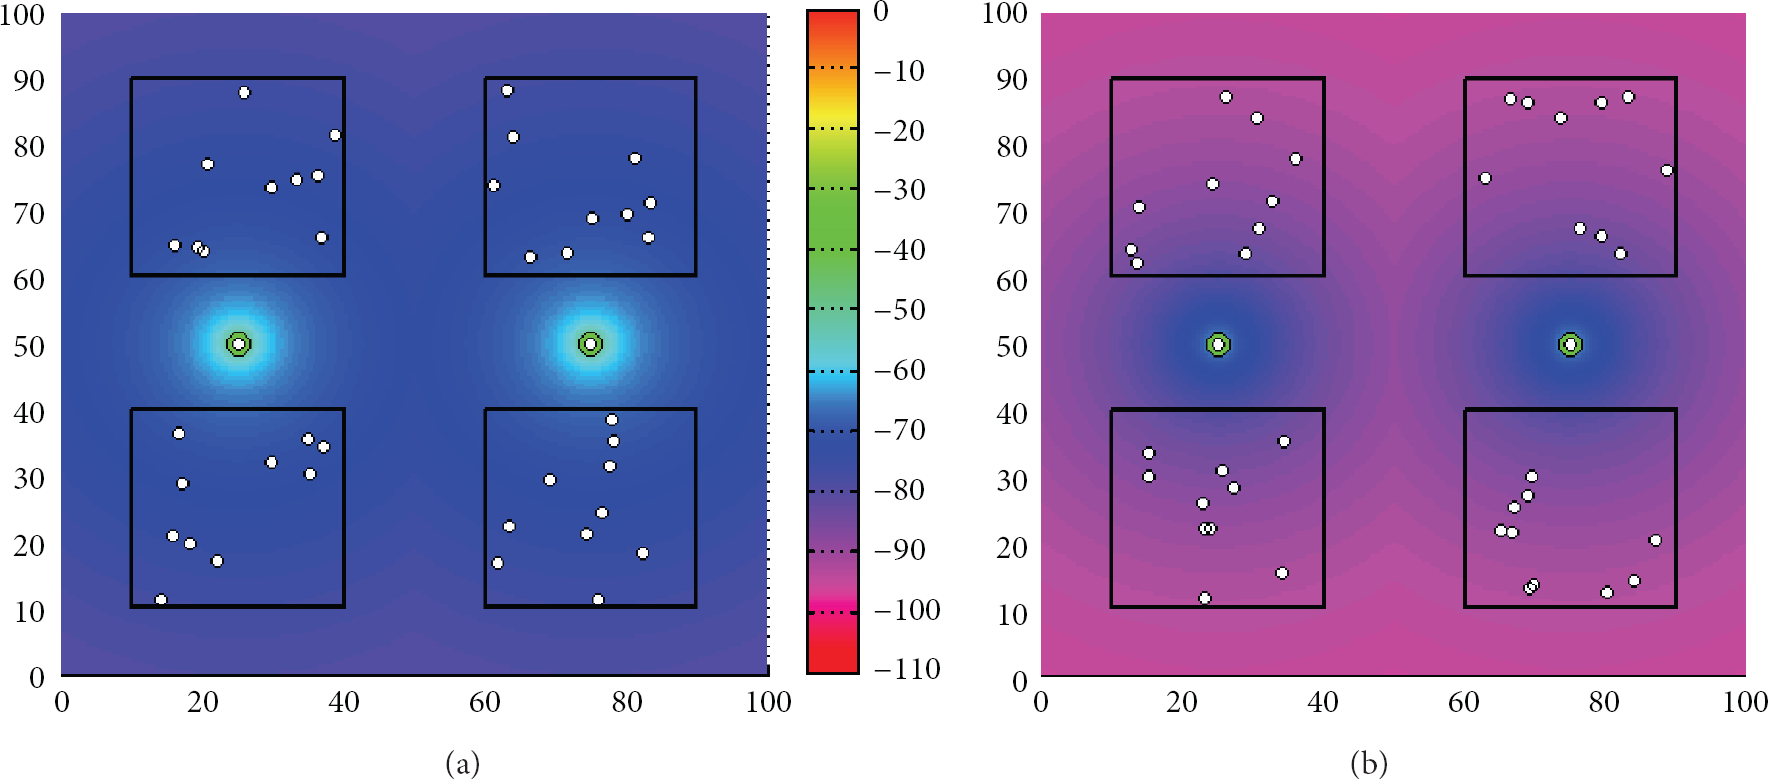
Received signal power, two concentrators in central positions: (a) 169 MHz, (b) 868 MHz.

Received signal power, two concentrators in vertex positions: (a) 169 MHz, (b) 868 MHz.
5.6. Evaluation of Message Collision Probability
In order to evaluate the risk of collisions among asynchronous data transmissions generated by different sensor nodes, towards the same concentrator, it is assumed that the WSN upon which the smart water grid is built comprises n nodes, which transmit their data independently from each other, without a predetermined channel access mechanism. Each transmission has a time duration denoted by
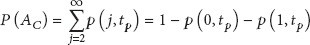
A network in which nodes may act independently and asynchronously can be modeled as a Poisson process, that is, a stochastic process in which events may take place at any time, independently from each other. Such a process is defined by a random variable

In the equation, λ represents the average of the distribution, that is, the average number of times in which the random event occurs in the interval. This Poisson model is applied to the WM-Bus based WSN. The average time between transmissions from two sensors is

which represents the probability that the number of sensor nodes transmitting in the time interval

Evaluations of the collisions probability have been performed, according to (10). In a first simulation, a bidirectional communication is assumed, in which the transmission of a WM-Bus packet requires 125 ms (corresponding to N mode at 38.4 kbps). Figure 19 shows the results obtained by varying the time interval between consecutive transmissions. Better performance, that is, a reduced collision probability, is attained when considering a unidirectional communication, as shown in Figure 20. Each sensor node remains in the transmitting state for a short time of 25 ms. For a time interval of 6 hours between consecutive transmissions, which is a quite good value for metering applications, and a concentrator that handles the transmissions of 100 sensor nodes, the collision probability amounts to

Collision probability as a function of the number of sensors in a bidirectional WSN, for
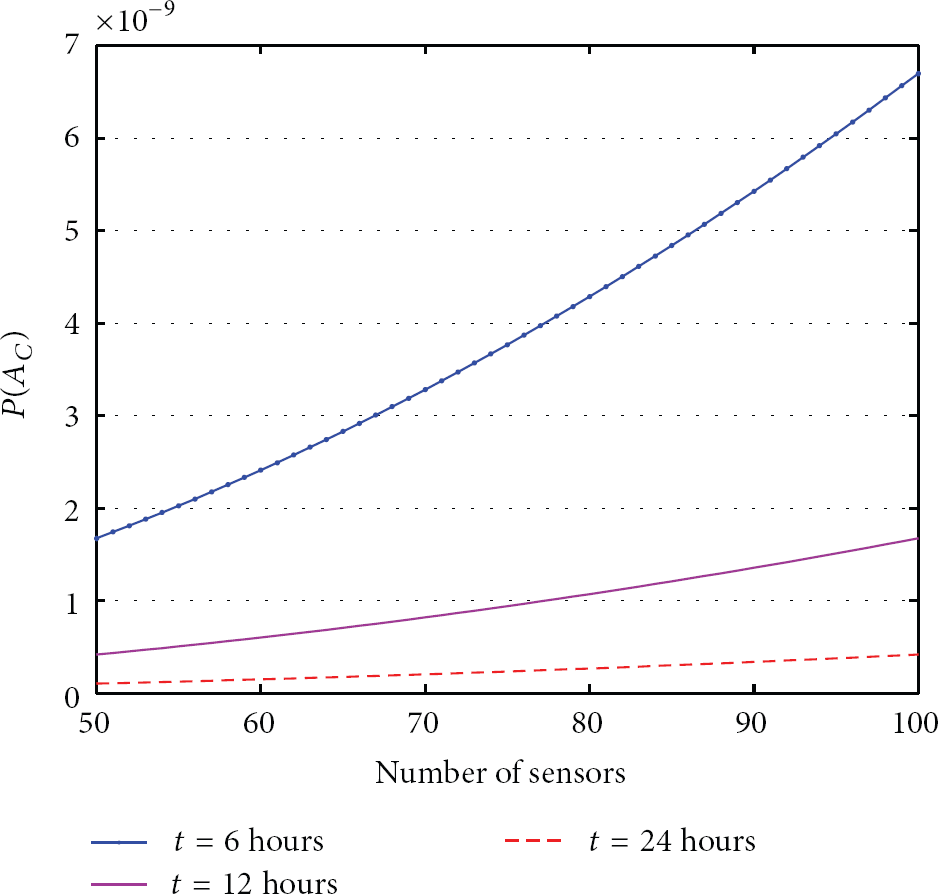
Collision probability as a function of the number of sensors in a unidirectional WSN, for
6. Final Remarks and Conclusion
This paper investigated the WM-Bus protocol for possible adoption in future smart water grids, by evaluating energy consumption issues and transmission performance in different modes, through simulations and experimental tests over prototype implementations, either hardware or software. The addressed topic is surely one of the hottest in advanced metering infrastructure research area, especially in the European scenario, as confirmed in the last few years by the long debate in which technology options can be regarded as the most viable choice for reliable and efficient capillary network solutions. In authors’ opinion, the current work thus represents a useful reference for design purposes and strengthens the research along the main conclusive issues raised in the paper and supported by extensive experimental tests.
The WM-Bus protocol at 169 MHz seems able to ensure adequate transmission capabilities, in different environments, by providing a coverage range in the order of a few kilometers and a quite low sensitivity of the receiver. Bandwidth availability issues, and possible bottlenecks if the number of nodes within the smart water grid increases, shall be put into the perspective of the WM-Bus protocol, which is based on the concept of sporadic data transmission, at a very low duty cycle (as requested in order to freely access the 169 MHz bandwidth for short range radio communications). Should traffic issues arise within the channel, suitable access mechanisms could be included in the framework of the communication policies, thus giving space for a further detailed comparative analysis, to evaluate the most suitable solution.
Experimental tests have shown how the WM-Bus modes at 169 MHz are more demanding in terms of required energy resources, with respect to the 868 MHz counterpart, but are surely fully sustainable, in smart water metering scenarios. In the light of the better coverage properties attainable with a 169 MHz-based communication and considering the importance of such feature, specially when meter locations are severely constrained, the authors are allowed to conclude that the WM-Bus N modes surely represent the best tradeoff for the applicative context under study. Even better outcomes are expected, when the prototype nodes will feature an optimized design and firmware implementation of the standard.
Future efforts will be targeted to the integration of energy-aware task scheduler [32–34] to optimally manage the tasks execution in sensor node processors, the employment of adaptive energy harvesting solutions to improve the node sustainability, and the development of full WSNs based on WM-Bus sensors, for metering scenarios first, and water leakages monitoring then.
Footnotes
Conflict of Interests
The authors declare that there is no conflict of interests regarding the publication of this article.