
Abstract
It is well known that intersections are the most hazardous locations; however, only little is known about driver injury severity in intersection crashes. Hence, the main goal of this study was to further examine the different factors contributing to driver injury severity involved in fatal crashes at intersections. Data used for the present analysis was from the US DOT-Fatality Analysis Reporting System (FARS) crash database from the year 2011. An ordered probit model was employed to fit the fatal crash data and analyze the factors impacting each injury severity level. The analysis results displayed that driver injury severity is significantly affected by many factors. They include driver age and gender, driver ethnicity, vehicle type and age (years of use), crash type, driving drunk, speeding, violating stop sign, cognitively distracted driving, and seat belt usage. These findings from the current study are beneficial to form a solid basis for adopting corresponding measures to effectively drop injury severity suffering from intersection crash. More insights into the effects of risk factors on driver injury severity could be acquired using more advanced statistical models.
1. Introduction
Intersection is a hazardous location where there is a convergence point for traffic flows (e.g., motorized vehicles, nonmotorized vehicles, and pedestrians) from conflicting paths [1, 2]. Thus, conflicts and interference among different traffic flows are prevalent at intersections; this leads to substantial traffic crashes and casualties. There are approximately 40 percent of traffic crashes occurring at intersections in the United States [1]. In 2012, there were 8766 people killed due to motor vehicle traffic crashes at US roadway intersections [3]. In consideration of the aforementioned severe issues, crash frequency and injury severity have been the two major areas for traffic safety analysts to investigate the relationship between crash occurrences and various risk factors.
Over the years, a mountain of studies has been conducted to analyze the crash frequency at intersections [4–6]. However, only a few studies have focused on the crash injury severity. Abdel-Aty and Keller [7] employed an ordered probit model and a tree-based regression model to examine the overall and specific crash injury severity levels at signalized intersections in Florida, respectively. Tay and Rifaat [8] concluded that vehicle type, road type, manner of collision, driver attributes, and time of day significantly impacted crash severity at intersections in Singapore. Obeng [9] utilized a conditional probability model to investigate the determinants of possible injuries from crashes at signalized intersections in North Carolina. One year later, Obeng [10] identified these factors (such as seat belt use and airbag) affecting the injury severity of signalized intersection crashes. Haleem and Abdel-Aty [11] explored those geometric, traffic, and driver-related factors influencing crash severity at three- and four-legged unsignalized intersections in Florida, respectively. Chen et al. [1] reported that driver age and gender, speed zone, traffic control type, time of day, crash type, and seat belt usage were significantly associated with the injury severity of intersection crashes in Victoria, Australia.
Among these above-mentioned studies, each crash is usually taken as the research subject unit. Nevertheless, crash-based severity analysis may not obtain a comprehensive understanding of those factors leading to serious consequences (injuries and property damage) of crashes. While driver-based severity analysis can aid in understanding disaggregate level crash injury severity, so far, to our knowledge, there are only two studies on driver injury severity involved in intersection crashes. Huang et al. [12] established a Bayesian hierarchical binomial logistic model to investigate various factors contributing to driver injury severity and vehicle damage in crashes at signalized intersections. They concluded that peak time, good light condition, pedestrian involved, and heavy vehicle involved were associated with less severe injuries. They also reported that night time, T/Y type intersection, right-most lane, red light camera, two-wheel vehicle, young or old driver, and involvement of offending party were related to more severe injuries. Abdel-Aty [13] developed three ordered probit models to identify those significant factors impacting driver injury severity in crashes at roadway sections, signalized intersections, and toll plazas, respectively. Female, not wearing seat belt, passenger car, point of impact (driver side), speeding, and rural area were found to increase the probability of severe injuries of drivers involved in crashes at signalized intersections.
The main objective of this study is to further examine the influences of driver characteristics, vehicle characteristics, crash characteristics, and environmental factors on driver injury severity in crashes at intersections, given that factors will impact the probability of driver injury severity. Also, some of the used factors were not considered in the past two studies, as will be included in the present study. Understanding the relationship of driver injury severity and those factors will help to identify the determinants that contribute to severe crashes at intersections.
2. Relevant Studies
Many studies have applied different statistical approaches to investigate the relationship of driver injury severity and risk factors in traffic crashes.
Kockelman and Kweon [14] used three ordered probit models to examine driver injury severity in all crash types, two-vehicle crashes, and single-vehicle crashes. The used data derived from the US DOT-General Estimates System (GES) crash database from the year 1998. They found that driver gender, vehicle type, number of vehicles involved, manner of collision, and drinking significantly impacted the injury severity of drivers. They also suggested that pickups and SUVs were less safe than passenger cars in single-vehicle crashes while they protected drivers better than other vehicles in two-vehicle crashes.
Dissanayake and Lu [15] fitted two binary logistic regression models to identify factors contributing to the injury severity of older drivers in fixed object-passenger car crashes. It was concluded that roadway, environmental, vehicle, and driver-related factors had different effects on older driver injury severity.
Boufous et al. [16] analyzed the influence of environmental, vehicle, crash, and driver characteristics on injury severity of older drivers based on the linked police crash records and hospitalization data from New South Wales, Australia. They reported those significant factors including rural area, complex intersection, road speed limit, driver error, speeding, and seat belt usage.
Yamamoto and Shankar [17] studied the injury severities of drivers and their passengers (the most severely injured passengers) in collisions with fixed objects by developing a bivariate ordered probit model. They demonstrated the efficiency of the proposed model by using the 4-year crash data from Washington State. They also uncovered the effects of driver and vehicle attributes, types of fixed objects, and environmental conditions on drivers' and their passengers' injury severities and the marginal effects of some key variables.
Neyens and Boyle [18] employed an ordered logit model to explore the effect of driver distractions (inattention, cell phone, in-vehicle, and passenger-related distractions) on injury severities of teenage drivers (aged 16–19) and their passengers using the 2003 GES data. They concluded that cell phone and passenger-related distractions are associated with an increase in the probability of serious injuries sustained by teenage drivers. They also obtained that in-vehicle and passenger-related distractions resulted in the increased likelihood of injury severities of teenage drivers' passengers.
Mooradian et al. [19] proposed a partial proportional odds (PPO) model to investigate driver and passenger crash injury severity using the Connecticut state crash data from the year 1995 to 2009. The PPO model was compared to ordinal and multinomial response models in terms of goodness of fit, covariates significance, and prediction accuracy. Model estimation results showed that the proposed model fitted data well and performed well in predicting crash injury severity.
Khorashadi et al. [20] utilized the multinomial logit formulation to reveal the influences of various risk factors on passenger-vehicle and large-truck driver injuries in truck-involved crashes in both rural and urban areas. This analysis was conducted on the basis of 4-year crash data from the Traffic Accident Surveillance and Analysis System (TASAS) maintained by California DOT. The results showed that different factors had varying effects on driver injuries in rural and urban settings.
F. Chen and S. Chen [21] used mixed logit models to assess driver injury severity in single- and multivehicle crashes involving trucks on rural highways, respectively. It was concluded that there were considerable differences between the effects of various factors on driver injury severity in these two types of crashes.
Chang and Chien [22] examined the empirical impacts of driver, vehicle, crash, highway geometric, and environmental factors on driver injury severity outcomes in truck-involved crashes by establishing a nonparametric classification and regression tree (CART). They found the critical determinants of driver injury severity outcomes, including drinking, seat belt usage, vehicle type, number of vehicles, crash type, crash location, and environment.
Morgan and Mannering [23] employed a mixed logit formulation to recognize the influence of age, gender, and other factors on driver injury severity in single-vehicle crashes that occurred on dry, wet, and snow/ice-covered roadway surfaces. They concluded that roadway surface conditions had different effects on the probability of severe injuries across age/gender groups.
Abay et al. [24] developed a multivariate probit model to conduct the joint analysis of injury severities of both drivers involved in two-vehicle crashes in Denmark. They considered the endogeneity of seat belt use as well as the unobserved heterogeneity in the influences of explanatory variables. The analysis indicated that significant determinants of injury severity included gender, vehicle type, speed limit, the presence of median barriers, and collision type.
Kim et al. [25] utilized a mixed logit model to investigate driver injury severity in single-vehicle crashes in California by taking the heterogeneous effects of age and gender into consideration. They reported the heterogeneity in driver's age and vehicle age. They also concluded that male, drinking, unsafe speed, old vehicle driven by an older driver (65+), and darkness without illumination were associated with an increase in the probability of fatal injury.
Yasmin et al. [26] proposed a generalized ordered logit model based on the latent segmentation to examine the effects of exogenous variables on driver injury severity via considering both observed and unobserved crash characteristics. They suggested that driver aged 65+, driver ejection, no seat belt use, and collision with high speed significantly increased the likelihood of severe injury. They also found that pedestrian control, roundabout, panel van, unpaved road condition, and passengers were related to a reduction in the probability of driver injury severity.
From those aforementioned works, the predicators affecting driver injury severity in crashes can be categorized into driver attributes, vehicle characteristics, crash characteristics, and roadway geometric and environmental factors. However, there is no study reviewed addressing driver injury severity at intersections. The objective of this study is therefore to explore the relationship between some of these factors and driver injury severity at intersection crashes. The remainder of the present paper is organized as follows. The next section is the detailed information of methodology used in this analysis, which is followed by results, discussion, and conclusions, respectively.
3. Method
3.1. Data
The US DOT-Fatality Analysis Reporting System (FARS) crash data from the year 2011 were used for the analysis in this study. The FARS data come from a census of fatal crashes from the 50 states, the District of Columbia, and Puerto Rico. A crash included in the FARS dataset must involve a motor vehicle traveling on a public roadway and must lead to the death of an occupant of a vehicle or a nonmotorist within 30 days of the crash. The FARS data include crash file, vehicle file, person file, and distraction file.
In this study, driver distraction is classified into four major areas based on the specific driver distraction categories available in FARS [27]: cognitive, passenger-related, cell phone, and in-vehicle distractions. Cognitive distractions include “looked but did not see” and “lost in thought.” Passenger-related distractions refer to only passenger distractions categorized as distractions in the FARS database. Cell phone distractions involve dialing, talking, listening to a cell phone, or cell phone related distractions. In-vehicle distractions include moving objects, adjusting or using the device/controls within the vehicle, eating, smoking, or drinking.
Because the focus of this study is on driver injury severity at an intersection, any drivers involved in crashes not at this location were excluded from the analysis. Persons involved in crashes occurring at intersections that were not drivers were deleted. The data associated with motorcycle or nonmotor vehicles (e.g., moped and bicycle) were removed. The “unknown” category of each variable listed in the FARS database was also omitted from the analysis. In the final dataset, there are 5729 observations. Table 1 describes the explanatory variables used here. Each explanatory variable was categorized as a binary variable.
Description of the explanatory variables.

3.2. Ordered Probit Model
Driver injury severity is categorized into five discrete ordinal levels: no injury (property damage only), possible injury, nonincapacitating injury, incapacitating injury, and fatal injury. To address this type of data, researchers have applied a variety of statistical techniques, including ordered logit model [1, 15, 18, 28], generalized ordered logit model [26], ordered probit model [14, 29–31], and bivariate/multivariate ordered-response probit model [17, 24]. More comprehensive reviews of models available for examining crash injury severity can be found in these studies [32–34].
The ordered probit model recognizes the ordinal (increasing severity) and categorical nature of the independent variable (driver injury severity) and is also much easier to interpret than the aforementioned models. Furthermore, the ordered probit model has considerable attractiveness because of being parsimonious in the number of parameters [35]. Hence, this study follows the path of Kockelman and Kweon [14], Pai and Saleh [29], Gray et al. [30], and Haleem and Gan [31] and starts with a function that is expressed as follows:

where Y n * is an unobserved latent and continuous variable measuring the injury severity of driver n involved in a crash; β denotes a row vector of parameters to be estimated; X n is a column vector of observed explanatory variables; ∊ n is a random error term which is assumed to follow a standard normal distribution [14].
The observed and discrete injury severity variable, Y n , is given as [14]
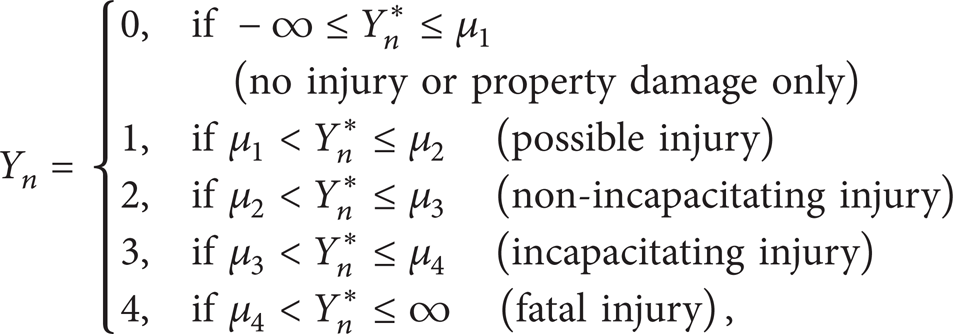
where μ i (i = 1,2, 3,4) denote thresholds that are estimated along with the parameter vector β.
For given X n , the predicted probabilities of the five injury severity levels sustained by driver n can be illustrated as

where Φ() denotes the standard normal cumulative distribution function.
The estimated parameters can be interpreted with the positive and negative signs: positive signs suggest greater driver injury severity as an increase in the value of corresponding variables, while negative signs indicate the opposite results [14]. There are five possible injury severity outcomes (levels) of the present model. The influence of certain variable on the probabilities of driver injury severity cannot be adequately interpreted through directly viewing only the estimated parameter, since a negative parameter may in fact lead to an increase in probability [25]. It is therefore more helpful to examine the marginal effect of each variable on the probabilities of different driver injury severity levels.
In the current study, all observed independent variables are 0 and 1 indicator variables. The direct pseudoelasticity is calculated to examine the change in estimated probability of injury severity when certain variable switches from 0 to 1, which is expressed as follows [25]:

where P n (j) is the probability of injury severity level j sustained by driver n and X nk is the kth indicator variable. According to (4), there is a value of the direct pseudoelasticity of the probability with respect to each independent variable for each observation. As a consequence, the average direct pseudoelasticity for the data is computed and reported to represent the whole dataset. The interpretation of an average direct pseudoelasticity, for example, −10%, for a variable on a probability means that the probability decreases by 10% on average due to the variable switching from 0 to 1.
4. Results
The statistical software package, R version 2.15.2, was applied to conduct this analysis by using “MASS” package. The estimation results for ordered probit model are shown in Table 2. Statistical differences were assessed at P < 0.05. There were no significant differences of driver injury severity observed based on intersection type, road surface condition, and light condition. In order to completely uncover the effects of significant variables on the probabilities of different injury severity levels, the parameters in Table 2 are therefore employed in (4) to compute the average direct pseudoelasticity of each variable on the probability. These results are presented in Table 3 and help to interpret the model estimation results.
Ordered probit model estimation for significant independent variables.

Note: S.E. stands for standard error.
Average direct pseudoelasticity of the explanatory variables.

Note: NI stands for no injury; PI stands for possible injury; NII is nonincapacitating injury; II refers to incapacitating injury; FI refers to fatal injury.
The model results showed that teenage drivers (aged 16–19) were less likely to be severely injured than other age groups involved in intersection crashes and similar results were observed for young drivers aged 20–29. However, drivers (ages 65 and above) were more likely to sustain serious injuries (incapacitating injury 30.86%, fatal injury 206.99%, see Table 3) than other age groups. As compared to male drivers, female drivers had a greater probability of increased injury severity in crashes at intersections. Interestingly we found that female teenage drivers were associated with increased probabilities of incapacitating injury and fatal injury (15.75% and 57.81%, respectively, in Table 3). The race of driver also significantly influenced the probability of driver injury severity in crashes at intersections. White drivers were found to have a higher probability of more severe injuries than other ethnic groups (such as African Americans, Mexican Americans, and Asian Americans) in the United States.
There were significant differences of the probabilities of different driver injury severity levels based on vehicle types involved in the intersection crashes. Automobile, utility vehicle, van, and light truck were associated with an increase in the probability of incapacitating injury and fatal injury. Drivers in these four vehicle types were more likely to have higher injury severity level than those of buses or medium or heavy vehicles. The driver who was driving an older vehicle (vehicle age 11 and above) at the time of a crash at an intersection had a greater probability of fatal injury (26.97%, in Table 3) compared to a driver in a newer vehicle (vehicle age less than or equal to 10 years).
Crash type significantly impacted the probability of driver injury severity in crashes at intersections. Rear-end collisions increased the probability of serious injury (fatal injury: 193.04%, incapacitating injury: 19.86%, nonincapacitating injury: −33.53%, possible injury: −62.46%, and no injury: −81.22%, in Table 3), so did head on collisions, angular collisions, and sideswipe crashes.
When drinking was involved in intersection crashes, the probability of fatal injury increased (44.11%, in Table 3). If the drivers were speeding at the time of a crash, they were more likely to suffer severe injuries (fatal injury: 94.59%, nonincapacitating injury: 21.09%, in Table 3). At stop sign-controlled intersections, stop sign running showed up as significantly increasing the probability of fatal injury and nonincapacitating injury (113.55% and 20.46%, respectively, in Table 3).
Although passenger-related, cell phone, and in-vehicle distractions did not significantly influence the probability of driver injury severity levels, cognitive distractions reduced the probability of serious injury in crashes at intersections (fatal injury: −43.76%, incapacitating injury: −24.10%, nonincapacitating injury: −4.22%, possible injury: 18.81%, no injury: 61.40%, in Table 3). Drivers who used seat belts were less likely to sustain severe injury than those who did not use seat belts. There was an interaction effect of older drivers (aged 65+) and seat belt use, with a reduction in the probability of severe injury if an older driver aged 65+ wore a seat belt at the time of a crash.
5. Discussion
The present study is conducted to investigate the influence of driver attributes, vehicle characteristics, crash factors, and environmental predictors on driver injury severity in crashes at intersections. Driver age and gender, driver race/ethnicity, vehicle type, vehicle age, manner of collision, drinking, speeding, stop sign running, cognitive distractions, and seat belt usage were all identified as significant factors of driver injury severity.
There were significant differences of the probability of injury severity across driver age groups. Our findings suggested that teenage drivers (aged 16–19) had a decrease in the propensity to sustain severe injuries relative to other age groups in traffic crashes. This is consistent with the existing literature [26]. Teenage drivers are generally more likely to be involved in risk-taking while driving than others [36, 37]. An existing literature displays [38] that they are more willing to commit stop sign running, red light running, improper turning, and speeding at intersections; however, they may quickly react to the dangerous situations to avoid crashes. Even if they are involved in traffic crashes, they are less likely to suffer serious injuries owing to their strong physiological strength in withstanding crash impacts [26, 39].
It is well known that older drivers (ages 65 and above) have a higher propensity of severe injury in crashes [25, 26, 40]. The result from the current study confirms the findings of previous literature and also demonstrates a conclusion in [41], which implied an increase in risk of fatal injury in crashes involving older drivers at intersections. Exacerbating injury severity of this age group involved in crashes has been attributed to the increased body fragility with aging [25, 26, 40, 42]. In addition to fragility, the reduced physical tolerance to the crash impact force, decreased reaction ability to hazardous situations, and cognitive impairment can also contribute to their higher severe injury risks [16, 26].
The results showed that driver gender significantly impacted injury severity outcomes. More specifically, female drivers had higher odds of more severe injury than males. The finding is in line with previous studies [43, 44], which already reported that females tended to sustain more serious injuries than males. It is interesting to note here that female drivers aged 16–19 were associated with the increased probability of severe injuries. There are a few explanations to this point. Female drivers regardless of age usually react less quickly than men to take maneuvers for avoiding hazardous circumstances [44] and are less capable of resisting physical trauma [21, 26]. They also tend to buy smaller and lighter vehicles than men do, which increase the odds of suffering severe injuries in crashes [45]. Another possible explanation is that female teenage drivers cannot generally identify inherently dangerous situations on the highway and react inappropriately due to lack of driving experience and overestimate their driving ability.
Marginal effects analysis indicated that White drivers were related to the extremely increasing probability of fatal injury. The result can be interpreted with the FARS data on race/ethnicity which should be derived from the death certificate only. It means that a driver coded as any race/ethnicity in FARS database died due to the traffic crash. Besides, the finding of an existing study [46] displayed that the White fatally injured drivers are overrepresented in single-vehicle, two-vehicle, and all vehicles crashes. Hence, significant differences of the probability of injury severity outcomes for White drivers were found in the current study.
The results for the vehicle type indicated that the drivers of utility vehicles, van, and light trucks had a less severe injury propensity compared to those of automobiles. This finding is in accordance with previous studies [12, 14, 26]. These results are probably caused by the larger weight of utility vehicles, van, and light trucks and their higher centers of gravity. As indicated in [12], the risks of being injured decreased substantially with the vehicle weight increasing. These results also hint that light trucks protect drivers much better than other vehicle types, which further demonstrates the conclusion in the literature [14]. The current study also revealed that drivers in older vehicles (vehicle age 11 years and above) were more likely to sustain serious injuries than those in newer vehicles. This is consistent with the earlier study [26], which discussed that mechanical deficits, lack of safety equipment, and suspended or unlicensed drivers involved in older vehicles might contribute to higher severe injury outcomes of drivers in these vehicles.
Our analysis results also showed that rear-end, head on, angular, and sideswipe collisions were associated with the increased probability of driver injury severity in crashes at intersections. These findings support the results found in the literature [7]. Rear-end collisions increase the odds of severe injuries for drivers. This kind of crash often occurs because the leading vehicle brakes abruptly. As indicated in [26], the drivers of the leading vehicles were likely to sustain whiplash or neck injury in rear-end collisions. The present study also demonstrates the discussion about head on and angular collisions increasing the probability of serious injuries in the earlier study [26]. Sideswipe crashes (including the same direction and opposite direction) are due to the improper driving maintenance and failure to keep enough side distance with vehicles on peripheral lanes. However, unlike the previous study [7], which reported that sideswipe crashes resulted in fewer injuries, the result in the current study can be interpreted with the greater force of sideswiping and heavier deformation of vehicle bodies.
Consistent with many previous studies [14, 21, 24, 25], this study obtained the same observation that alcohol consumption increased the probability of driver injury severity. According to [47], police documentation of alcohol involvement was more common for divers who had a prior record of impaired driving. Hence, we postulate that it might be more profitable to prevent driving while being drunk by periodical monitoring of the driving performance of those drivers who have a history of impaired driving.
Speeding was found to significantly increase the odds of severe/fatal injuries of drivers. This is in line with many existing studies [1, 25, 48]. One of the reasons why speeding so strongly affects injury severity in traffic crashes is that a slight increase in speed is related to a considerable increase in kinetic energy, leading to the powerful force of impact. Therefore, setting reasonable speed limits at intersections can be more beneficial to lessen driver injury severity outcomes involved in traffic crashes.
Stop sign running resulted in a higher severe injury severity propensity for drivers involved in crashes relative to those who did not run stop sign at intersections. To this point, it can be explained by the crash type involving stop sign running. In light of the finding from [49], stop sign violation typically leads to angular collision. As noted earlier, angular collisions were more likely to produce severe injuries than other crash types at intersections.
It is quite interesting to note here that cognitively distracted (looked but did not see or lost in thought) driving significantly decreased the likelihood of severe injury of drivers in traffic crashes at intersections. The finding of this study verifies the conclusion of an earlier study [18]. They reported that teenage drivers had a higher likelihood of being slightly injured if they were inattentive (identified as the cognitive distraction in [27]) than other distraction categories. Nevertheless, it is well known that cognitive distraction undermines driving performance [50], which may result in serious consequences. Hence, the effect on driver injury severity of cognitively distracted driving under complex traffic condition (such as at intersection) needs to be investigated in depth with enriched crash data.
As expected, seat belt usage was related to a reduction in the probability of severe injuries of drivers in crashes at intersections. Earlier studies have indicated that seat belt use decreases the odds of sustaining serious injuries [25, 26, 51]. Furthermore, not wearing seat belt has been shown to increase the probability of severe injury of drivers [1, 10, 13, 23]. The current analysis also implied the joint effect of drivers (aged 65 and above) and seat belt use on driver injury severity. This can be supported by the finding in [52], which reported that seat belt usage tended to increase with aging. Boufous et al. [16] concluded that not wearing seat belt increased the injury severity of older drivers (ages 50 and above) in crashes.
However, there are some limitations in this analysis. First of all, the current study is conducted on the basis of FARS data, which only record a crash that leads to fatal injuries. Therefore, the FARS data underreporting the crash with only slight injury severities may induce the overestimation of model parameters. Underreporting in traffic crash data has been shown to lead to the bias in parameter estimations of injury severity models [53]. However, such situation can be effectively improved with the continual improvement of crash data collecting. Secondly, the present analysis does not comprehensively uncover driver injury severity under a variety of factors, because 65% (see Table 1) of intersection crashes are two-vehicle crashes. In these crashes, the injury severity of drivers in the striking vehicles is totally different from their collision partners (drivers who are in the struck vehicles) [14]. In view of this problem, we are going to conduct a study about the effects of risk factors on injury severities sustained by drivers and their collision partners in two-vehicle intersection crashes. Last but not least, the model used in this study has some defects: the fixed coefficient of each variable and the ordinal constraints (i.e., not being able to reveal a variable simultaneously increasing the odds of low and high severity or tending towards middle severities) [25]. Future studies can employ more powerful models (such as mixed logit model [21, 25] and proportional odds model [19]) to improve our understanding of the relationship between driver injury severity and explanatory variables.
6. Conclusions
This study is conducted to explore the relationship of driver injury severity and driver attributes, vehicle characteristics, and crash characteristic factors in crashes at the intersection by applying an ordered probit model. Additionally, it calculates the marginal effects of the explanatory variables identified as significantly affecting driver injury severity on the probability of injury severity outcomes.
The significant factors identified in the analysis include driver age and gender, driver race/ethnicity, vehicle type, vehicle age, crash type, drinking, speeding, stop sign running, cognitively distracted driving, and seat belt usage. More specifically, drivers (ages 65 and above), female drivers, female teenage drivers, White drivers, automobile, utility vehicle, van, light truck, vehicle age (aged 11 and above), rear-end, head on, angular, and sideswipe collisions, drinking, speeding, and stop sign running were associated with the increased probability of severe injury outcomes for drivers involved in crashes at intersections. Furthermore, teenage driver, young drivers (aged 20–29), cognitively distracted driving, seat belt usage, and older driver (ages 65 and above) who wore seat belt were related to a reduction in the odds of severe injuries of drivers in intersection crashes.
Identification of risk factors and their corresponding effects on driver injury severity involved in crashes at intersections provides more insights into the relationship between injury severity and various factors. The results in the current study provide important information for the vehicle manufactures, drivers, intersection designers, and traffic operation relevant agencies to conceive countermeasures to mitigate the crash frequency and injury severity at intersections. Moreover, it would be interesting to further investigate those factors affecting driver injury severity by virtue of employing more powerful statistical models (e.g., mixed logit model) and using a more comprehensive dataset and to see if more potential contributory factors (e.g., environmental factors) can be found.
Conflict of Interests
The authors declare that there is no conflict of interests regarding the publication of this paper.
Footnotes
Acknowledgments
Most of the work in this study was conducted while the corresponding author was a visiting Ph.D. student at the HFSM Lab at the University of Washington (Seattle) from October 2012 to November 2013, which was supported by China Scholarship Council (CSC). This research work was supported partly by the National Natural Science Foundation of China (Grant no. 51208238). The authors would like to thank the reviewers for their valuable comments and suggestions to improve this paper.