
Abstract
The three-dimensional turbulent flow in a vertical axial-flow pumping system with cube-type intake passage was simulated based on Navier-Stokes solver embedded with RNG k-∊ turbulence model. The internal flow pattern of the cube-type intake passage and the vorticity distribution around the bell-mouth of flare tube were analyzed. Four types of antisubmerged vortex devices were designed based on the vortex tubes intensity conservation theorem. The high-speed photography was applied to observe the flow pattern of the cube-type intake passage with 4 types of vortex-elimination devices. The predicted trajectory of submerged vortex was validated by the comparison with the tested results by PIV (particle image velocimetry). The results show that, with the increase of flowrate coefficient K Q , the maximum vorticity magnitude of every measuring line increases gradually and the increased amplitude of maximum vorticity magnitude decreases gradually. When a submerged vortex flows from the bottom of the cube-type intake passage into the flare tube, the position of maximum vorticity is closer to the center point of the bell-mouth than the initial position. Strong submerged vortex can be successfully suppressed by vortex-elimination device installation on the bottom of cube-type intake passage just below the bell mouth.
1. Introduction
Pumping system is composed of four main flow components: intake passage, impeller, guide vane, and outlet passage. Intake passage plays an important role to make the water flow evenly into the impeller chamber, which can meet the requirement of hydraulic design for impeller chamber intake section. Generally, flow into the impeller chamber is with no vortex from intake passage. However, if there is vortex in the intake passage, it will cause hydraulic pulsation, uneven velocity distribution of impeller intake section; thus, it will affect the hydraulic efficiency and safe and stable operation of pumping system.
At present domestic and foreign scholars mainly study hydraulic performance of pumping system from four aspects, namely, its flow pattern analysis, hydraulic stability analysis, numerical optimization, and model test in [1–6]. For pump sump, the present study is concentrated on the submerged vortex in pump sump. Choi et al. in [7] analyzed the flow uniformity according to the flow distribution in each pump intake channel for a multi-intake pump sump model with 7 pump intakes and examined the effectiveness of antisubmerge vortex device by model test. Rajendran and Patel in [8] studied details of instantaneous and average structure of vortices that occur in water-pump intake bays by particle image velocimetry. Nagahara et al. in [9] investigated the flow structure of the vortex occurring in pump suction intake sump and used particle image velocimetry to measure the flow around the vortex for the accuracy of CFD calculation predicting vortex cavitation evaluated. Tang et al. in [10] used a commercial computational fluid dynamics code to predict three dimensional vortex flows in a large centrifugal-pump station under construction in China and proposed relevant vortex-eliminating schemes. Bayeul-Lainé et al. in [11] studied the flow field formed in water pump sump by using numerical model to solve the Reynolds averaged Navier-Stokes equations and VOF multiphase model for reproducing the flow pattern of experiments and confirming the geometrical parameter that influences the flow structure in a pump sump. Chen and Guo in [12] studied 3D turbulent flow of multi-intakes sump. If there is submerged vortex in the cube-type intake passage, how will this affect hydraulic performance of pumping system? Therefore, how to explain these physical phenomena becomes a question that deserves further study. Mathematical model of vertical axial-flow pumping system with cube-type is established based on the characteristics of submerged vortex in the intake passage. The purpose of this study is to analyse the influence mechanism of submerged vortex on the hydraulic performance of pumping system. This paper focuses on that internal flow characteristics of pumping system and hydraulic performance of impeller are analyzed by the methods of experimental and numerical analyses. Furthermore, effectiveness of antisubmerged vortex device (AVD) for the suppression of the vortex occurrence in a cube-type intake passage and in a pumping system model has been examined by the methods of experiment.
2. Experimental and Numerical Methods
2.1. Experimental Setup and Uncertainty Analysis
Figure 1 shows the sketch of the complete test rig. The butterfly valve is D341 type, which affords pumping system operation. The electromagnetic flowmeter has sufficient straight pipelines before the flowmeter and it is earthed to power supply terminal for normal signal production. Flow rate is measured by LDG-SDN150 electromagnetic flowmeter, which is calibrated before installation. Pumping system head is measured by smart differential pressure transmitter EJA. Torque is measured by JCO type torque meter, which is transmitted by pump shaft. The ISM150-200A type centrifugal pump is installed for the circulating water supply within the pumping system performance test. Clean tap water is used as working fluid. Water and air temperatures during the experiment in the laboratory are not changed, respectively.
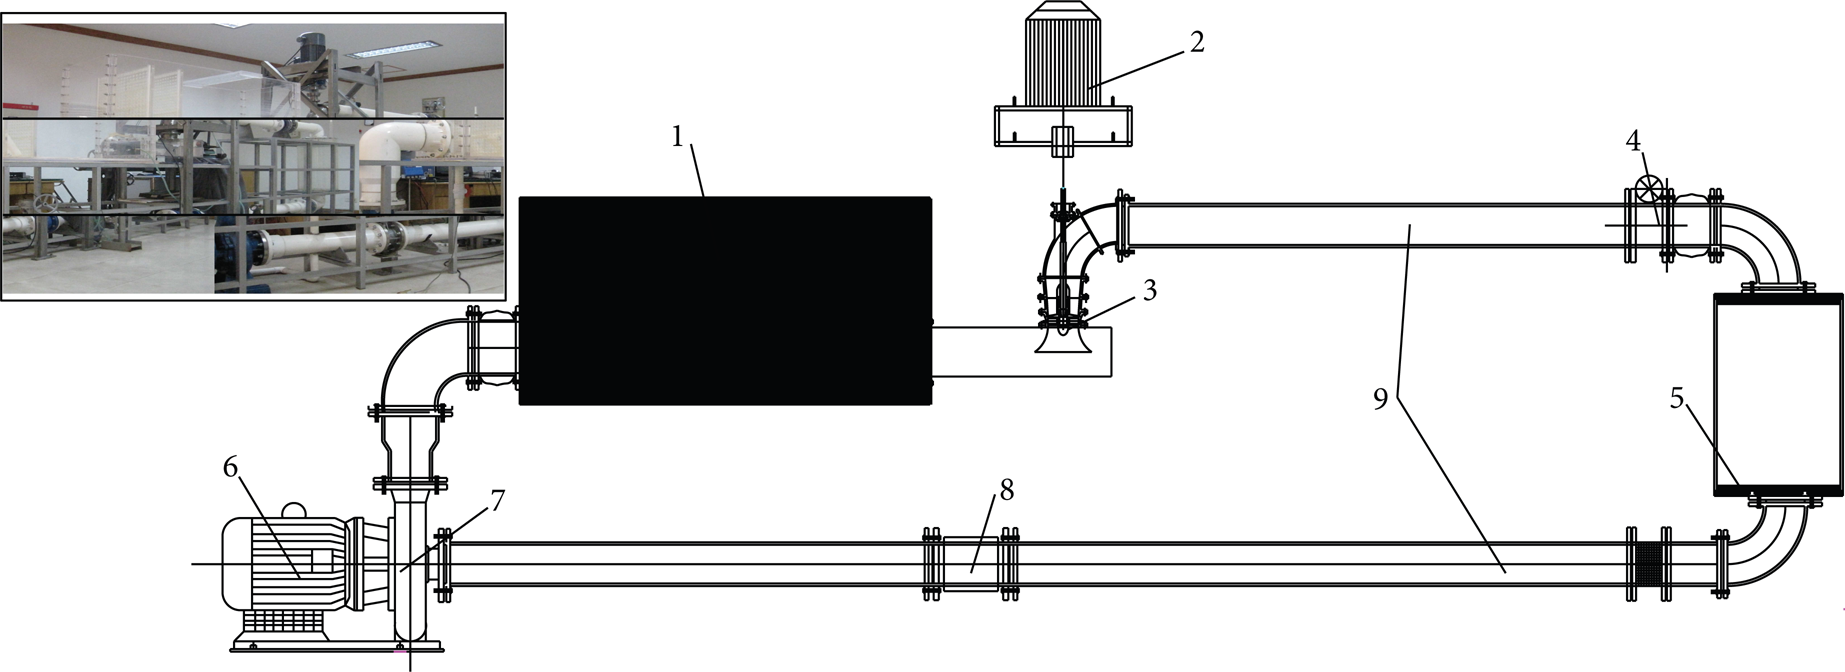
Sketch of test rig. 1: Intake water tank, 2: vertical motor, 3: pumping system model, 4: butterfly valve, 5: surge tank, 6: horizontal motor, 7: centrifugal pump, and 8: electromagnetic flowmeter, and 9: pipeline.
The uncertainly analysis for flow rate is based on the method in [13]. The total uncertainty of the variables can be found by combing total systematic and total random errors as follows:

The total systematic error can be calculated as follows:

where EQ·S is systematic error of electromagnetic flowmeter, EH·S is systematic error of differential pressure transmitter, En·S is systematic error of torque speed sensor, and EM·S is systematic error of torque meter. These systematic error parameters are dependent on testing equipment shown in Table 1.
Systematic error parameters of testing equipment.

The total random error can be calculated with the following equation:

where EQ·R is random error of efficiency testing, EH·R is random error of head testing, En·R is random error of rotation speed testing, and EM·R is random error of torque testing.
The systematic error is estimated based on the systematic error of each testing equipment and the previous test experience. The total random error is calculated by the method of probability statistics based on the test data of this pumping system model. So the total uncertainty Eη is ±0.514%.
2.2. Numerical Conditions and Grids
The flow in the pumping system with cube-type intake passage is turbulent flow through the very complex geometry. The three-dimensional Reynolds-average Navier-Stokes equations are solved by ANSYS CFX 14.0 code in strong conservation form. The turbulence effects are modeled by the RNG k-∊ turbulence model. The RNG k-∊ model provides a way to account for the effects of swirl or rotation by modifying the turbulent viscosity appropriately. Inlet boundary condition is set to velocity distribution at the depth direction to logarithms distribution, while outlet condition is total pressure in stationary frame. Scalable wall functions are used to simulate the boundary layers. Steady-state simulations with incompressible water are performed. Adiabatic and hydraulically smooth walls with no slip condition are considered at solid boundaries. Periodic boundaries are set at the blade passage interfaces.
Three-dimensional modeling data for pumping system is embodied by using CAD software as shown in Figure 2. An unstructured mesh is used so that the cell density could be controlled manually based on the flow features. For the pumping system with cube-type intake passage, the total node number of the computational grid is determined to be 1610341, and the total grid cell number is 4387013 with at least eight points in the viscous sublayer to resolve the near-wall flow taking computer calculation performances into consideration.
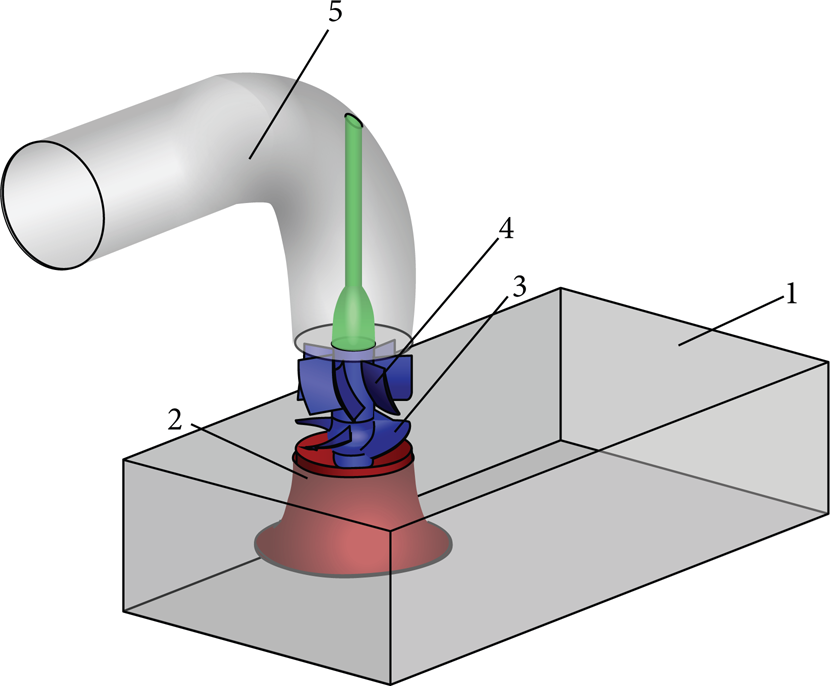
Pumping system model. 1: Cube-type intake passage, 2: flare tube, 3: impeller, 4: guide vane, and 5: outlet passage.
The major design specifications of pumping system are listed in Table 2.
Major design specifications of pumping system.

Figure 3 shows a sketch of the cube-type intake passage used in the calculations and experiments. It consists of impeller diameter D, inlet height Hin, bottom clearance h, passage length L, passage width B, and back wall distance X. These main relative dimensions of cube-type intake passage are shown in Table 3.
Main relative dimensions of cube-type intake passage.

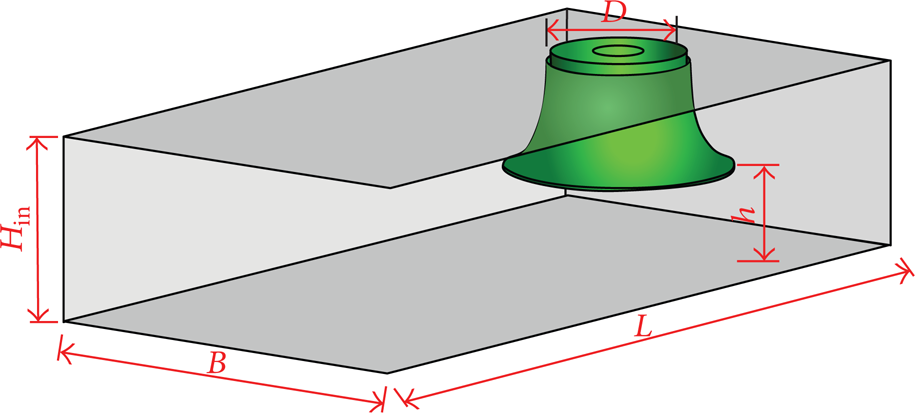
Size diagram of cube-type intake passage.
3. Validation Test of Present CFD Analysis Method
In order to acquire the reliability of present CFD analysis method, steady state calculation is conducted for the test model using the CFD analysis method adopted in this study. For the performance presentations, the flowrate coefficient K Q , the head coefficient K H , and the efficiency coefficient Kη are defined as follows:

where Q, n, D, g, H, η i , and ηopt indicate the volume flow rate, rotating speed, impeller diameter, acceleration of gravity, head, efficiency of every operation condition, and efficiency of optimum operating condition, respectively.
The performance of the pumping system at blade angle 0°, predicted from the computational fluid dynamics (CFD) model, was compared with the experimental results. As shown in Figures 4 and 5, the predictions for the head coefficient and the efficiency coefficient agree well with the results of the performance test. The simulation method in the paper could be used in flow field analysis of the pumping system.
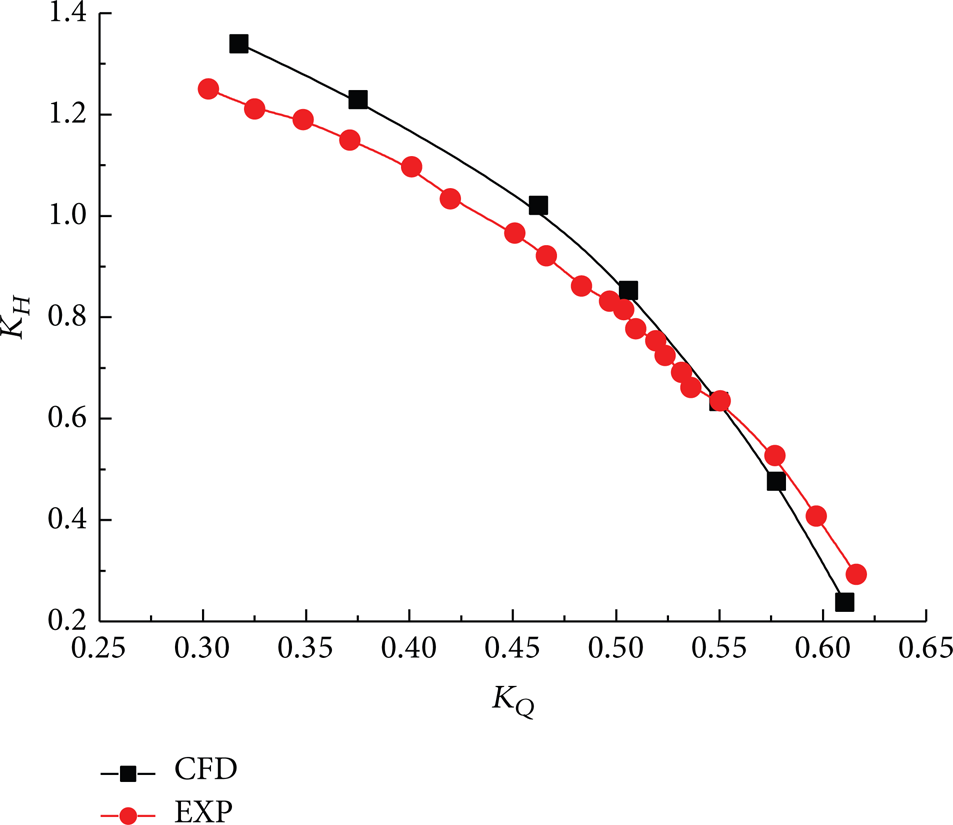
Experimental and predicted results of head coefficient.
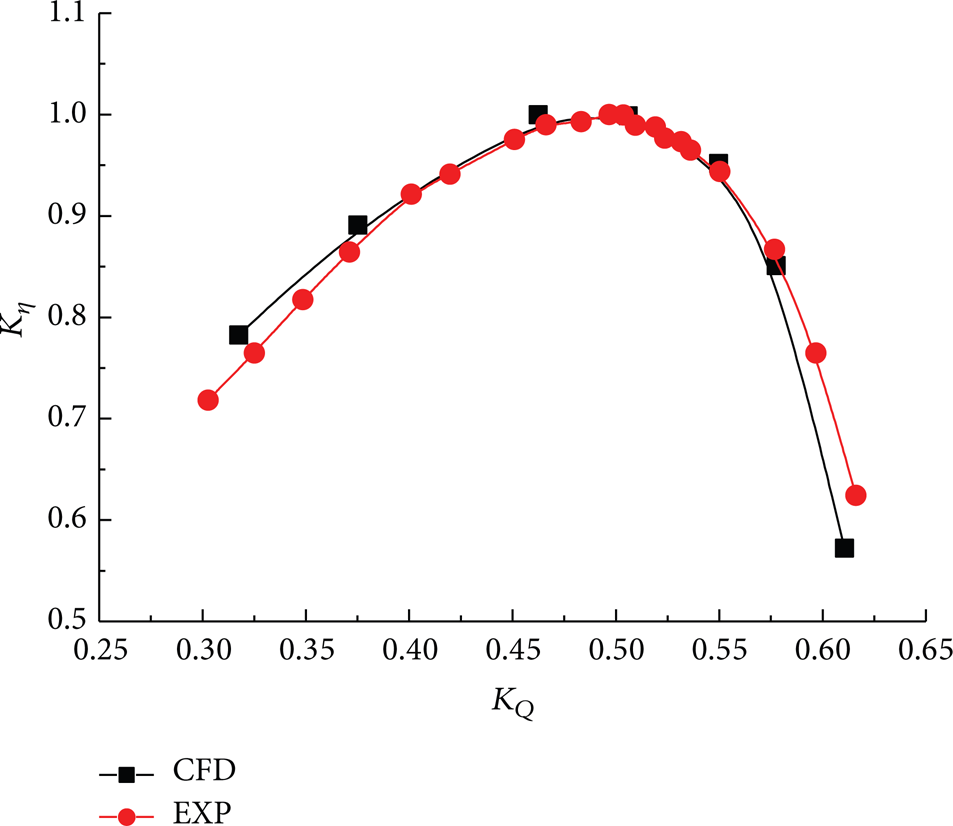
Experimental and predicted results of efficiency coefficient.
To verify the simulation with RNG k-turbulence model and Reynolds time-averaged equation, a comparison between the simulation and PIV (particle imagine velocimetry) results is made in K Q = 0.499, as shown in Figure 6, where the relative velocity represents the ratio of every measuring point velocity and maximum velocity. The section along the flow direction is in the vertical center position of cube-type intake passage. The relative velocity is the ratio of every measuring point velocity and maximum velocity for cross section. The experimental and calculated results agree well with regard to the trajectory and occurrence position of submerged vortex core. This indicated that the simulation with RNG k-∊ turbulence model and Reynolds time-averaged equation could be used to predict the submerged vortex of cube-type intake passage and hydraulic performance of pumping system.
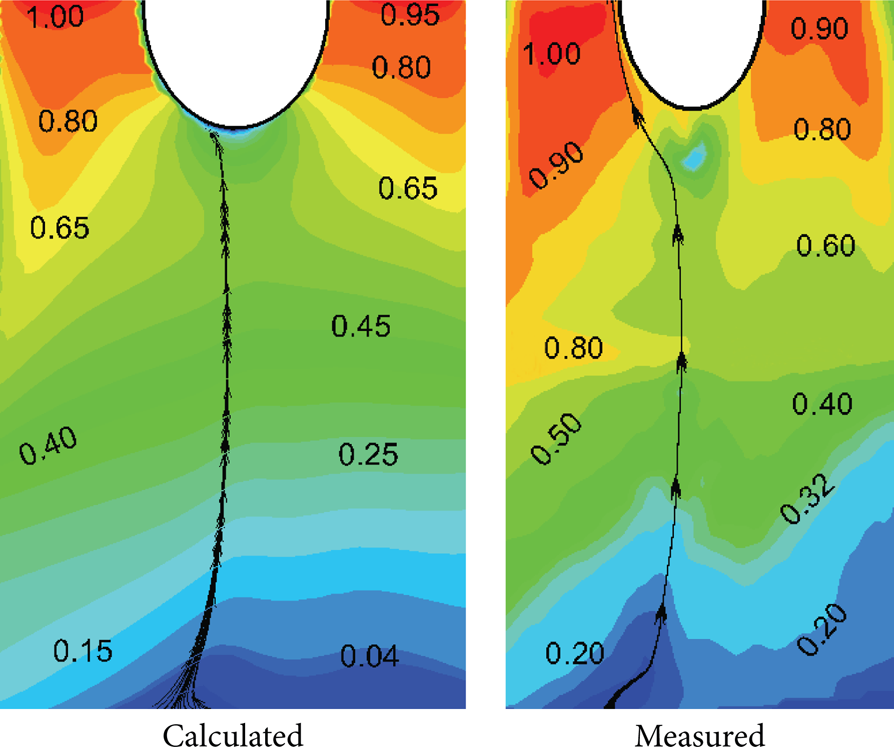
Measured submerged vortex compared with that predicted by CFD calculation.
4. Results and Discussions
4.1. Flow Analysis of a Pumping System
The internal flow characteristics of cube-type intake passage are analyzed in three different operating conditions based on the internal streamline of cube-type intake passage, which are shown in Figure 7. The velocity distribution is uniform in the straight segment of cube-type intake passage. The water keeps horizontal direction by passage wall restraining and then the water flow begins to bend in different extent near the flare. Subsequently, the water flows into flare directly from passage floor, both sides of flare near passage sidewall, and flare back. In this stage, the flow patterns are complex because the streamline bends extremely. The typical characteristic of internal flow pattern in the cube-type intake passage is water flowing into flare from all directions. The internal flow through the intake passage can be divided into three stages: level flow pattern adjustment, flare influx from around, and adjustable segment of flare pipe. The flow pattern is particularly important in the second stage because it is easily to form vortex rope. If there is submerged vortex in the floor of intake passage, the hydraulic performance of pumping system will decrease and submerged vortex will affect the safe operating stability of pumping system even more seriously.

Internal flow pattern of cube-type intake passage.
Figure 7 shows the calculation results of submerged vortex in the cube-type intake passage. Submerged vortex occurs in the center below the flare in three operating conditions. The water flow speed is slow in the floor region below the flare center, which can form a recirculation zone. The shear layer is made between the surrounding water and the near wall region, wherein the tangential velocity is high and a forced vortex is made with the swirling energy of water converges into one vortex.
4.2. Vorticity Distribution around the Bell-Mouth Intake in Cube-Type Intake Passage
For the purpose of examining the cause of submerged vortex occurrence in detail, quantitative value of vorticity distribution around the bell-mouth intake and passage floor was investigated. Plane X0Y is defined and here X-direction represents the width of cube-type intake passage and Y-direction represents the length of cube-type intake passage. Schematic diagram of plane X0Y is shown in Figure 8. The section 1-1 is 0.64D away from the passage floor. The section 2-2 is bell-mouth intake of flare.

Schematic diagram of section and plane coordinate.
The vorticity is the curl of flow field. If there is source of vorticity, vortex will appear in the fluid. The vorticity magnitude can be expressed as follows:

where ω x denotes the vorticity magnitude of X-direction, ω y denotes the vorticity magnitude of Y-direction, and ω z denotes the vorticity magnitude of Z-direction.
Figure 9 shows vorticity magnitude distribution of measuring lines of X-direction and Y-direction in section 1-1 and section 2-2. Ordinate of the graphs indicates the vorticity magnitude value and abscissa means the distance ratio from the center of each section.

Distribution of vorticity Magnitude in different flow rate coefficient K Q .
In the range of l* = − 0.40 ~ − 0.15, there is a little difference in the occurrence locations of the maximum vorticity magnitude of X-direction and Y-direction in different operating conditions. In this range, the vorticity concentration of two directions is easy to cause vortex tube occurrence, while in the range of l* = 0.15 ~ − 0.80, there are large differences in the occurrence locations of the maximum vorticity magnitude of X-direction and Y-direction. Comparing with the center line, the occurrence probability of vortex in right is lower than the other side. If the vorticity magnitude reaches a certain value, the vortex tube will appear. When the vorticity magnitude is larger and the vortex tube cross section is smaller, the rotation angular velocity will be larger. With the increase of vortex tube cross section, the vorticity magnitude is smaller and the rotation strength of submerged vortex is smaller. The statistical values of vorticity magnitude of two measuring lines are shown in Table 4.
Maximum vorticity magnitude of different measuring lines.

The increase amplitude of maximum vorticity Δ∥ω∥ is calculated by a method of calculating the difference of vorticity magnitude maximum value in different operating conditions. The calculated results of Δ∥ω∥ are shown in Table 5.
Increase amplitude of maximum vorticity.

With the increase of the flowrate coefficient K Q , the decay rate of maximum vorticity magnitude increases gradually. In the flow rate coefficient K Q = 0.608, the maximum vorticity magnitude reduces by 39.51% between measuring lines of section 1-1 and section 2-2 in X-direction, and it reduces by 61.68% between measuring lines of section 1-1 and section 2-2 in Y-direction. Submerged vortex dissipates in the internal of impeller finally. With the increase of the flow rate coefficient K Q , the maximum vorticity magnitude increases gradually in the measuring lines of X-direction and Y-direction, but the increase amplitude of maximum vorticity Δ∥ω∥ decreases gradually.
The submerged vortex occurs in the floor of cube-type intake passage. When it reaches the flare intake section, the location of maximum vorticity magnitude is near the center point. This shows that the trajectory of submerged vortex is oscillating.
4.3. Observation of Vortex Occurrence in a Cube-Type Intake Passage
According to the characteristics of submerged vortex occurrence in the floor of intake passage, vortex-elimination devices were designed based on the vortex tubes intensity conservation theorem. Some main details and picture of every vortex-elimination device are shown in Table 6. To verify the validity of these antisubmerged vortex devices, submerged vortex of intake passage is observed by using high-speed photography when only antisubmerged vortex device is changed and all other conditions keep unchanged.
Test schemes of different antisubmerged vortex devices.
Figure 10 shows typical results from the flow visualization for the submerged vortex of the cube-type intake passage floor without AVD in K Q = 0.492.

Photography of submerged vortex in flow rate coefficient K Q = 0.492.
The submerged vortex was not eliminated by the vortex-elimination cone in the range of test operating conditions for Scheme 1. Figure 11 shows that the photography of submerged vortex in the large flowrate coefficient K Q = 0.470. The submerged vortex occurs in the surface of vortex-elimination cone, so that it will affect the hydraulic performance of pumping system. For Scheme 2, the submerged vortex does not occur in the range of K Q = 0.217 ~ 0.470, but the small submerged vortex occurs in the large flow rate coefficient K Q = 0.477. Figure 12 shows the photography of small submerged vortex in K Q = 0.477. The submerged vortex strength of Scheme 2 is weaker than that of Scheme 1, and the observation results show that the effectiveness of vortex-elimination cone in Scheme 2 is better than that of Scheme 1.

Photography of submerged vortex in large flow rate coefficient K Q = 0.470 (Scheme 1).

Photography of submerged vortex in large flow rate coefficient K Q = 0.477 (Scheme 2).
In order to eliminate the initial occurrence condition of submerged vortex, the vortex-elimination bar is improved to serrated vortex-elimination bar based on Scheme 2. The quantity of rectangular vortex-elimination bar in Scheme 3 is the same as that in Scheme No. 2. The submerged vortex is not observed in different operating conditions, which shows that this vortex-elimination device is valid, because the serrated vortex-elimination bars can break accumulation of eddy energy. The quantity of serrated vortex-elimination bar decreases by 8 bars based on Scheme 3. The validity of vortex-elimination in Scheme 4 is the same as that in Scheme 3. The vortex-elimination core of Scheme 3 can save material and cost. The flow field photography of Scheme 4 in K Q = 0.470 is shown in Figure 13.

Photography of flow field in large flow rate coefficient K Q = 0.470 (Scheme 4).
5. Conclusion
The submerged vortex trajectory of intake passage is captured successfully based on numerical simulation in different operating conditions, which is basically the same as the experimental results by PIV (particle image velocimetry). The submerged vortex occurs firstly in the floor of intake passage, and then it flows into the flare tube.
The flow patterns in the cube-type intake passage, calculated by the numerical simulation of CFD, can be classified into three types: the straight line adjustment stage, flare tube contraction, and flare tube adjustment pattern. The second and third stages of the flow pattern are especially important in the cube-type intake passage. With the increase of flow rate coefficient K Q , the maximum vorticity magnitude of every measuring line increases gradually, and the increased amplitude of maximum vorticity magnitude decreases gradually.
Four types of vortex-elimination devices are designed. The vortex-elimination cone with 8 serrated vortex-elimination bars can eliminate the submerged vortex successfully.
Conflict of Interests
The authors declare that there is no conflict of interests regarding the publication of this paper.
Footnotes
Nomenclature
Acknowledgments
This research work was supported by the National Natural Science Foundation of China (Grant no. 51279173), the Natural Science Foundation of Jiangsu Higher Education Institutions of China (Grant no. 14KJB570003), the National Science & Technology Support Project of China (Grant no. 2012BAD08B03-2), and Technology Project of Water Resources Department of Jiangsu Province (Grant no. 2014044).