
Abstract
High-bay depot plays an important role in the storage industry. Due to large and high space of high-bay depot, it is difficult to make temperature distribution uniform, which will influence the storage time of raw materials. In this paper, the aim is to find the reasonable air supply and energy-saving method; a supply-air method of high-bay depot is investigated as an example. The results show the radius and spacing of the supply-air inlet have great influence on temperature distribution. The temperature nonuniformity coefficient of summer is smaller than that of winter. The investigated results can provide a theoretical reference for the high-bay depot design and economic operation.
1. Introduction
With the rapid development of science and technology, high-bay depot has become an important part of the storehouse [1]. It is applied generally in the storehouse which has several layers, a dozen layers, or even a few ten layers of shelf goods for storage. Figure 1 shows an example of the high-bay depot.

A high-bay depot.
Due to its advantages in greatly improving the space utilization, accelerating the speed of the goods access, reducing the labour intensity, improving production efficiency, and saving building space in China, it has been widely used in machinery, metallurgy, chemistry, aerospace, electronics, medicine, food processing, tobacco, and so forth, [2].
Many researchers had applied numerical simulation to investigate the temperature and velocity distribution in the warehouse. CFD as a tool [3] had been successfully used to analyse external flow distribution [4] and internal flow distribution [5] in the building and construction industry. Chow [6, 7] used CFD method for building services engineering. Chen and Srebric [8] applied CFD method to design indoor and outdoor environment. At the same time, CFD was an effective tool to solve practical problems of building design in ventilation for increasing engineering productivity and precision [9]. Fletcher et al. [10] used the CFD to design new buildings and assess existing buildings. Xu et al. [11] proposed a model which treated the potatoes as a porous resistance around the ducts and predicted the flows inside the air supply ducts; their results showed that the proposed model was simple and cost effective enough to use in commercial applications. Nahor et al. [12] modelled airflow and heat transfer in warehouse to predict the velocity distribution, temperature profile, and moisture loss in stored product. Xie et al. [13] applied CFD to predict the effect of various design parameters on the flow and temperature fields of a cold store. Wu et al. [14] investigated the influence of the position variations of the air inlets and outlets on the temperature distribution in a large air conditioning workshop of 4∼5-meter height with high heat-releasing tobacco machines; the result showed that temperature stratification could be effectively used by supply air below and air return upward in middling height. Chourasia and Goswami [15] developed a two-dimensional CFD model of the cold store to investigate airflow, heat transfer, and moisture loss in a potato cold store under steady state condition. The simulation result showed this model could very well be applied to incorporate necessary design improvements with a view to improve the airflow distribution and heat transfer in order to limit the storage losses within the permissible limit.
Recently, some researchers applied CFD tool to investigate the heat transfer and fluid flow characteristic of high bay depot. He et al. [16] rearranged the pattern of indoor air flow from side-in and side-out to top-in and bottom-out. After changing, the temperature and humidity were more uniformly distributed horizontally and the vertical temperature distribution was not as uniform, but it was in the acceptable range. Ho et al. [17] used a complete three-dimensional model and an equivalent two-dimensional model to investigate temperature and velocity in a refrigerated warehouse. They found that better cooling effectiveness and uniformity of temperature in the refrigerated space could be achieved by using higher blowing air velocity and/or locating the cooling units lower and closer toward the arrays of product packages. Cho and Kim [18] focused on the use of performance metrics for analysing a vertical aisle partition system in a high-density data centre. Their study provided more objective data for data centre managers or engineers in judging the applicability of an aisle partition system and presenting an alternative for efficient HVAC system operation. Wu et al. [19] put forward a new airflow pattern which led supply air flows along the wall by baffle which was installed near to the envelop. According to their simulated results, the new airflow pattern could meet the indoor uniformity requirement well while the supply air volume was reduced greatly, which meant the energy consumption could be reduced significantly. Guerriero et al. [20] studied the products allocation problem in a multilayers warehouse with compatibility constraints among the classes.
From above literatures reviews, we can see that previous research focused mainly on heat transfer performance for refrigerated warehouse or different position of inlet. Few literatures investigate the effect of radius and spacing of supply-air inlet on the uniformity of velocity and temperature of high bay depot. In this paper, the influence of the radius and spacing of supply-air inlet on temperature and velocity distribution of high-bay depot is studied.
2. Mathematical Model and Numerical Method
2.1. Mathematical Model
In this paper, the size of the high-bay depot is 82 m × 26 m × 16 m. The room model is shown in Figure 2. There are 10 × 8 × 27 rows in the depot along X, Y, and Z direction, respectively. The size of the block is 2.07 m × 0.85 m × 1.35 m.

A model of the depot.
The mathematical model [21] is as follows:

where ϕ is the universal variables, Tϕ is generalized diffusion coefficient, and Sϕ is generalized source term, corresponding to the ϕ values. Table 1 gives the parameter used in the above equation.
Variables, diffusion coefficients, and source terms of each governing equation.

2.2. Boundary Conditions
Table 2 gives the external temperature and supply-air parameters. The material of the wall is 37# brick, and its total heat transfer coefficient is 1.56 W/(m2·K). The top-in and bottom-out air flow pattern are adopted in this high-bay depot. Circular air inlet is uniformly distributed at the top of the room, and air outlets are located on both sides of the wall at the bottom area.
The external temperature and supply-air parameters.

2.3. Numerical Calculation
The governing equations and boundary conditions are solved by a commercial CFD code based on the finite-volume method. The second-order upwind difference scheme is used to discretize the convection term; the SIMPLE algorithm is employed to solve the pressure-velocity coupling equation. Numerical convergence can be accepted only when the residuals of the continuity and components of velocity are smaller than 10−6, and the residual of the energy is smaller than 10−8.
In order to validate the accuracy of computational results, the grid independence of the numerical solutions has been tested. For this purpose, four different grids number are studied. The grids numbers are 2506386, 2707408, 3826250, and 4704986. Five points are selected during every three meters in the height, and the temperature of these five points from four sets of grid is listed in Figure 3. The relative errors of 2707408, 3826250, and 4704986 are very small. Therefore, in order to obtain the accurate results and save computer resource, the grids of 3826250 are used for further computation.

Test of grid independence.
The computational system used in present computation is a HP server with Intel Xeon E5-2650 Quad Core running at 2.00 GHZ with 32 GBytes RAM. The computational time for each mode needs about eight hours.
2.4. Parameters Define
Temperature nonuniformity coefficient [22] is employed to evaluate temperature field uniformity. N nodes are selected in the computational domain to obtain the average temperature; the arithmetic mean value can be expressed as:

The root-mean-square deviation can be expressed as

Then the nonuniformity coefficients can be expressed as

The temperature nonuniformity coefficient kt is the dimensionless parameter. The smaller kt is, the better the uniformity of temperature is.
3. Results and Analysis
3.1. Effect of the Radius of Supply-Air Inlet
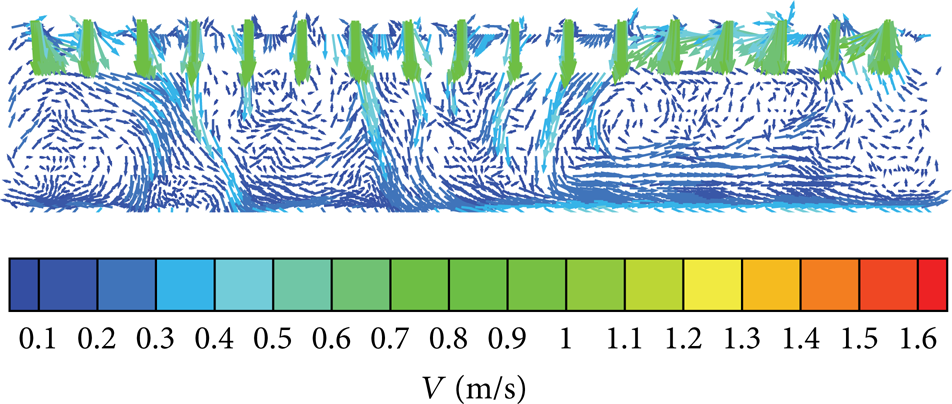
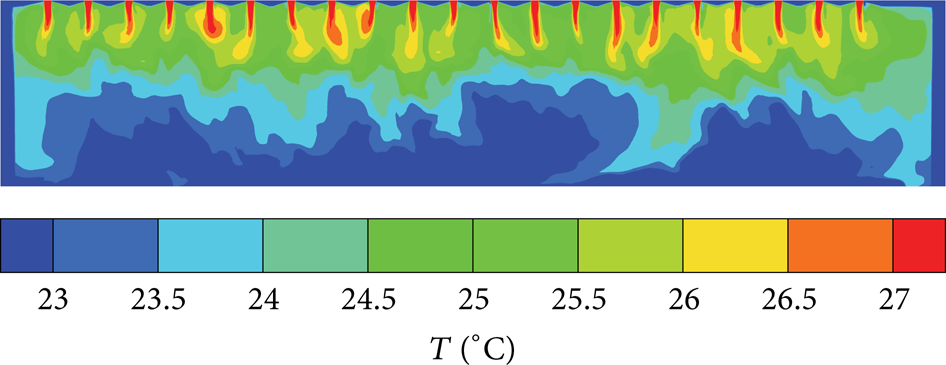
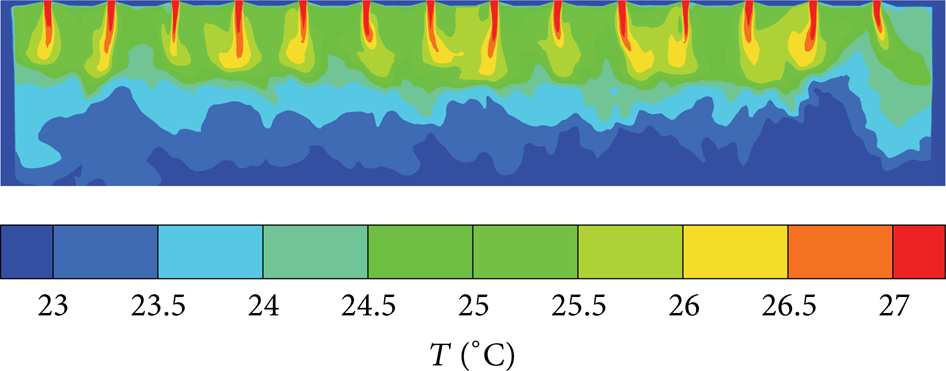
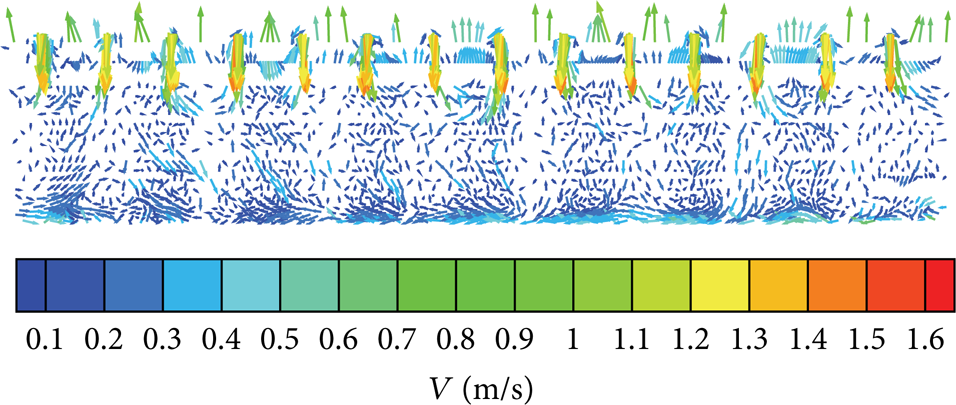
In the present models, the radius of supply-air inlet is given as 315 mm, 365 mm, 415 mm, and 465 mm, respectively. The effect of the supply-air inlet radius on the velocity and temperature distribution in summer and winter is investigated. The air velocity vectors distribution and the temperature distribution of four different models at the x = 22.5 m are shown in Figures 4, 5, 6, 7, 8, 9, 10, 11, 12, 13, 14, 15, 16, 17, 18, and 19.

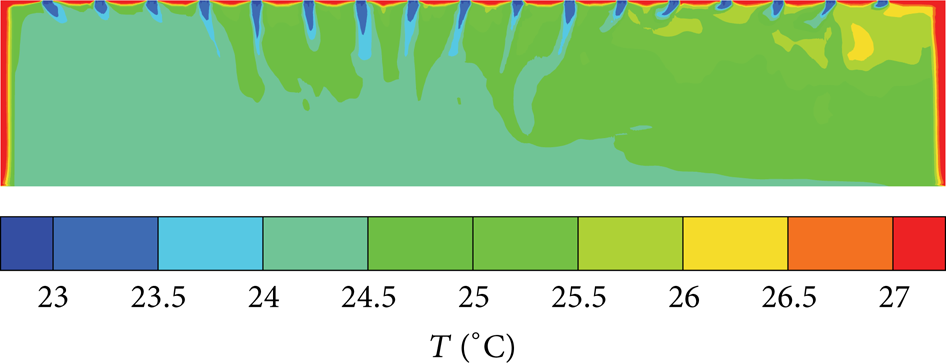
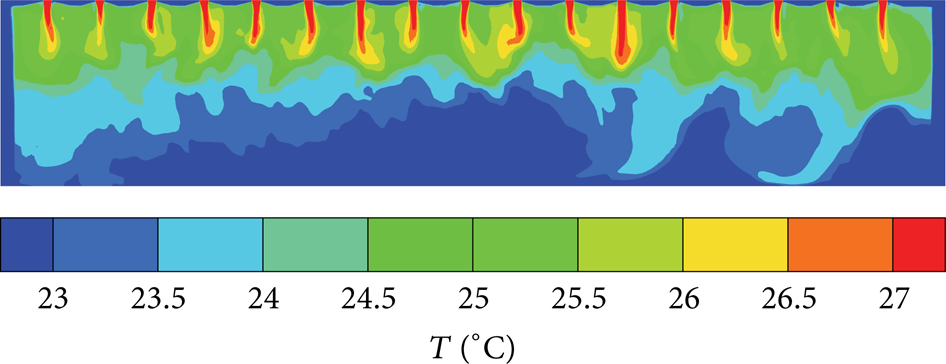
Temperature field at R = 315 mm in summer.

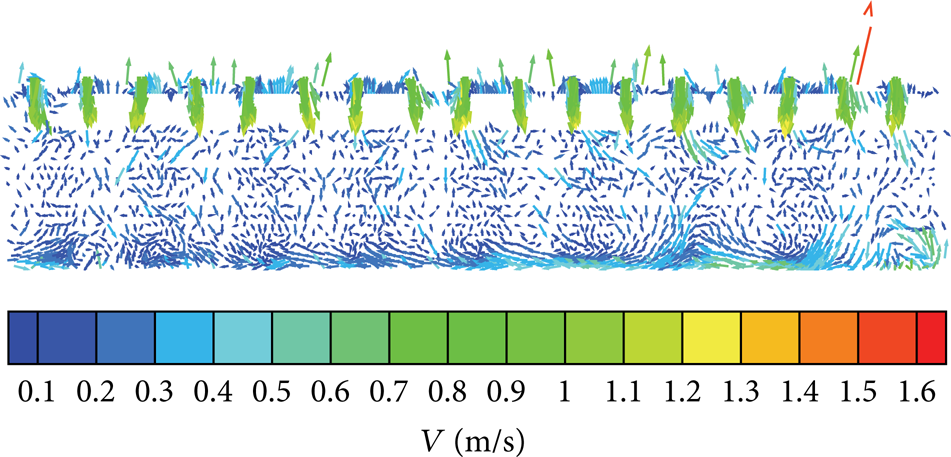
Velocity field at R = 315 mm in summer.

Temperature field at R = 365 mm in summer.

Velocity field at R = 365 mm in summer.

Temperature field at R = 415 mm in summer.
Velocity field at R = 415 mm in summer.
Temperature field at R = 465 mm in summer.
Velocity field at R = 465 mm in summer.
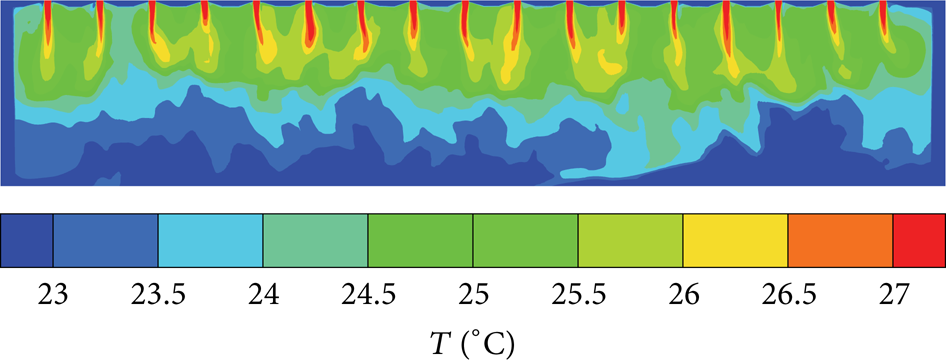
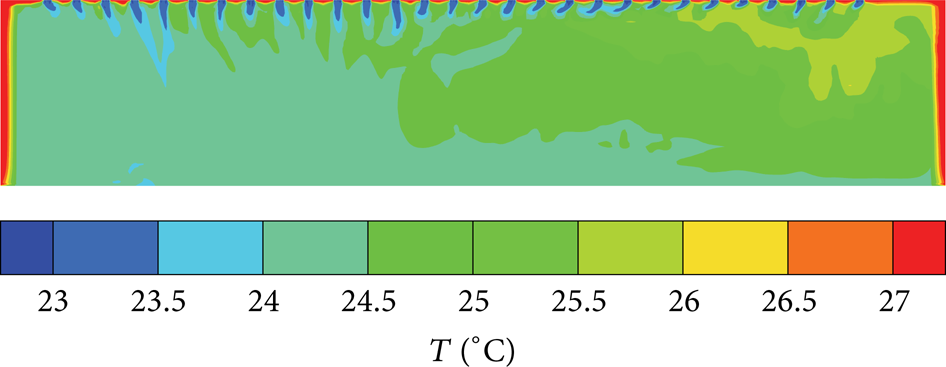
Temperature field at R = 315 mm in winter.

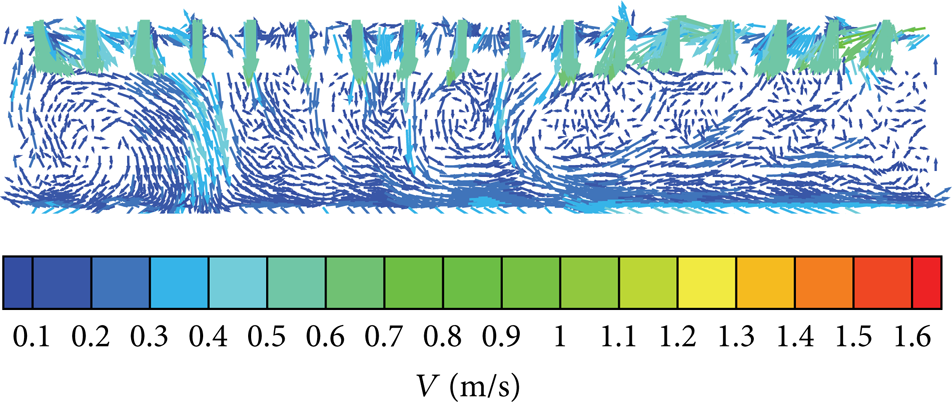
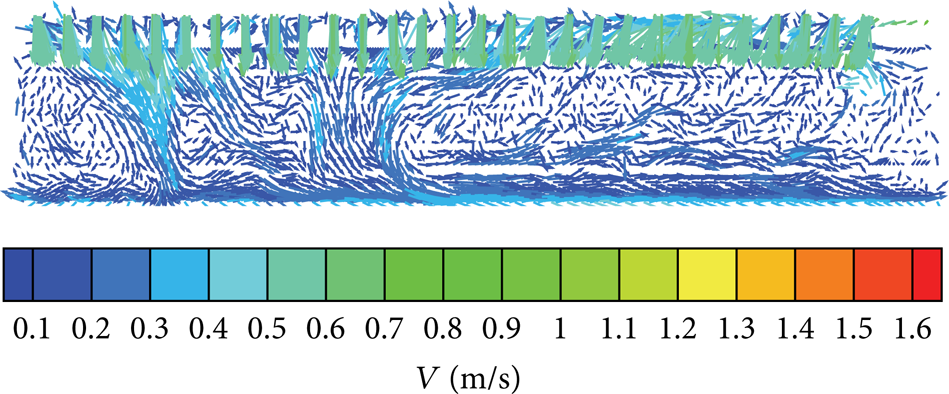
Velocity field at R = 315 mm in winter.

Temperature field at R = 365 mm in winter.

Velocity field at R = 365 mm in winter.
Temperature field at R = 415 mm in winter.
Velocity field at R = 415 mm in winter.

Temperature field at R = 465 mm in winter.

Velocity field at R = 465 mm in winter.
From the temperature distribution figures, it can be seen the summer's temperature field is uniform, the winter's temperature field is nonuniform, and the top of the high-bay depot temperature is higher than that of the bottom. Simultaneously, it can be seen from the velocity vectors distribution that the summer's supply-air can reach the bottom of the high-bay depot. The winter's supply air can only reach the middle of the high-bay depot. This is because the supply-air temperature is lower than the indoor environment in summer, air density is bigger, and the airflow sinks; however, the supply-air temperature is higher than the outdoor environment in winter; gas density is bigger, so the airflow floats upward, which results in the bigger temperature difference between upper and lower. In summer, the change of the supply-air inlet radius can satisfy the temperature range at 25 ± 1°C. However, in winter, the change of the supply-air inlet radius has a little influence on the temperature distribution and cannot satisfy temperature field uniformity requirements, so it needs change of supply-air method to obtain the uniform temperature.
3.2. Effect of the Spacing of Supply-Air Inlet
In the present models, the spacing of supply-air inlet is given as 2500 mm, 3500 mm, 4500 mm, and 5500 mm, respectively. The effect of the spacing on the velocity and temperature distribution is investigated. The air velocity vectors distribution and the temperature distribution of four different models at the x = 22.5 m are shown in Figures 20, 21, 22, 23, 24, 25, 26, 27, 28, 29, 30, 31, 32, 33, 34, and 35.
Temperature field at L = 2500 mm in summer.
Velocity field at L = 2500 mm in summer.

Temperature field at L = 3500 mm in summer.

Velocity field at L = 3500 mm in summer.

Temperature field at L = 4500 mm in summer.

Velocity field at L = 4500 mm in summer.

Temperature field at L = 5500 mm in summer.

Velocity field at L = 5500 mm in summer.

Temperature field at L = 2500 mm in winter.

Velocity field at L = 2500 mm in winter.
Temperature field at L = 3500 mm in winter.

Velocity field at L = 3500 mm in winter.

Temperature field at L = 4500 mm in winter.

Velocity field at L = 4500 mm in winter.
Temperature field at L = 5500 mm in winter.
Velocity field at L = 5500 mm in winter.
From the figures, it can be seen the winter's temperature field is nonuniform, the top of the high-bay depot temperature is higher than the bottom, and the summer's temperature field is uniform. The reason is the same as the above.
3.3. Temperature Nonuniformity Coefficient
Shown in Figure 36 is a summer's and winter's temperature nonuniformity coefficient, which is calculated by extracting 20 points in the high-bay depot. From the figures, it can be seen that temperature nonuniformity coefficient is small in summer, which indicates the relatively uniform temperature distribution in summer, while temperature nonuniformity coefficient is large in winter. By changing the supply-air radius and spacing in summer's conditions, the temperature nonuniformity coefficient of variation is small, but there are large fluctuations in winter.

Temperature nonuniformity coefficient.
4. Conclusions
This paper focuses on the analysis of the effects of radius and spacing of the supply-air inlet on the temperature distribution in the high-bay depot. The computational results show that the temperature distribution are affected by radius and spacing. Moreover, the effect is more obvious in winter than in summer. Meanwhile, the temperature distribution is uniform in summer and the temperature nonuniformity coefficient is small. On the contrary, the temperature gradient is large in vertical direction in winter and the temperature nonuniformity coefficient is large in winter.
By changing the radius and spacing of supply-air inlet, the results show that the summer's temperature nonuniformity coefficient changes from 0.0094 to 0.0137 and the winter's temperature nonuniformity coefficient changes from 0.0564 to 0.0829. From the temperature field, we can find that the temperature at top of high-bay depot is high and the temperature at the bottom of high-bay depot is too low in winter. Further investigation should optimize the high-bay depot model of winter.
Conflict of Interests
The authors declare that there is no conflict of interests regarding the publication of this paper.
Footnotes
Acknowledgments
The present work is supported by the Project of National Natural Science Foundation of China (no. 21076200), Henan province and college cooperation projects (no. 092106000013), and supported by Foundation for University Key Teacher (2012GGJS-115) and Innovation Scientists and Technicians Troop Construction Projects of Zhengzhou City (131PLJRC640).