
Abstract
A scientific evaluation index system for intelligent transportation system (ITS) can play an important role in guiding the development of ITS for decision makers in smart communities. This study aims to develop a set of performance indicators for the effective evaluation of the transportation system in a smart community in China. The main goals of the developed evaluation index are determined after a careful review of the various index systems implemented by various agencies worldwide. A set of indicators divided into the following six categories are then presented: transport structure, traffic information service, traffic efficiency, traffic safety, energy and pollution reduction, and social inclusion. To further discuss the practical application of the index system, a number of indicators are defined in detail and applied in arterial and public transportation efficiency evaluations based on the available dataset. Results from the index calculation show that the index proposed in this study can be adopted in evaluating the transportation system performance in smart communities based on big data.
1. Introduction
The novel concept of “smart community” (or “smart city”) [1] has already been adopted by a number of cities, such as Beijing, Shanghai, and Guangzhou, in China. This idea is deemed as the future direction of urban development in China. By 2013, more than 150 Chinese cities had chosen the realization of a smart community as one of their main targets for urban development. Among these cities, 80% have claimed the Internet of Things as the leading industry. In December 2012, the Ministry of Housing and Urban-Rural Development of China carried out the National Smart Community Pilots Notice, which included the National Smart Community Pilot Index System [2]. A total of 90 communities were selected for the first batch of smart community pilots.
We often refer to the so-called intelligent transportation system (ITS) when discussing the transportation system in a smart community. The ITS can be viewed as a fundamental symbol of smart cities [3]. Although the concept of smart community applies in almost every aspect of urban operation and management, its application in the development of a transportation system is given high priority. ITS covers a wide range of areas, including electronic payment facilities, safety and emergency facilities, traffic management, public transport operations, and numerous other aspects of transportation systems.
With the growing negative effects of transport activities in cities, decision makers have become increasingly aware of the need to implement solutions that promote the achievement of smart community systems and ITS. Therefore, the development of indicators for the measurement and assessment of transport activities in a smart community may play an important role in the decision- and policy-making process. Generally, performance indicators can be regarded as tools to “simplify, measure and communicate trends and events” or as “quantitative measures that can illustrate and communicate complex phenomena simply, including trends and progress over time” [4]. Decision makers invariably employ carefully developed indicators, which reflect the values and goals of society and serve as key drivers of change, to measure and understand the directions of progress.
The selection of indicators for an ITS in a smart community should reflect the multidisciplinary nature of a transportation system. As the transportation issue in smart communities is extremely complex and involves various aspects, the set of indicators may include many transport aspects. Litman [5] suggested that indicators linked to transport activities should be balanced to reflect a combination of economic, social, and environmental objectives and be applicable at several levels.
The scope of the present study covers a review of the major transport-related indexes developed by several agencies. This study also develops an index system for transportation systems in smart communities based on big data, which will be collected from a smart community. The study aims to develop a set of indicators for the measurement and evaluation of transportation system performance and its relationship with the operation of an entire smart community.
This paper is organized as follows. Section 2 provides a literature review of existing index systems for urban transportation system. Section 3 introduces the major goals of the developed index system, followed by a detailed description of a number of developed indicators. Section 4 presents the application of the developed indicators based on big data. The final section provides practical conclusions drawn from the development and application of the index system.
2. Literature Review
A set of indicators that sufficiently reflect the performance of a transportation system are important for the development of a transportation system. Several customized performance indicators related to the transportation system have recently been proposed and tested to promote the development of sustainable transportation systems or other new concepts of transportation systems [6–8].
In the past decade, several sets of performance indicators were developed to evaluate the sustainability of transportation systems [9–13]. A performance measurement-based sustainability evaluation methodology was developed for the strategic plan of the Texas Department of Transportation (TxDOT) [14]; the methodology included 13 performance measures covering the five goals of the TxDOT's strategic plan, namely, to reduce congestion, to enhance safety, to expand economic opportunity, to improve air quality, and to increase the value of transportation assets. Jeon et al. [15] proposed 30 indicators to cover the four dimensions of sustainable transportation. Haghshenas and Vaziri [16] summarized urban sustainable transportation indicators defined in the past 20 years and categorized these indicators into three main groups, namely, transportation environmental impact indicator, transportation economic impact indicator, and transportation social impact indicator.
The United States Environmental Protection Agency released a guidebook that describes 12 performance measures for the environmental, economic, and social sustainability of a transportation system [17]. This document focuses on transportation decision making at the regional or metropolitan level, although many of the performance measures described therein can be used at the state or local level. For each measure, the guidebook presents possible metrics, summarizes the relevant analytical methods and data sources, and illustrates the use of each measure by one or more transportation agencies. In 2011, a guidebook for the Sustainability Performance Measurement for Transportation Agencies in the United States was developed [18]; this guidebook includes a set of sustainability goals, including safety, basic accessibility, equity/equal mobility, system efficiency, security, prosperity, economic viability, ecosystems, waste generation, resource consumption and emissions, and air quality.
Meanwhile, several key performance indicators have been established for the development of ITSs; these indicators include indices for traffic efficiency, traffic safety, pollution reduction, social inclusion, and land use [19].
A research group in the United States conducted a survey on transit-oriented development performance [20]. A total of 96 agencies were analyzed, and 56 indicators were identified. These indicators were then categorized into the following five groups: (1) travel behavior: parking and traffic flow; (2) economic: public and private investment; (3) environmental: air quality and energy use; (4) built environment: design quality, pedestrian friendliness, and land use; and (5) social: diversity, safety, and affordability.
Several transportation system performance indicators have also been developed in China. A total of 34 indicators were identified in the “Smooth Engineering” evaluation index for urban transport system developed by the Ministry of Public Security and the Ministry of Housing and Urban-Rural Development of China, and so forth [21]. These indicators are categorized into the following six groups: (1) management mechanism for urban traffic system, (2) road infrastructure condition, (3) green transportation system development, (4) scientific organization and management of traffic, (5) urban traffic safety condition, and (6) culture and ethical quality of transport. Each indicator has the following five parts: (1) symbol, (2) definition, (3) main criteria, (4) possible metrics, and (5) grading table.
In the “Transit-Metropolis” evaluation index draft developed by the Ministry of Transport of China, the indicators are categorized into the following five groups: (1) basic requirement (e.g., share rate of urban transit ridership and density of urban public transit line network), (2) service (e.g., coverage of public transit station and speed of public transit vehicle), (3) infrastructure (e.g., rate of harbor-shaped bus stops, rate of urban arterials, and important intersections with signal control), (4) safety (e.g., average accident rate per year and average fatal rate per year), and (5) management (e.g., usage rate of Intelligent Card).
A number of approaches can be used to analyze and develop indicators. Smith et al. [22] used the process analysis method to generate an indicator set that is consistent with a declared definition of a sustainable transport system. Castillo and Pitfield [23] proposed the Evaluative and Logical Approach to Sustainable Transport Indicator Compilation (ELASTIC), which is a methodological framework used to identify and select sustainable transport indicators, and demonstrated this framework application in the English regions, UK.
Multiattribute utility theory (MAUT) is often implemented in the evaluation and decision-making process [14, 24]. As a type of a multiple criteria decision-making process [25], MAUT theory may serve as a quantitative basis for the application of performance measures. The fundamental steps of this methodology include quantification, scaling, and weighting of individual performance indexes. The weighted sum of individually scaled measures is used to obtain an aggregate indicator value for a group of performance measures. When indicators are weighed, the sum of the weights for individual measures should be equal to 1, and the indicator is given high weight if decision makers believe it to be greatly important. The following two sets of weights are used: goal weights and measure weights [14].
3. Index Development
When evaluating ITS in a smart community, we should not merely consider the operation efficiency and safety of the transportation system itself. Instead, great emphasis should be placed on how the system serves to improve the quality of life of the residents in the community and on how the system is organically integrated with the smart community. Therefore, environmental protection as well as different social groups and other related targets should be considered when determining the main goals of a transportation system.
In this study, we mainly consider the following goals for an ITS in a smart community:
to enhance traffic safety;
to improve air quality;
to enhance traffic efficiency;
to improve economic opportunity;
to increase the value of transportation assets;
to promote social equity;
to improve quality of life.
Currently, the use of big data has expanded to the transportation field [26]. The large amount of collected data, referred to as big data, provides new approaches for decision makers to evaluate the transportation system periodically or in real time and supports the development and application of various indicators.
On the basis of the main goals mentioned above, we develop a set of indicators, which are divided into the following six categories: transport structure, traffic information service, traffic efficiency, traffic safety, energy and pollution reduction, and social inclusion. The detailed indexes extensively discussed later in this paper are listed in Table 1.
Assessment index for a transportation system in a smart community.
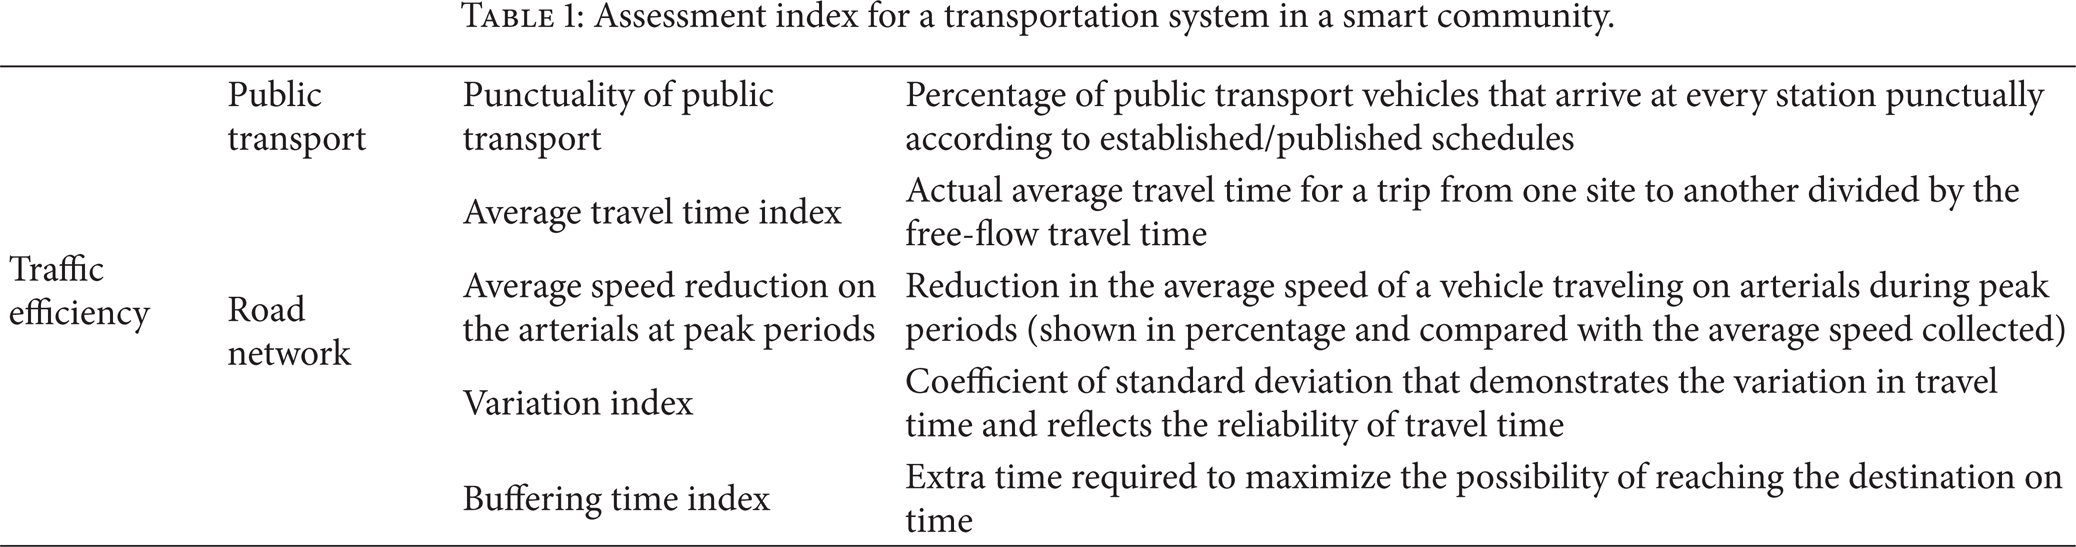
Each indicator includes the following parts: definition, goal, unit, levels, relationship with other indexes, application phase(s), calculation method, and data source [27]. The details of the indicators other than their definitions are explained in a later section.
4. Index Application
Rapid developments in data collection and storage technology have contributed to the variety of real-time traffic data from urban traffic monitoring systems. Currently, big data in the field of transportation may include license plate recognition (LPR) data [28], GPS positioning data, automatic vehicle location (AVL) data, and smart phone data [29]. In this section, we aim to analyze the practical application of several developed indicators based on the collected “big data.”
4.1. Arterial Efficiency Evaluation
We introduce below the definitions of the indicators used in this section.
4.1.1. Variation Index
Definition. The variation index, namely, coefficient of standard deviation, demonstrates the variation in travel time and reflects the reliability of travel time [30]. This index can be used to deal with trips with different travel distances.
Calculation Method. The travel time of vehicles passing the section during a five-minute interval is analyzed using the following:

where s is standard deviation of travel time and m T is mean of travel time.
Levels. The levels are as follows: A: ≤0.2, B: ≤0.3, C: ≤0.4, D: ≤0.5, and E: >0.5.
Data Sources. Data sources include travel time data, which can be collected by GPS-based on-board devices, LPR data, AVL data, RFID data, Bluetooth data, and so forth.
The variation index focuses on estimating the standard deviation of travel times and comparing it with the average travel time to reflect the variability and reliability of travel time.
4.1.2. Buffering Time Index
Definition. The buffering time index calculates the extra time required to maximize the possibility of reaching the destination on time [31].
Calculation Method. The travel time of vehicles passing the section during a five-minute interval is analyzed using the following:
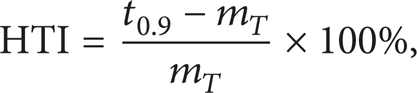
where HTI is the buffering time index; t0.9 is the 90th percentile of travel time; m T is the mean of travel time.
Levels. The levels are as follows: A: ≤0.2, B: ≤0.4, C: ≤0.6, D: ≤0.8, and E: >0.8.
Data Sources. Data sources include travel time data, which can be collected by GPS-based on-board devices, LPR data, AVL data, RFID data, Bluetooth data, and so forth.
The buffering time index reflects the reliability of travel time by expressing the amount of extra buffer time needed to be on time for 95% of the trips.
4.1.3. Average Travel Time Index
Definition. Theactual average travel time for a trip from one site to another is divided by the free-flow travel time.
Calculation Method. Consider
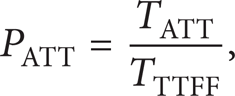
where PATT is the average travel time index; TATT is the actual travel time; TTTFF is the free-flow travel time.
Levels. The levels are as follows: A: ≤1.5, B: ≤2, C: ≤2.5, D: ≤3, and E: >3.
Data Sources. Data sources include travel time data, which can be collected by GPS-based on-board devices, LPR data, AVL data, RFID data, Bluetooth data, and so forth.
The average travel time index reflects the capability of the current road network and evaluates the road design compared with the design speed.
4.1.4. Average Speed Reduction on the Arterials at Peak Periods
Definition. The reduction in the average speed of a vehicle traveling on the arterials during peak periods, shown in percentage, is compared with the average speed collected.
Calculation Method. Consider

where P
r
is the reduction rate of average speed for a vehicle during peak periods; Δv is the reduction of average speed for a vehicle during peak periods (one hour for morning peak and one hour for evening peak);
Levels. The levels are as follows: A: ≤20%, B: ≤30%, C: ≤40%, D: ≤50%, and E: >50%.
Data Sources. Data sources include speed data, which can be collected by GPS-based on-board devices, LPR data, AVL data, RFID data, Bluetooth data, microware detectors, loop detectors, and so forth.
The average speed reduction on the arterials at peak periods reflects the impact and severity of congestion during peak periods.
The four indicators in this section are aimed at providing an overall evaluation of the performance level of arterial traffic. The results can help traffic operators to assess the reliability of travel time and congestion level by studying the changes in vehicle speed. These factors can be further applied in decision making for traffic guidance and control measures.
During the past decade, LPR data from video cameras have become an emerging data source in urban transportation systems. In China, LPR systems have been deployed in several cities. LPR data are regarded as a typical type of big data in the field of transportation because of the characteristics of the LPR system, which involves a large amount of data. The coverage area of surveillance cameras can be a potential problem in LPR data application. The accuracy of plate number recognition can also be influenced by extreme weather conditions or equipment damage.
LPR data for one day, that is, November 8, 2012, were collected from three continuous signalized intersections on a typical urban arterial in Qinhuangdao city (Figure 1).
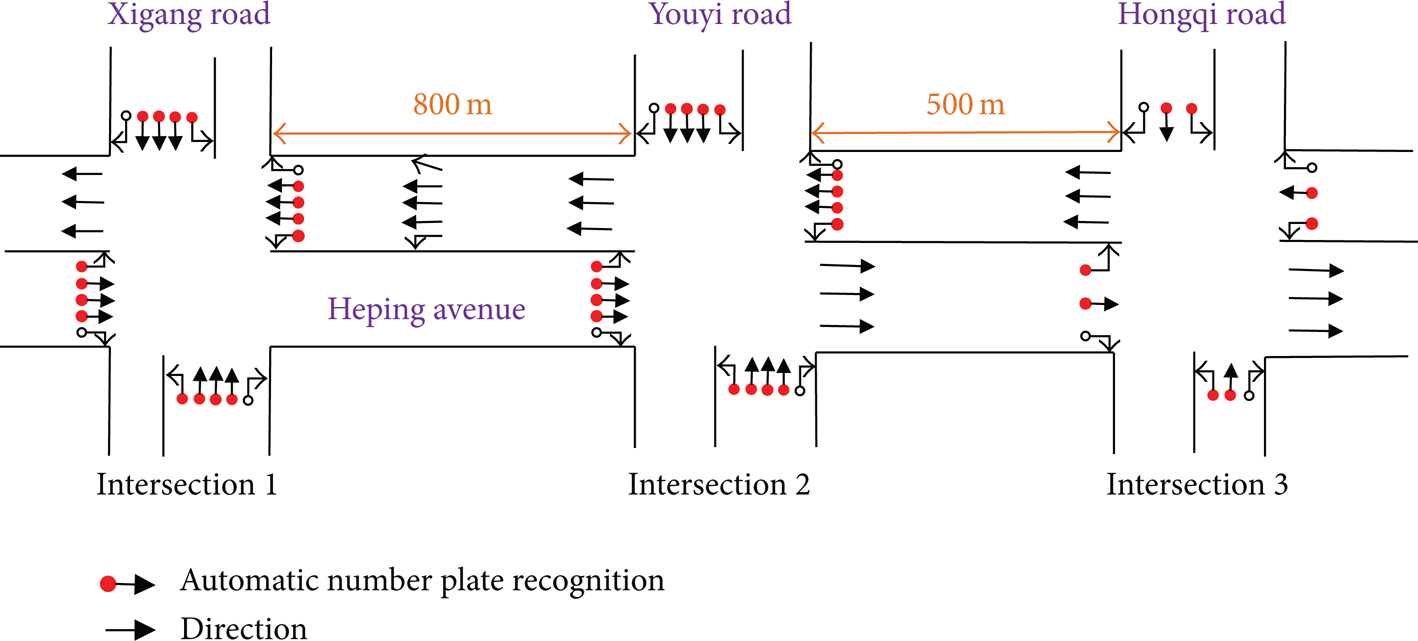
Layout of the three selected intersections.
Figure 1 shows the eastbound through-through traffic flow data chosen for this study. The term “through-through” refers to a vehicle passing straight through the upstream intersection and continuing straight through the downstream intersection. Each record of a vehicle in the database includes the following fields: record ID, vehicle plate number, vehicle type (1: large vehicle, 2: small vehicle), vehicle passing time, intersection ID, driving direction, lane number, vehicle speed, and plate color.
Table 2 demonstrates the evaluation of several indexes for road sections between intersections 1 and 2 on November 8, 2012. Part of the results during peak hours is listed in Table 2.
Evaluation of indexes for road section between intersections 1 and 2 on November 8, 2012.
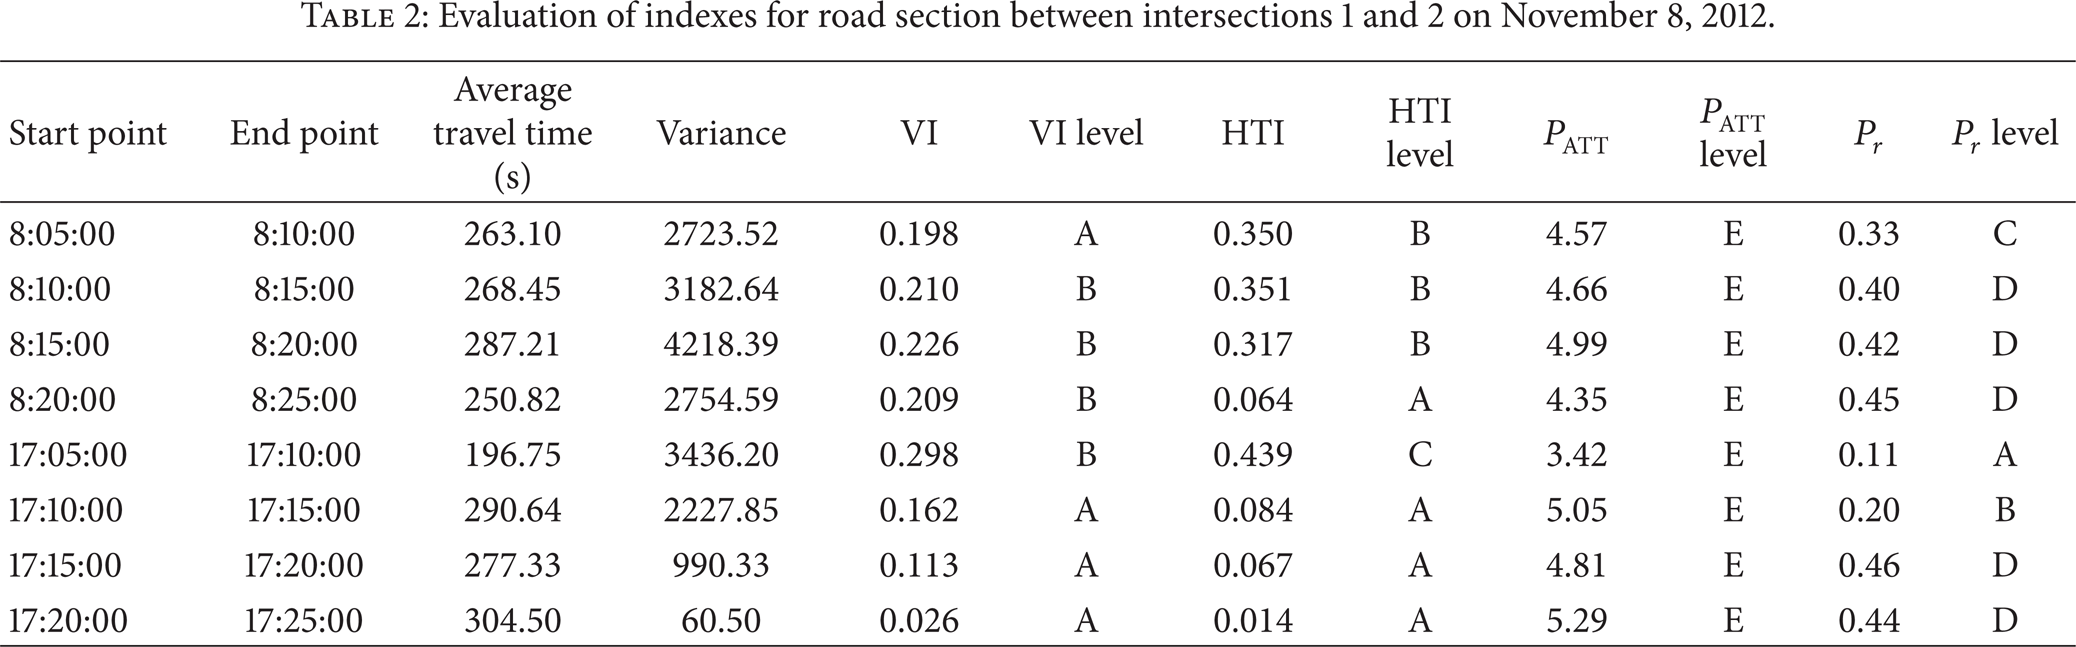
Table 2 shows that the values of the selected indicators can be well calculated with the available dataset and that users can determine the level for each indicator. However, the discrepancy in the levels obtained from different indicators for the same time interval suggests a potential defect in the grading method. Specifically, the reference values used in the current grading method are determined based on rule of thumb. Therefore, this method may still be improved.
Figure 2 shows the average travel time index for the road section between intersections 1 and 2 on November 8, 2012. During peak hours (morning peak hours and evening peak hours), the average travel time is longer than that during nonpeak hours. Figure 3 shows the variance for the road section between intersections 1 and 2 on November 8, 2012.
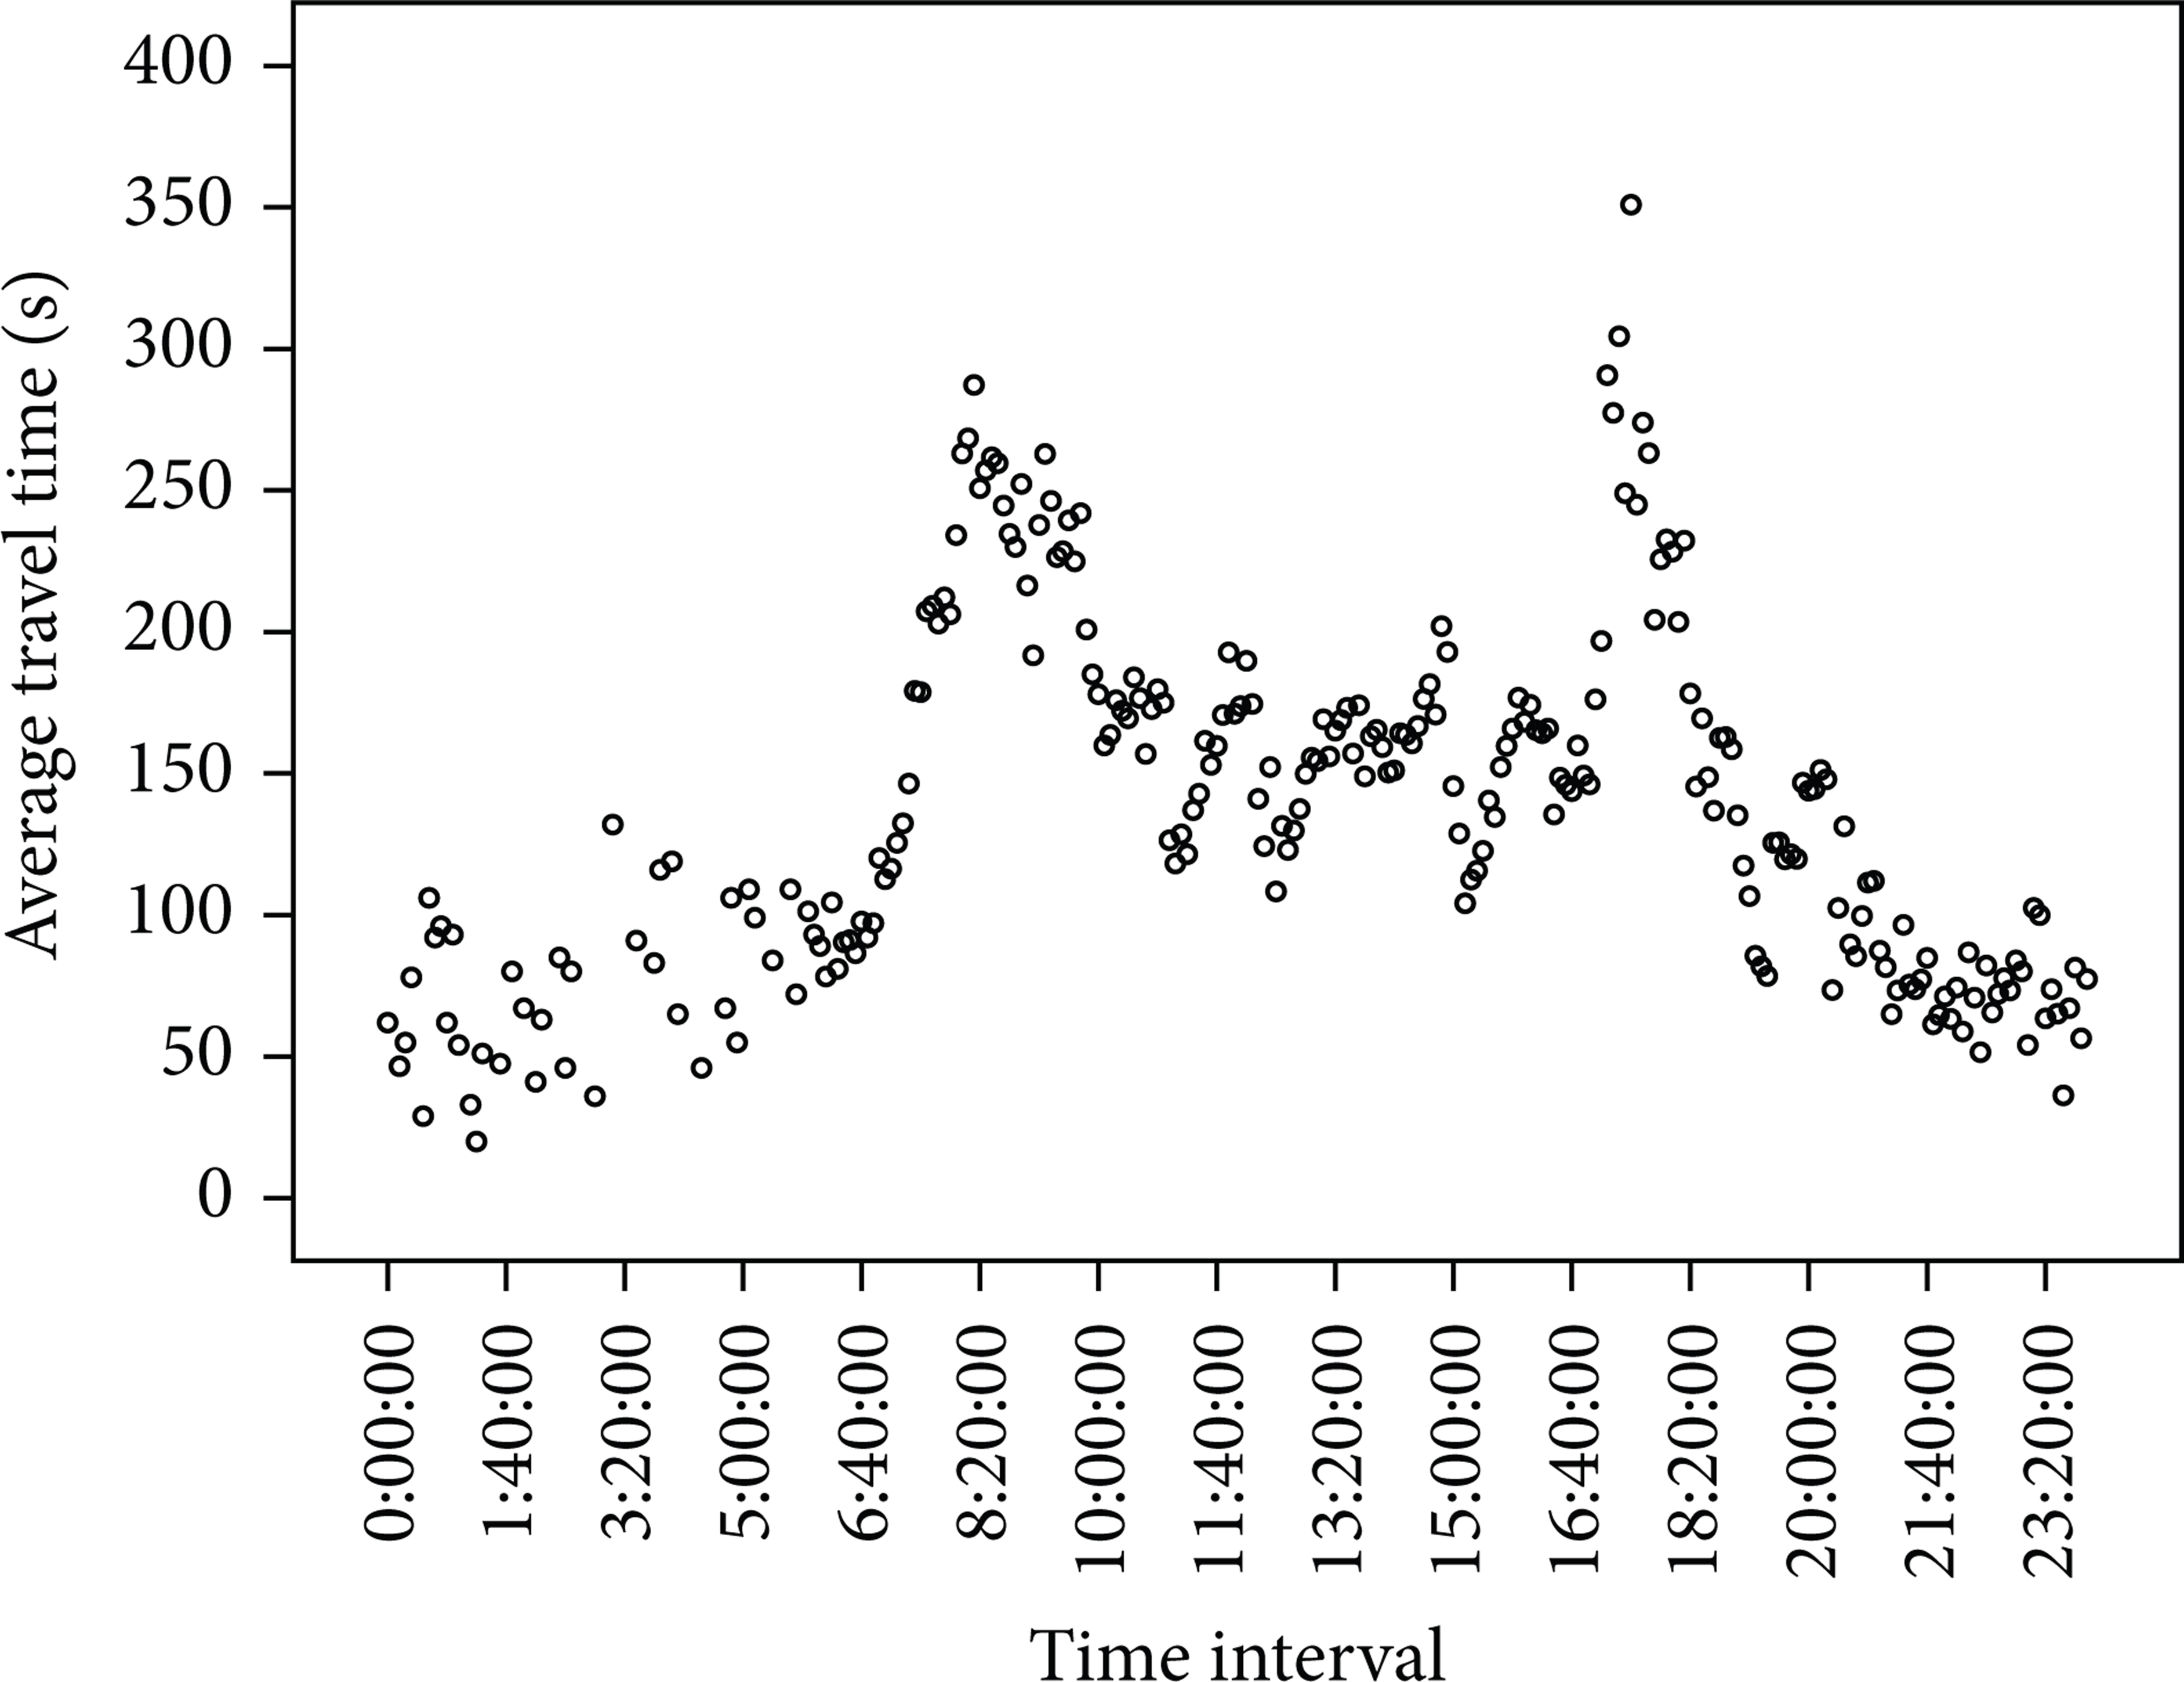
Average travel time every five minutes.
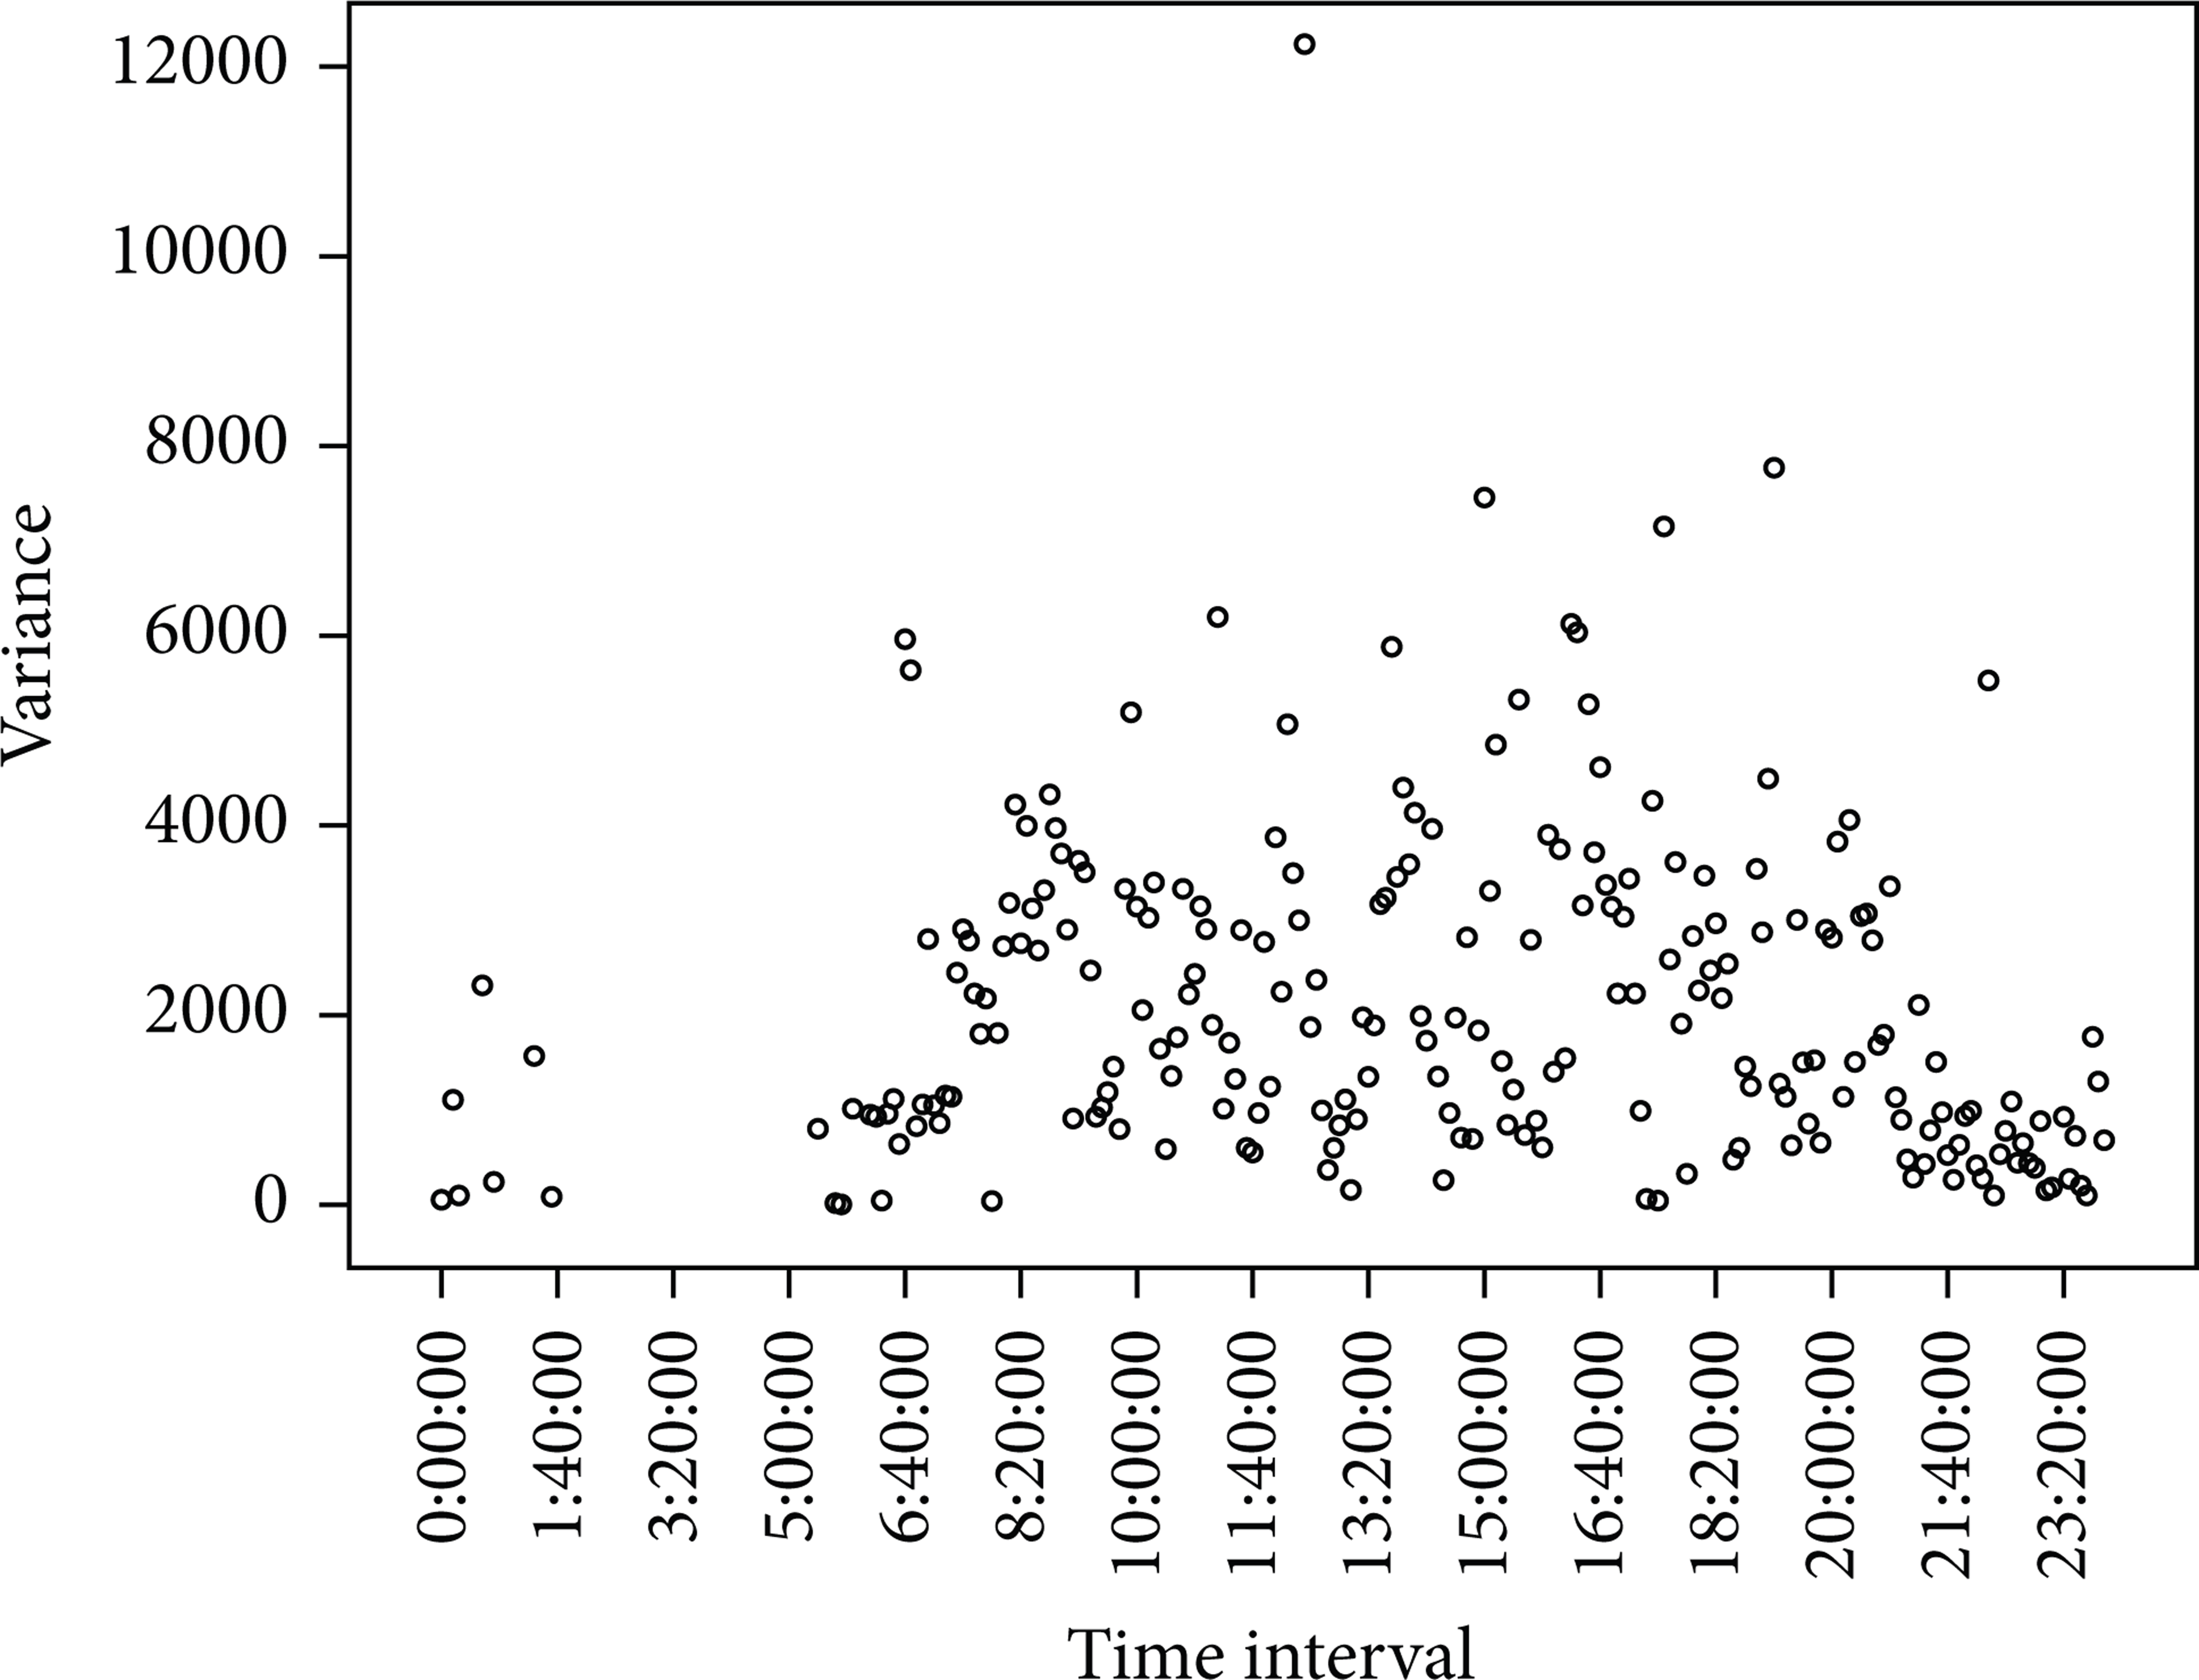
Variance of travel time every five minutes.
Figure 4 shows the variation index for the road section between intersections 1 and 2 on November 8, 2012, in which the y-axis VI represents the variation index. Figure 5 shows the variation index for the road section between intersections 1 and 2 on November 8, 2012, in which the y-axis HTI represents the buffering time index.

VI of travel time every five minutes.

HTI of travel time every five minutes.
Figures 2, 3, 4, and 5 show that operators can apply the developed indicators and obtain corresponding results based on real-time big data.
4.2. Public Transportation Efficiency Evaluation
In this section, we mainly evaluate the punctuality of public transport. This indicator can be used by the operator of a public transportation service to evaluate the latest performance level of buses. The results can serve as basis for publicizing real-time bus information for passengers. The definition of this indicator is introduced in the following.
Indicator. The indicator is punctuality of public transport.
Definition. It is the percentage of public transport vehicles that arrive at every station punctually according to established/published schedules: if the actual arrival time at a stop is a minute early or two minutes late, then this stop is considered punctual.
Calculation Method. Consider

where Ppun is the punctuality rate of transit; Npun is the number of buses arriving on schedule at each bus stop; N is the total number of buses arriving at each bus stop.
Levels. The levels are as follows: A: ≥90%, B: ≥80%, C: ≥70%, D: ≥60%, and E: <60%.
Data Sources. Data sources include travel time data, which can be collected by GPS-based on-board devices and AVL data.
AVL data are used in this section to calculate the punctuality of public transport. One challenge of using AVL data is data preprocessing and filtering, which requires the exclusion of outliers from the dataset. This exclusion process is similar to that for cases of deviation from the normal route. The cost of equipping buses with AVL devices should also be considered before large-scale applications.
The data used in this section originated from the AVL system of the Massachusetts Bay Transportation Authority (MBTA) and include all statistics concerning bus number 96 (two directions: outbound and inbound) from June 4 to 15, 2012.
Each record of a vehicle in the database includes the following fields: crossing ID, service date, run block, operator, vehicle, half trip ID, route, direction, variation, stop, time point, time point description, time point order, scheduled arrival, scheduled departure, punctuality, scheduled headway, headway, and point type.
The evaluation is performed for three different conditions: inbound direction, outbound direction, and a combination of the two directions. Only the results of the combination of the two directions are listed for the following three indexes because of space limitations.
Table 3 and Figure 6 demonstrate the punctuality of bus number 96 each day for 12 days in the two directions. For most days, the punctuality of the bus is satisfactory during morning peaks but poor during evening peaks.
Punctuality of bus number 96 in two directions.
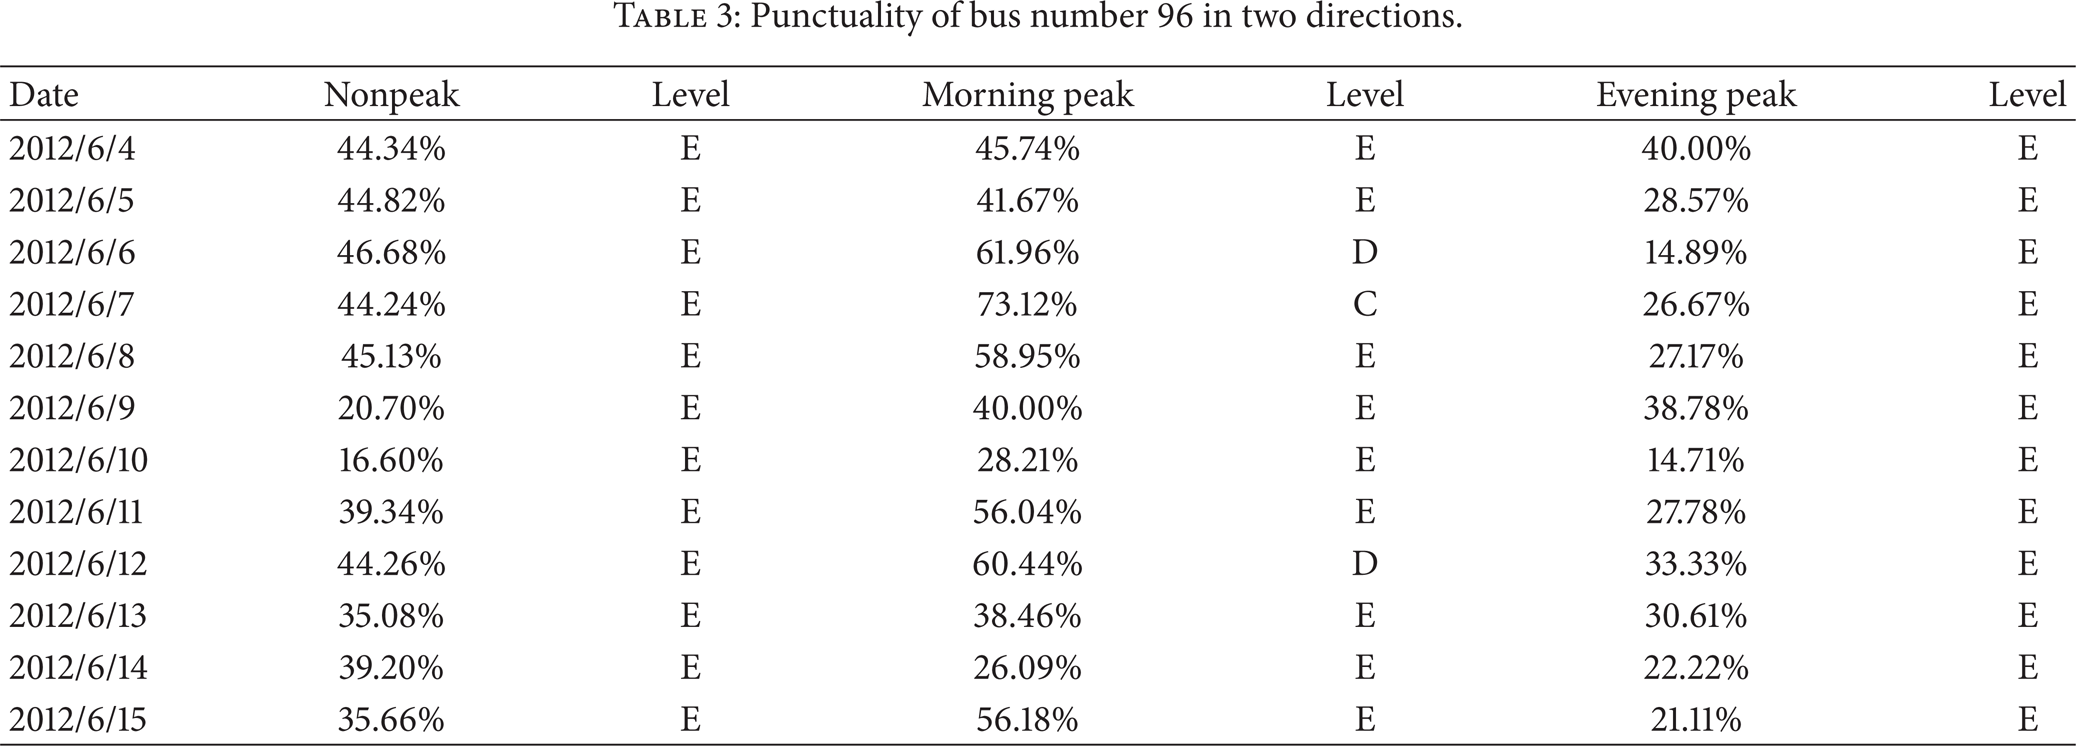
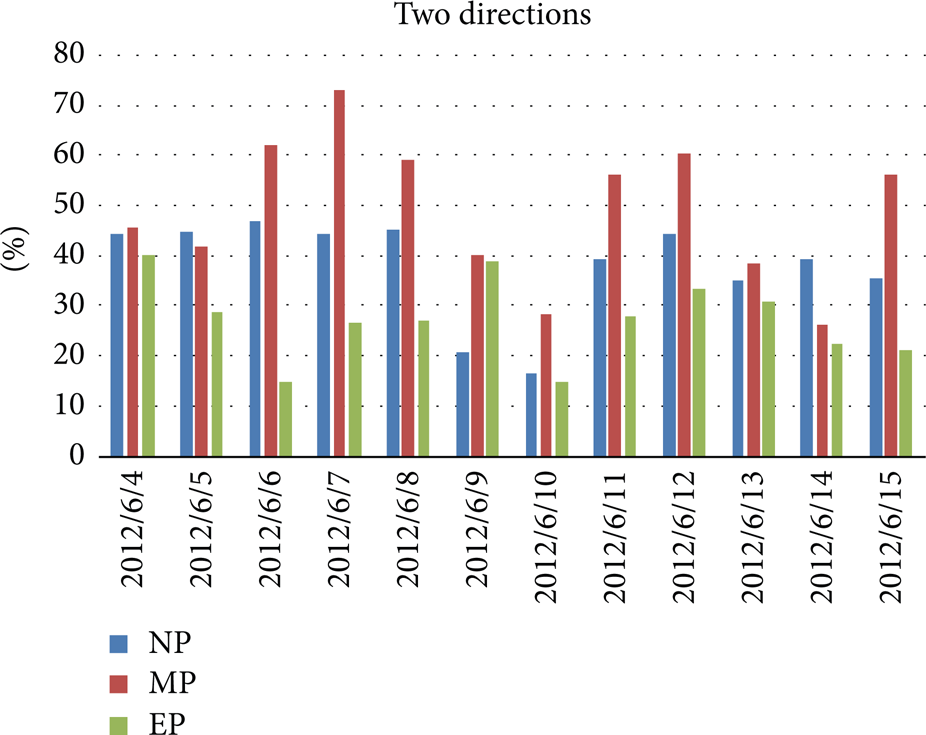
Punctuality of bus number 96 in two directions. Note: NP: nonpeak, MP: morning peak, and EP: evening peak.
5. Conclusion and Future Works
In this study, we presented a set of indicators for a transportation system in a smart community. These indicators were divided into six groups, namely, transport structure, traffic information service, traffic efficiency, traffic safety, energy and pollution reduction, and social inclusion. We primarily focused on the following issues: (1) use of data obtained from the LPR system in a city in China to demonstrate the application of several indices on travel time on the arterial road; (2) use of AVL data obtained from the MBTA in Boston to demonstrate the application of several indices in the public transportation system. These applications reveal that the indicators proposed in this research can be used to assess transportation system performance in smart communities.
Several areas require further investigation in the future.
Refine the index system. The indices identified in this study are large in number and may require refinement in the future. Core indices should also be studied further.
Validate indicators from the results of the applications. Addressing this concern should be a long-term process. Several indicators can be validated based on the available dataset.
Conflict of Interests
The authors declare the lack of conflict of interests regarding the publication of this paper.
Footnotes
Acknowledgments
This project is funded by Tsinghua-Toshiba Energy and Environment Research Center. The authors would like to thank Mr. Yoshiyuki Sakamoto in Toshiba Corporation, Mr. Satoshi Sekine, Dr. Junichi Yamamoto, Dr. Makoto Kano, and Mr. Ryoya Mori in Toshiba Solutions Corporation for their valuable discussion. The authors would also like to thank the Qinhuangdao Traffic Management Bureau and Professor Nigel H. M. Wilson of Massachusetts Institute of Technology for their support on data collection. The authors would also like to thank the Collaborative Innovation Center for Capital World City's Smooth Traffic Construction for its support.