
Abstract
Geosensor networks and sensor webs are two technologies widely used for determining our exposure to pollution levels and ensuring that this information is publicly available. However, most of these networks are independent from each other and often designed for specific domains, hindering the integration of sensor data from different sources. We contributed to the integration of several environmental sensor networks in the context of the IDEA project. The objective of this project was to measure noise and air quality pollution levels in urban areas in Belgium using low-cost sensors. This paper presents the IDEA Environmental Measurement Cloud as a proof-of-concept Data-as-a-Service (DaaS) cloud platform that integrates environmental sensor networks with a sensor web. Our DaaS platform implements a federated two-layer architecture to loosely couple together sensor networks deployed over a wide geographical area with web services. It offers several data access, discovery, and visualization services to the public while serving as a scientific tool for noise pollution research. After one year of operation, it hosts approximately 6.5 TB of environmental data and offers to the public near real-time noise pollution measurements from over 40 locations in Belgium.
1. Introduction
Accurately measuring environmental pollution, spatially and temporally, and effectively distributing this information to the public are the first key steps towards protecting our environment. These two steps are made possible by two crucial technologies: geosensor networks and the sensor web [1, 2].
A geosensor network (GSN) is defined as spatially distributed sensor nodes connected together to detect, monitor, and track environmental phenomena and processes [3]. It enables the accurate measurement of environmental pollution in relatively high spatiotemporal resolutions [4]. On the other hand, a sensor web facilitates access to the GSN's data and procures the distribution of the GSN's real-time data streams to third-party applications [1, 3]. These two technologies, when combined together to provide transparent access to environmental data in a Data-as-a-Service (DaaS) cloud model [5], will be defined in this paper as an Environmental Measurement Cloud. This cloud provides a fine-grained environmental reality to its users and it serves as a powerful tool for government authorities to locate pollution sources and discover polluting processes [6].
In this paper, we propose an architecture to implement a research-oriented environmental measurement cloud that leverages time proven enterprise integration design patterns. The proposed architecture is divided into two main layers: one encapsulates the software and hardware resources in a GSN (resource layer) and the other are the services offered by a sensor web (service layer). These two layers form a simple and yet flexible DaaS cloud that integrates multiple and heterogeneous research-oriented GSNs to provide data dissemination and sharing services.
2. Cloud Systems
A cloud is a system where computing resources are accessed ubiquitously and on demand [7]. The most commonly accepted cloud computing models are the three defined by the National Institute of Standards and Technology (NIST): Infrastructure-as-a-Service (IaaS): delivers basic computer infrastructure resources such as processing, storage capacity, and networks; Platform-as-a-Service (PaaS): delivers a complete computing platform and solution stack for application developers; Software-as-a-Service (SaaS): delivers software or applications ready to run on a thin client [7]. There are more cloud computing models outside of the NIST definition [8]; one example relevant to this paper is Data-as-a-Service (DaaS), a relatively new type of cloud computing service that provides data on demand via an API [9].
Modern GSNs implementations are also being used in environmental research applications that add additional pressure for fine-grained monitoring. Specifically, in the context of noise pollution, research on predictive model [10], computational auditory scene analysis (CASA) [11], and sound source localization [12] demand higher spatiotemporal resolutions (compared with air quality or temperature sensors) and more computationally intensive data processing tasks. These extra demands pose unique challenges in the implementation of research-oriented environmental measurement clouds.
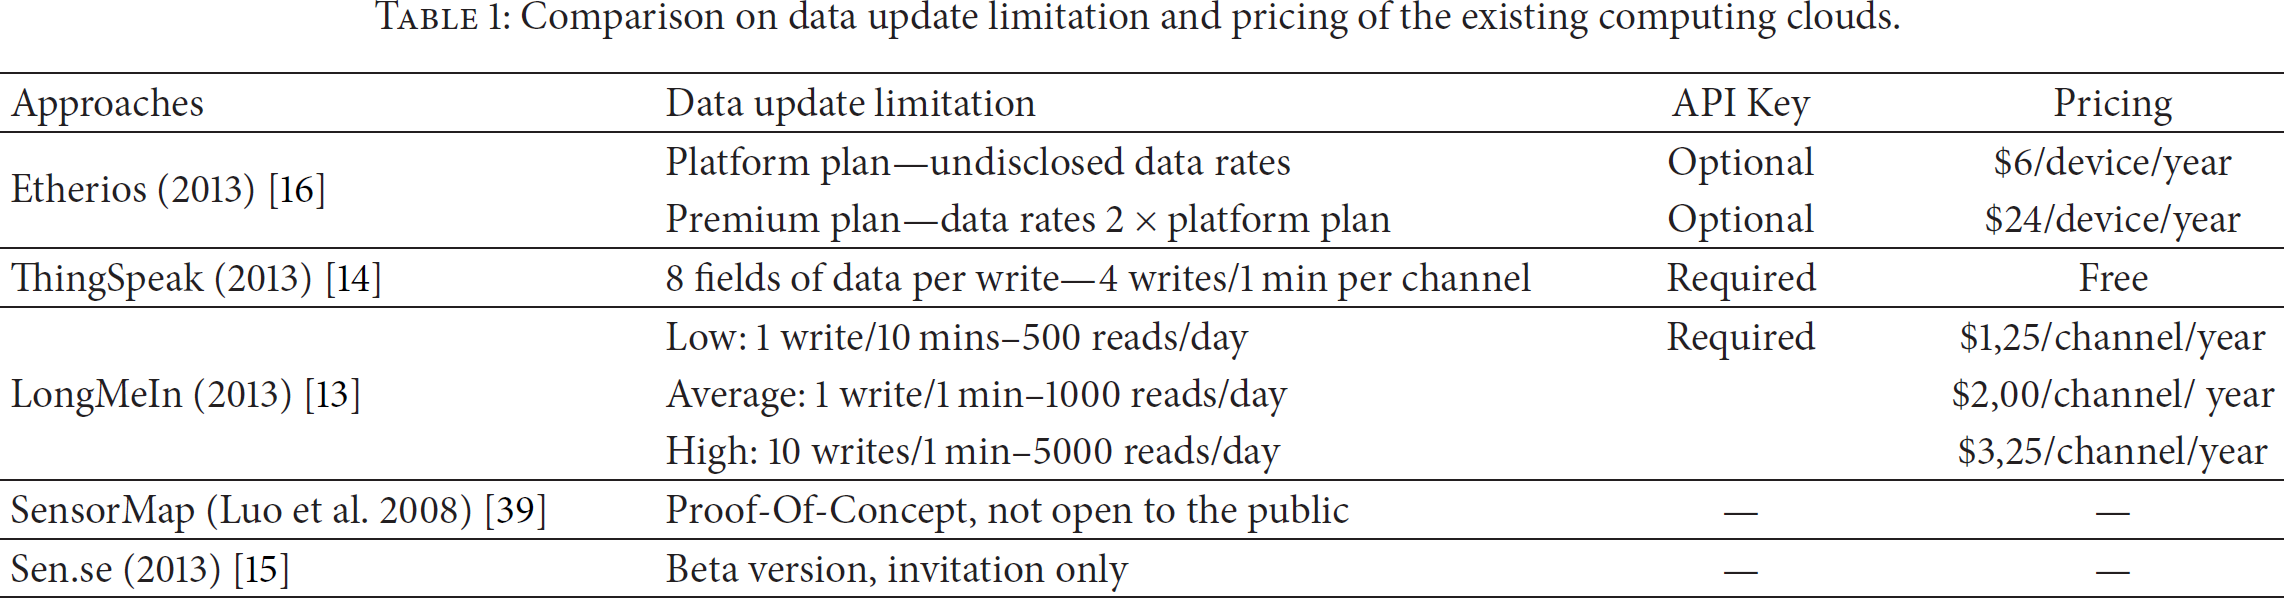
Currently, commercial cloud solutions exist to distribute and visualize data from GSNs such as Xively [13], ThingSpeak [14], Open.sen.se [15], and Etherios [16]. These cloud offerings are either still in development or are not designed to cope with the temporal data resolutions and large data volumes necessary for research-oriented GSNs. Additionally, security concerns regarding the use of commercial cloud offerings are cited by Subashini and Kavitha [17] as a motivation to develop in-house private clouds. Table 1 summarizes the current commercial or open cloud computing options available for distributing environmental data.
Comparison on data update limitation and pricing of the existing computing clouds.
These reasons have forced GSNs owners to implement their own ad hoc environmental measurement clouds, typically using a Service Oriented Architecture (SOA). Proposals to implement SOA-based sensor webs using available enterprise software were discussed as early as 2006 in de Deugd et al. [18] but an accepted consensus on the appropriate architecture was still missing by 2010 [19] and to the best of our knowledge it still is. Consequently, our contribution is a blueprint to implement a DaaS environmental measurement cloud using enterprise design patterns together with a proof-of-concept implementation that monitors noise pollution in the Flanders region of Belgium.
An overview of our proposed architecture is discussed in Section 3 and Section 4 presents a more detailed description of the service layer. The IDEA Environmental Measurement Cloud is introduced in Section 5 as a proof-of-concept implementation of our architecture where two resource layers (one for noise pollution and one for air quality) are deployed. These two resource layers are integrated by the IDEA Service Layer, discussed in Section 6, and the results of this integration plus the data services offered in the past year are discussed in Section 7. An overview of similar systems and a comparison of their functionality and design with ours are presented in Section 8. Finally, in the last two sections, we venture some conclusions about our experiences designing and implementing our environmental cloud and some recommendations for future versions of our system.
3. Main Architecture
The proposed Environmental Measurement Cloud architecture is a blueprint to implement an in-house DaaS system for environmental data. The DaaS cloud computing model is gaining traction in the geospatial sciences [4, 5] where it provides several advantages to users: agility, lower entry cost, device independency, location independency, and scalability [20].
There is not yet a clear consensus on the optimal layered architecture for environmental measurement clouds; however, similar systems exhibit common architectural features. A binary layered architecture is discussed in Zyl et al. [1] where the sensor web infrastructure is divided into two parts: the sensor and networking infrastructure at the bottom and the interoperability services at the top. Similarly, a multilayered Internet of Things middleware architecture is discussed by Atzori et al. [19] and Bröring et al. [21] where devices (sensors, actuators, and routers) are at the bottom and the services and applications are at the top.
The tasks of an Environmental Measurement Cloud can be divided into its two main components: the sensor network and the sensor web. The sensor network encompasses all the hardware and data resources of the system and the sensor web all the data discovery, access, and distribution services. This binary separation of tasks was the main motivation to divide the Environmental Measurement Cloud into two layers: a resource layer and a service layer (Figure 1).

A federated Environmental Measurement Cloud is divided into two layers: a service layer and a resource layer. This division allows the system to offer environmental measurement services originating from several geosensor networks.
On the one hand, the resource layer must be able to handle the requirements of interconnecting a large number of sensor nodes and processing their aggregated collected data. These requirements imply the following three tasks.
Hardware Management. Administer, monitor, and control the deployed hardware in the sensor network. Data Management. Collect and store the raw data of all deployed sensors. Data Processing. Process the raw data and analyze patterns in it. Typical tasks include calculating aggregated data values such as Lden (Day-Evening-Night Noise Level), detecting sensor failure conditions from patterns in the raw data, and determining pollution sources from patterns in the raw data.
On the other hand, the service layer must expose the resources managed by the resource layer using standard data dissemination services that allow resource discovery, data access, and data visualization. The service layer must therefore fulfill the following three tasks.
Data Dissemination. Offer the processed data to stakeholders and the public in human readable and machine readable data access services. Typical tasks include hosting web services to access data in industry standards such as OGC SWE, OData, or a custom RESTful API. Data Access Protection. Authenticate users to authorize access to protected or sensitive data. Alerting. Automatically generate and distribute pollution and resource management alerts. Aggregation. Aggregate environmental data originating from different resource layers, for example, provide a unified data access API that transparently serves data from all geosensor networks.
Data access services offered by the Environmental Measurement Cloud could be used by third parties to provide aggregated services such as data visualization. For example, real-time geo-tagged environmental parameters could be visualized by combining mapping services from a SaaS such as Google Maps, Bing Maps, or OpenStreetMap and data access services from an environmental DaaS.
Figure 1 shows the two-layer task division of the proposed environmental measurement cloud. This cloud is conceived as “federated” because the service layer is capable of offering data services originating from several geosensor networks.
4. Service Layer
The service layer implements the front end of the Environmental Measurement Cloud and its main task is to act as a Data-as-a-Service (DaaS) cloud. Its layer architecture can be viewed as a federated sensor web that must be able to encapsulate several resource layers (sensor networks) from different providers using different technologies. In turn, a resource layer might expose its resources to the service layer using any M2M standard such as OGC SWE, OData, or a custom RESTful API. However, supporting all M2M standards is not the objective of the service layer but rather supporting any as needed.
To accomplish this, we followed two-design best practices: keep it simple and keep it modular. Keeping it simple means, in this case, defining the service layer as a thin layer with reduced functionality and infrastructure that will grow only as new services and standards are needed. Keeping it modular means dividing the functionality and services provided by the service layer in removable modules.
However, keeping the service layer thin implies that a resource layer, in order to be a part of the Environmental Measurement Cloud, must provide an API to its resources (data, sensors, and nodes). This API must abstract as much as possible the complexity and network technologies deployed in its sensor network. For this reason, lower level technologies such as JDBC (to query a database) or SSH (to access a server terminal) are not expected to be exposed to the service layer.
Figure 2 shows the main architecture behind the service layer. The service layer uses two integration technologies: an Enterprise Service Bus (ESB) coupled with a Java Messaging Service (JMS) broker. These technologies provide asynchronous communication support and simplified interconnectivity between the software components of the service layer and the resource layers underneath. Several resource layers are connected to the ESB which in turn will route their served data to the appropriate service modules. These modules are deployed directly as an ESB module or in application containers (e.g., OSGi, Apache Tomcat, JBoss, etc.). These containers provide standardized modularity and scalability.

At the core of the service layer are two integration technologies: an Enterprise Service Bus and a Java Messaging Service broker. The services provided by this layer are implemented in loosely coupled application containers. Together, these technologies provide modularity, flexibility, and scalability.
An Enterprise Service Bus provides interconnectivity among vastly different software modules using an event-driven Service Oriented Architecture (SOA). It is basically an architecture for the integration of enterprise applications and it is widely used in corporations around the world [22]. However, ESBs are not exclusive to business applications; several precedents of their use exist as the core of sensor network middleware. De Deugd et al. [18] presented the ESB as a natural candidate to integrate different devices and applications in a sensor network and Motwani et al. [23] used it as the backbone of their environmental sensor network. An ESB is a natural fit for a sensor web due to its capacity to transparently integrate different sensor networks using different technologies and standards.
A JMS broker allows for loosely coupled integration using an event-driven paradigm [22]. This paradigm lets service layer software components be relatively independent of the underlying technology used by the ESB, the JMS broker, or other modules.
5. The IDEA Environmental Measurement Cloud
The Intelligent Distributed Environmental Assessment (IDEA) project main objective was to develop an environmental measurement network using low cost sensors [24, 25]. As a result of this project, a sensor network was deployed in urban areas in the Flanders region of Belgium. This network, still operational as of 2014, consists mainly of nodes equipped with acoustic noise sensors (Figure 3). However, CO, NO, and Ultra-Fine Particles (UFP) sensors were also deployed. The project's scientific goals were to reduce the costs of environmental sensor networks by developing low-cost microphones to measure noise pollution directly and air pollution indirectly using predictive models [25, 26].

IDEA sensor nodes.
Additionally, as part of the same project, several air quality measurement campaigns were done using mobile sensor nodes in several cities in Belgium. During each campaign volunteers agreed to bike (during their daily commute or outdoor working hours) while carrying with them a mobile sensor node that measured air pollution parameters. Each mobile node was, at the end of each day, connected to a special terminal at the participant's home where all its collected data was offloaded to a remote central repository [27].
5.1. The IDEA Noise Pollution Sensor Network
Starting in 2010, a geosensor network was deployed in several cities in Belgium. It now consists of approximately 40 fixed sensor nodes equipped with low-cost microphones (a few nodes were also equipped with CO sensors). The sensor nodes operate near interesting noise pollution sources such as busy streets, industrial areas, and train tracks. They relay their collected data to a central repository using opportunistic Internet access (GSM network, Power Line Communication, or WiFi).
The IDEA noise pollution sensor network ultimate goal is to improve the environmental awareness of the public but it was also designed to be a tool for scientific research. This research was focused on using CASA to determine the nature of pollution sources (sound recognition), detecting the exact source of pollution sources (sound localization), and improving the quality and value of noise sensors. These tasks could only be accomplished by having access to real-time raw data.
Machine learning techniques such as CASA require a spectrotemporal resolution of at least 1/3 octave bands and 8 Hz sampling to identify most environmental sounds [3, 28]. Occasionally it is necessary to have access to raw data, for example, validation of CASA classifications; therefore, the logging platform sends back 20 seconds of raw unprocessed audio when loud noise sources are detected. These data collection rates require the provisioning of intensive computing resources, especially as the size of the sensor network increases.
Each sensor node in the network measures local Sound Pressure Level (SPL) using a commercial off-the-shelf (COTS) microphone (see Table 2) connected to a Single Board Computer (SBC) ALIX 3D3 from PC Engines (Figure 3(b)). The ALIX 3D3 SBC has a 500 MHz AMD processor, 256 MB of RAM, one Ethernet port, two USB ports, and a 16-bit 48 kHz sampling rate sound card. Additionally, we added to each SBC 4 GB of flash storage and a MiniPCI WiFi card. These characteristics provided us with the minimum computing resources to run an embedded version of Linux and a custom made—using JAVA and C-data logging platform.
The components listed here were used to assemble our noise sensors. The Kingstate capsules were tested as environmental noise sensors [40] and the Knowles microphone capsule has been used extensively for the same purpose in the IDEA network.

The ALIX 3D3 device provided, in 2010, a sensible compromise between price and computing capabilities. Nevertheless, we investigated the possibility of using more power and cost efficient hardware platforms. We deployed a few nodes equipped with cheaper and smaller ARM-based devices: the Beagleboard and the Beaglebone [29]. While their computing resources were sufficient, the extra cost of properly migrating all of our sensing software to an ARM-based architecture proved to be prohibitively high and therefore the ALIX prevailed. Future node versions will most likely be based on newer hardware platforms—such as the Raspberry Pi—which are smaller and considerably have more power and cost efficient.
The required spectral and temporal resolutions initially precluded the use of resource-constrained battery-operated sensor nodes typically found in Wireless Sensor Networks (WSN) applications. We are currently developing a battery-operated node where all sound processing is performed on board using a power efficient FPGA and low-cost MEMS microphones [12]. This node has been designed to work in a WSN—with the ALIX nodes as sinks—to extend the coverage and spatial resolution of the IDEA network.
To support the network infrastructure and the goals of the IDEA project, we created an Environmental Measurement Cloud mirroring the binary layer design described in the previous section and therefore divided it into two layers:
IDEA Resource Layer (IRL) and IDEA Service Layer (ISL).
The IRL manages the hardware and data resources of the noise pollution sensor network and hosts the functionality needed for the research goals of the project. The ISL manages the distribution and visualization of the processed data produced in the IRL plus any other data sources coming from other resource layers in the project. The following sections describe in more detail the design and technology choices of these two layers.
5.2. IDEA Resource Layer (IRL)
The IDEA Resource Layer can be seen as a relatively large number of interconnected nodes—sensor nodes, processing nodes, and storage nodes—each with distinct properties in terms of communication capabilities, storage availability, and processing power. This network of interconnected nodes should be flexible enough to support both ends of the sensing application spectrum, from long-term sensor data collection studies to real-time sensor data monitoring. In addition to straightforward measuring tasks, for which computing, storage, and network requirements can be predicted, the resource layer will also host more complex software tasks that must be performed online. These tasks include data fusion, CASA, data quality assessment, and predictive models for proxy measurements. They could be distributed among the different computing resources available in the resource layer, that is, sensor nodes and servers, to efficiently exploit all our infrastructure. Efficient task distribution—described in detail in Dauwe et al. [30]—is therefore one of the key components in our IRL.
Most existing middleware platforms for sensor networks offer basic measurement services but fall short to offer accompanying processing facilities. One could argue that taking advantage of existing cloud based storage and processing providers is the next evolution in the context of modern sensor networks. In such a system, data is collected in a (possibly distributed) database, and processing is offered by a separate cloud infrastructure, offering the required scaling and cost effectiveness. However, by adopting this approach, several optimization opportunities are missed, most notably the following:
data preprocessing and filtering on the sensor nodes, using application specific components, distributing data to intermediate nodes/sensors for cooperative processing, using adaptive deployment strategies, that is, based on the context, application components can be moved to the data rather than data to the computation. Using this paradigm, the communication cost is greatly reduced.
The IRL is a middleware platform designed for large-scale environmental monitoring. It uses a SOA design to loosely couple components responsible for intelligent data processing and collection. It addresses the many requirements of modern sensor networks such as resource constrained devices, fault tolerance, plug and measure, scalability, and continuous sensor data processing. It leverages the OGC SWE standards to enable the discovery, exchange, and processing of sensor observations, as well as the tasking of sensors. Its use of open standards makes it easier to interoperate and communicate with devices and systems from third parties. It also simplifies the reuse of existing software components when developing new applications.
5.2.1. Architecture
We propose a service-oriented, component-based architecture as a possible approach to tackle the challenges found in modern sensor networks. To give a clear overview of our developed system, we have grouped the high-level components in different sublayers as illustrated in Figure 4.

Each sublayer within IDEA Resource Layer groups high-level components according to their functionality, such as the sensing, transmitting, storage, and processing of sensor data.
The sensor sublayer consists of sensor nodes and sensors. It is responsible for controlling and monitoring all sensor nodes, collecting their data, preprocessing collected data, and handling data transfer to the back-end infrastructure.
The task distribution sublayer acts as a sensor data processing infrastructure. It stores processing tasks definitions in a task agenda database and executes them when necessary using software agents [26, 30].
Various types of sensors exist, which can deliver different types of information, such as chemical analyses of gases, weather data, images, and audio files. The purpose of the storage sublayer is to hide the details of where and how the data is stored.
The OGC Observations and Measurements standard (O&M) defines a domain independent, conceptual model for the representation of spatiotemporal measurement data. The open-source initiative 52° north has provided a reference implementation for the Sensor Observation Service (SOS); it uses O&M to deal with measurements in a standardized way [31]. This model forms the basis for the IRL database which hosts all raw measurements and all processed data originating from the task distribution sublayer.
The interface sublayer acts as an abstraction layer that hides the complexity of the underlying sensor network and processing infrastructure. Based on the service model of the ISL, a set of RESTful APIs was implemented exposing basic functionalities such as access to validated sensor data and sensor tasking. Because the main objective of the interface sublayer is the integration with the ISL, several decisions were taken to efficiently transfer high amounts of data by removing functionalities such as data access protection and enforcing a specific standard encoding. Other than the RESTful APIs, the IRL is able to asynchronously communicate with the ISL through push based messages (JMS).
6. IDEA Service Layer (ISL)
The ISL is an implementation of a service layer that aims to provide a DaaS cloud service for the project's resource layers. It implements the ESB and the JMS broker using MuleSoft's Community ESB and Apache ActiveMQ, respectively (Figure 5). It uses a Felix OSGi container and a MySQL database to store web services performance statistics and access logs. Additionally it has an OpenLDAP authentication backend where users, groups, and access rules are stored.
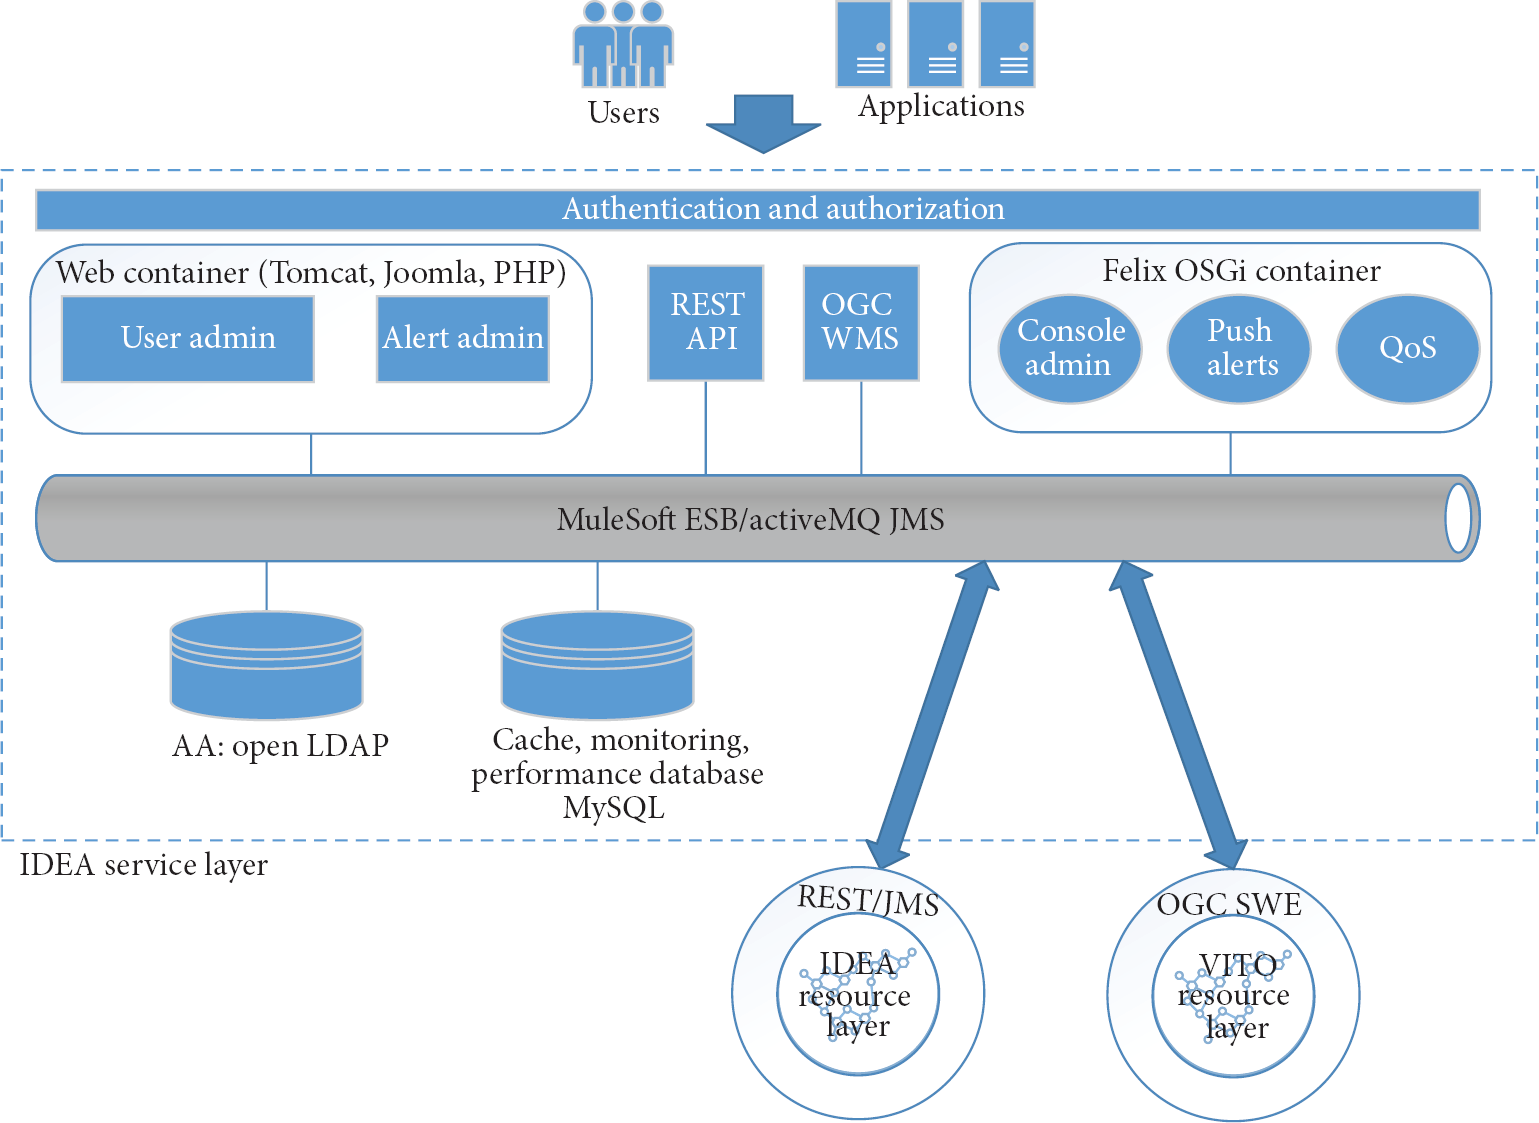
The IDEA Service Layer uses MuleSoft's Community ESB and the Apache ActiveMQ JMS broker to integrate the information provided by the project's resource layers and to offer a unified DaaS interface.
The ISL serves as a DaaS front end for the IRL and for a resource layer hosted by the Vlaamse Instelling voor Technologisch Onderzoek (VITO), a project partner. VITO executed the mobile measurements mentioned in Section 5 and distributed these measurements (geo-tagged black carbon concentrations) as a map layer via a RESTful API compliant with the OGC WMS standard. The ISL views the VITO resource layer (VRL) as yet another environmental data source to offer to its users.
The ISL leverages the power of the ESB/JMS bus by implementing enterprise integration patterns commonly used in business applications. Two integration patterns, message routing and message transformation, are well suited for loosely coupled information systems [32]. To illustrate the use of these patterns, we present two use cases: Data access AAA (Authorization, Authentication, and Auditing) and pollution alerting.
6.1. Data Authentication, Authorization, and Auditing
The ISL acts as a proxy for the RESTful APIs offered by the IRL and VRL. All data hosted by the VRL is public and therefore queries requesting data hosted at the VRL are simply forwarded without further modifications. On the other hand, a subset of the data hosted by the IRL is considered sensitive (e.g., a sensor node installed in a private property). The IRL is unconcerned with data access AAA and expects the ISL to handle these tasks. The ISL uses the message routing integration pattern to route the REST query as follows (Figure 6).
If user authentication and authorization succeed, log the REST query and forward it to the IRL. If user authentication or authorization fail, return the message payload to the request party enveloped in HTTP 401 (Access Forbidden) response.

The ISL acts as a proxy and filter for queries to the IRL RESTful API. First, it authenticates the user and logs the query before forwarding it to the IRL, and then it filters the response according to the previously defined authorization rules.
The IRL API response may contain sensitive nonauthorized data mingled with authorized or public data (commonly seen during sensor discovery queries). These data are therefore filtered out from the response message before forwarding it back to the user (see Figure 7 for the process and Figure 9 for an example).
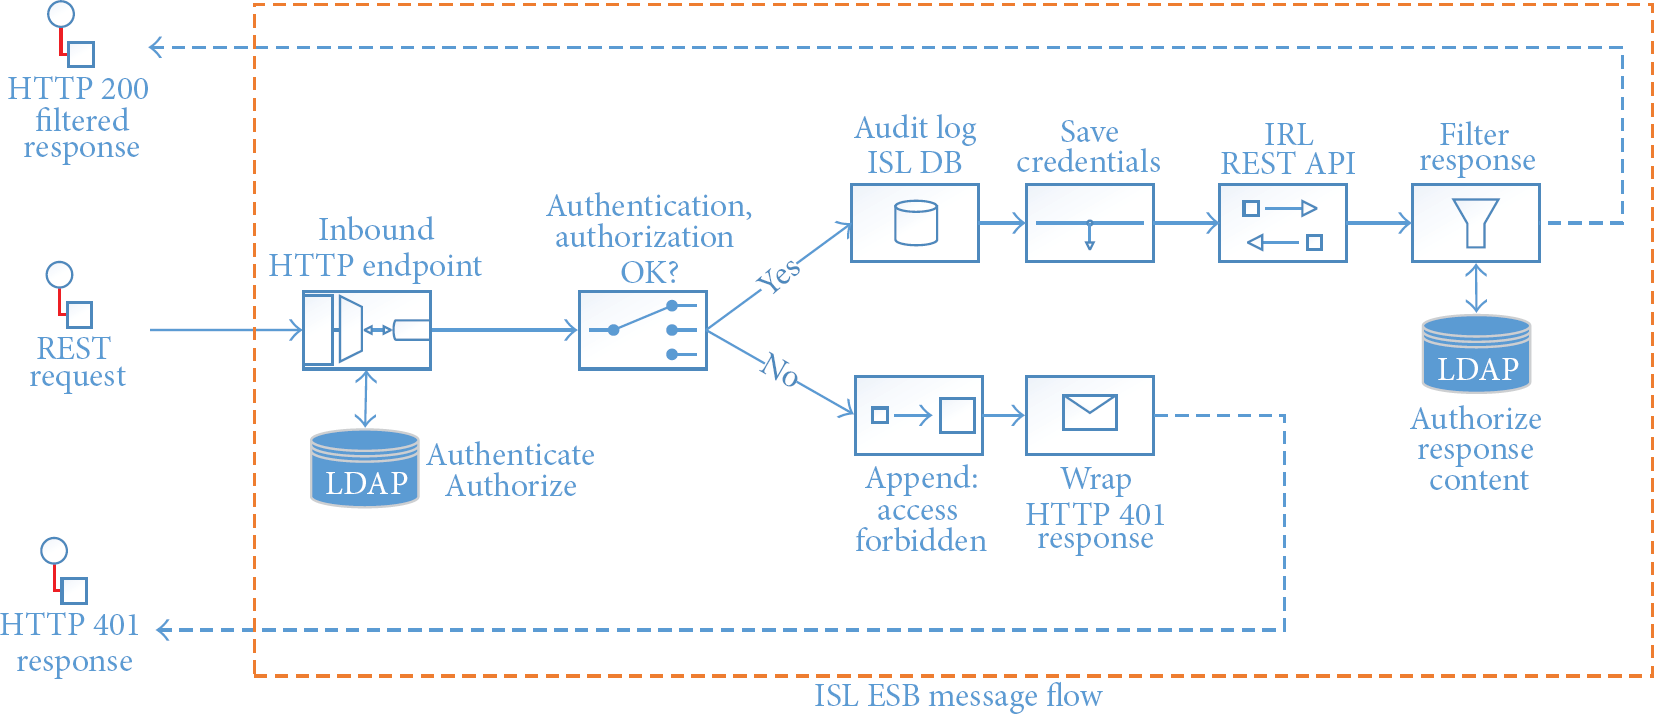
The use case in Figure 6 is shown here as a message flow in the ISL ESB. When a REST request enters the ESB this request is authenticated, audited, authorized, and routed to several message processors before forwarding it to the IRL REST API. The IRL response is then filtered according to authorization rules.
For the moment, we use HTTP Basic Authentication—via SSL—for accessing private environmental data (we are considering using the OAuth standard for future versions of our system). Once authentication succeeds, authorization access is granted to a user per sensor group. A sensor group—internally known as domain features—represents an area where a group of sensors is deployed (for example, a building or neighborhood). The sensor group is specified in a REST query (see Figure 8) and is used by the ISL to authorize access to the query response.
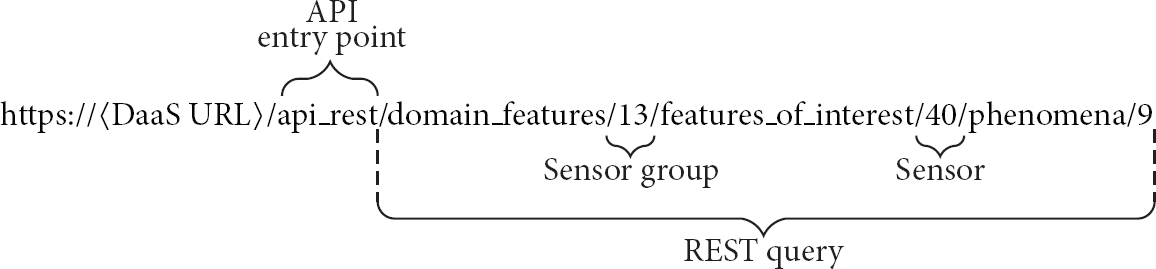
This is an example of an actual REST query to determine the last measured quality value of a noise sensor. The REST query specifies a sensor group and a sensor node. These values are used in the ISL to authorize access before forwarding the query to the IRL.

A query to the public API entry point to list all sensors of sensor group 11 is forwarded to the IRL. The IRL's JSON response contains two sensors. However, one of the sensors is listed as private in the LDAP repository and is filtered out by a JSON parser attached to the ESB in the service layer.
The ISL stores user data and the sensor groups it can access in an OpenLDAP repository. This repository is queried directly by the ESB depending on the query. Table 3 lists the different types of RESTful queries entry points and the actions taken by the ESB to forward the query and authorize access to the query's response data.
List of currently implemented REST queries entry points. All queries are forwarded to the IRL or VRL depending on their entry point.

6.2. Pollution Alerts
The IRL pushes constantly pollution and management events (damaged sensors, high noise pollution levels, etc.) to the ISL using JMS. The IRL is unconcerned with how these events will be ultimately delivered and to whom. These tasks will be handled by the ISL as seen in Figure 10. When the ISL receives an event, it looks up all the registered subscribers for that particular kind or source of event and forwards it via the subscriber's preferred method of delivery. Once an event is routed to a delivery channel, it becomes an alert. Currently, the ISL supports Email and Twitter alert delivery. SMS delivery was initially supported via a commercial SMS gateway service but was discontinued due to the costs involved.

The ISL supports the distribution of pollution alerts using several publication technologies such as email, SMS, or Twitter. The alerts are generated in the IRL as generic events that are pushed to the ISL via JMS. The ISL then forwards the alerts to subscribed users using their specified publication method of preference.
The ISL ESB implements alerts’ delivery using the message routing enterprise integration pattern. The ESB message flow (depicted in Figure 11) forwards an alert first to a subscriber lookup JAVA module that queries a database to determine all registered subscribers and their preferred methods of delivery. For each subscriber, a copy of the alert will be routed to the corresponding transport module.

The use case in Figure 10 is shown here as a message flow in the ISL ESB/JMS broker bus. The JMS message event coming from the IRL is routed via the JMS broker to the ESB where by looking up a subscribers database will forward the message to interested parties using their publication transport of preference (email, SMS, or Twitter).
The advantage of using the message routing integration pattern together with a JMS broker is the relative ease in adding or removing alert delivery transports. If support for a new alerting technology is requested (e.g., sending the alert to a call center) the only change necessary to the entire ISL will be to add a new outbound endpoint module (either as an OSGi bundle or directly into the ESB) and a new routing rule.
7. Results
The IDEA Environmental Measurement Cloud has been online, with varying degrees of available functionality, since the end of 2012. During this time it has been used as a proof of concept low-cost environmental network and as a research tool for noise and air pollution.
The IRL was the first component that became fully functional and has been thoroughly tested by several research use cases. The ISL became fully functional at the end of 2012 and offers at this moment three data services to the public: a group of data access APIs, a map visualization, and pollution alerting. They are still in a developmental stage and therefore have not been widely advertised to the public.
7.1. ISL Services
An AJAX map visualization was the first publicly available service to access the data produced by our environmental measurement network (Figures 13 and 14). This visualization presents map mashups of the two resource layers of the IDEA project. These resource layers are hosted in two different cities (Ghent and Antwerp) and use different data access standards (custom RESTful API and OGC WMS). Their data are integrated in one service, which from the point of view of the map visualization and its users comes from a single source: the ISL (Figure 12). An alerting service, offering alerts via SMS, Email, or Twitter, was added to the system a few months later. Two types of alerts are offered:
management alerts for the project staff reporting inactive nodes, failed sensors, or lossy links, pollution alerts for the public reporting high levels of noise pollution (Figure 15).

The map visualization is a client side application developed in Javascript. It demonstrates how data served from our DaaS cloud can be integrated with a mapping service to create a near real-time geospatial noise pollution visualization.

This close-up view of the map visualization shows real-time noise pollution measurements from our IRL.

This close-up view of the map visualization shows historical black carbon mobile measurements from the resource layer of our project partner VITO.

Users can subscribe via Twitter to geo-tagged noise pollution alerts. Shown here is a stream of alerts from a node in Antwerp.
As the infrastructure of the sensor network grew, the amount of generated alerts started to overwhelm the system. To solve this, state flapping detection algorithms were added to the IRL. The IRL now produces up to 500 events per day (Figure 16).

From 50 to almost 500 alerts per day are typically generated by the alerting service. The number of management alerts (e.g., sensor failures) is usually higher than the number of pollution alerts (e.g., loud noises) due to lossy links or unstable sensor nodes. Periods of partial network outages (high number of management alerts) are typically accompanied by a decreased number of pollution alerts due to the reduced capacity of the geosensor network.
The real-time performance of our system can be estimated by measuring its data freshness. Data freshness is a measure of correspondence (in time) of a data element's value to its real world instance [33]. In the context of environmental monitoring, it is considered as an expression of the shortest duration between the moment when data is measured and the moment when the data is received by a client call. Some user applications would like to get their data as soon as it is recorded, such as noise pollution visualization and noise alerting services. However, depending on the availability of sensors, network traffic, and server capacity, data can travel from its point of generation (the sensor) to a client at different rates.
We tested the freshness of the data provided by the ISL by requesting the latest available measurement of each sensor and comparing the measurement timestamp with the current time at the moment of reception. The results show that 60% of queries have a freshness value of 2 minutes or less (Figure 17). For most environmental applications, where hard real-time is not needed, this performance is acceptable.

Nearly 300 thousand API queries were executed continuously in a 4-week span (from 12.05.2013 to 09.06.2013). On average, about 60% of queries to our API return pollution data 2 minutes old or less, showing that our environmental measurement cloud can provide relatively fresh data to user applications. 40% of queries return relatively stale data 2 minutes old or more due to lossy links in the sensor network.
7.2. IRL
At the end of 2010, a small setup with 10 measurement nodes was rolled out in the city of Ghent. Over the period of 2 years, several types of sensors (e.g., CO and black carbon) and mobile sensor nodes were added but also removed. Due to the choice of a service-oriented component-based architecture, our IRL prototype could evolve over time according to the varying set of requirements, without the need of reimplementing or modifying already deployed software modules. By using the OSGi framework, we could benefit from existing services implementations for configuration management, remote deployment, communication stacks, and web services.
As soon as the IRL was considered reliable enough, the time resolution of each acoustic sensor was increased by a factor of 8 (from 1 Hz to 8 Hz) which was needed to support more complex types of postprocessing such as CASA (source recognition) and multicriteria sensor quality assessment [34]. In response to the increasing amount of data and the added processing complexity, several load balancing approaches were implemented to offer processed and validated data to the ISL with minimal latency. To illustrate the scale of the IRL, we have listed some numbers in Table 4 for our sensor network consisting of 52 measurement nodes based on data over a period of one month.
Volume statistics IRL as of February 2014.
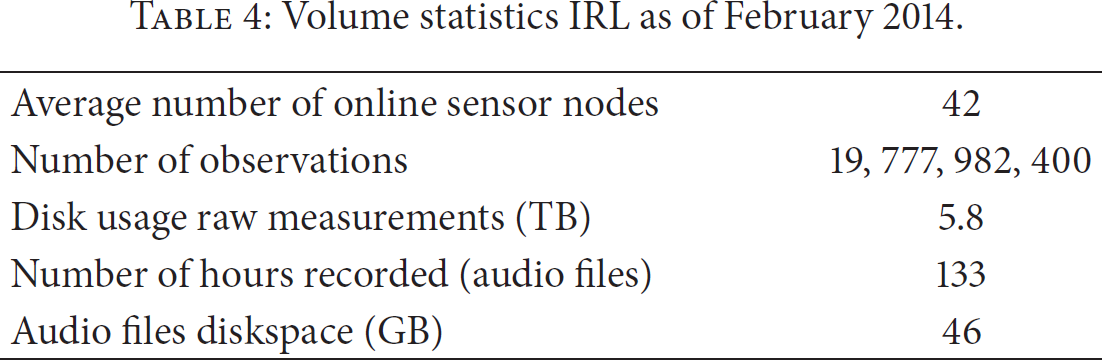
An IDEA sensor node produces noise measurements which require 180 MB of database storage per day (see Table 5). At the moment of writing there are 40 active sensor nodes all equipped with an acoustic sensor generating 11.2 GB of raw measurements on a daily basis.
Data storage requirements IRL.

From the initial deployment in November 2010 till October 2012 (when the sampling rate was increased from 1 Hz to 8 Hz), the IRL generated 359 GB of raw measurements. Due to the increase of sampling rate and the addition of a large amount of sensor nodes, the required storage capacity increased heavily (see Table 5). The numbers given represent a period of 8 months.
8. Related Work
In this section, we take an overview on two main categories, the existing platforms for delivering sensed environmental data and the solutions for integrating sensor networks into a computing cloud that offer services to end users.
8.1. Environmental Monitoring Solutions
Since the request of the European Union for more detailed noise data and measurements [35], a significant number of systems have been developed concerning noise pollution monitoring. Table 6 presents a comparison of several systems similar to our environmental cloud.
The existing solutions for environmental monitoring.

The aforementioned systems provide solutions for noise monitoring in two fundamentally different ways: fixed or mobile. Mobile nodes noise pollution sensing can be extremely low cost and provide higher spatiotemporal resolutions; however, concerns still exist in the reliability of mobile phones, the quality of measurements, and privacy issues [36, 37]. Fixed nodes noise pollution monitoring can become prohibitively expensive when using high-end certified noise sensors, especially if high spatial resolution is desired.
8.2. Integrating Sensor Networks to the Computing Cloud
Several cloud frameworks that offer environmental data as a service exist. Nevertheless, only a few provide details of their internal architecture. Table 7 presents a comparison of the existing cloud computing platforms with respect to the architectural features discussed in this paper.
Existing cloud computing platforms.

The system described in Dash et al. [2] is the most similar to our proposed architecture as it describes a complete sensor cloud architecture from the sensors up to the services. However, it presents only an analysis of the architecture and no implementation to compare our system with. LogMeIn [13], Etherios [16], and Wei et al. [38] are commercial offerings catered to businesses or Internet of Things (IoT) applications and not to environmental research.
9. Conclusions
We proposed a general architecture for the implementation of an effective environmental DaaS. This architecture was divided into two distinct components: a service layer (the sensor web) and a resource layer (the sensor network). The service layer was envisioned as a front end for data access and discovery services while aggregating the collected data of all the resource layers it encapsulated. It used an ESB coupled with a JMS broker to loosely couple web services and resource layers.
This architectural design was used in the IDEA project where a noise measurement resource layer and an air pollution resource layer were deployed in several cities in Belgium and, for a limited time, also in The Netherlands. These sensor networks generate a vast amount of environmental data which via two public APIs, a near real-time map visualization and pollution alerting channels offer environmental reality awareness to the public.
The IDEA Environmental Measurement Cloud hosts at this moment approximately 6.5 TB of environmental data and continues to publicly serve near real-time noise pollution data with a freshness of around 2 minutes. It has successfully served its two main purposes to offer geographical environmental data to the public and to serve as a testbed for scientific research on noise and air pollution in urban environments. This would not have been possible using the currently available cloud services (Xively, ThingSpeak, and Etherios) due to their limited data rates and high costs.
10. Future Work
Currently, the IDEA Environmental Measurement Cloud is a proof-of-concept system that illustrates how environmental data could be aggregated and served using a DaaS delivery model. It does not have yet the full-fledged scalability and availability commonly expected from commercial cloud services. Reaching these levels, by investing in hardware infrastructure or renting elastic IaaS resources, is planned for future versions of our system.
One of the goals of the IDEA project was to raise environmental awareness by engaging the public in environmental monitoring. We offer the public the opportunity to participate in environmental sensing via customized sensor node boxes (Figure 3(c)). These boxes are designed as plug and play devices that automatically stream noise measurements to the IRL when connected to the Internet (see [26] for more details on public participation). However, our platform does not offer yet an API to connect third-party sensor devices.
A DaaS Environmental Measurement Cloud serves the need to provide open access to environmental data. On the other hand, a Platform-as-a-Service (PaaS) Environmental Measurement Cloud allows its users to access the platform infrastructure underneath the data access services. An example of such cloud is Xively, where users can add their own sensors to the cloud and push their data to it.
We envision a PaaS Environmental Measurement Cloud where the scientific community and the public can contribute with their own environmental data via two options: (1) by using IDEA's own sensor boxes or (2) by third-party sensor nodes that implement any API supported by our future PaaS, for example, OGC SOS, OData. Participants could then harness the data distribution and alerting services provided by our platform and in turn increase the geographical coverage of our services. Additionally, the PaaS could offer the data processing intelligence currently being developed for the IRL. Services such as CASA, where patterns in environmental noise are used to identify pollution sources [11], could be offered to third-party environmental data sources.
A PaaS Environmental Measurement Cloud is the next logical step in the evolution of our system where through public participation and intelligence processing a new level of environmental awareness will be available to the public and the research community.
Footnotes
Conflict of Interests
The authors declare that there is no conflict of interests regarding the publication of this paper.
Acknowledgments
This research is part of the IDEA (Intelligent, Distributed Environmental Assessment) project, a 4-year strategic basic research project, financially supported by the IWT-Vlaanderen (Flemish Agency for Innovation by Science and Technology). Part of the research for including small autonomous sound sensors has been done under the funding of Innoviris (The Brussels Institute for Research and Innovation) as Prospective Research for Brussels project under the title ISEM.