
Abstract
This study developed a fault diagnosis meter based on a ZigBee wireless sensor network (WSN) for photovoltaic power generation systems. First, the Solar Pro software was used to simulate the 9-series, 2-parallel photovoltaic module array formed with the Sharp NT-R5E3E photovoltaic module as well as record the power generation data of the photovoltaic module array at different levels of solar radiation, module temperature, and fault conditions. The derived data were used to establish the weights of the extension neural network (ENN). The fault diagnosis in the photovoltaic power generation system required extracting the system's power generation data and real-time solar radiation and module temperatures; this study thus developed an acquisition circuit for measuring these characteristic values. This study implemented extension neural network theory using a PIC single chip microcontroller and incorporated the ZigBee wireless sensor network module to construct a portable fault diagnosis meter to assess the photovoltaic power generation system. The experimental results showed that the proposed portable fault diagnosis meter based on the extension neural network for the photovoltaic power generation system possessed a high level of accuracy in fault identification.
1. Introduction
The photovoltaic power generation system is a minimally polluting renewable energy source. To improve power-generation efficiency, the system must be installed in a spacious and unshaded area. However, the system's output power may decrease with prolonged operation. Furthermore, as the system is outdoors for long time periods, natural disasters could also cause malfunction in the module. A malfunction in any module of the photovoltaic power generation system reduces output power drastically. Therefore, developing fault diagnosis technology for PV power generation systems can not only increase testing and repair efficiency and improve system power generation reliability but also reduce operating costs. As for current fault diagnosis systems of PV power generation systems, relevant PVSAT projects are proceeding in Germany, Netherlands, and Switzerland [1, 2]. These projects establish a self-fault detection system for grid-connected PV power generation systems for the use in detecting system errors and analyzing causes of errors. However, the development of this system involves the use of meteorological satellites to transmit atmospheric data for cross-checking with data measurements from ground-based meteorological stations in order to provide atmospheric parameters for simulation analysis to raise the overall recognition rate. Using this system for fault detection in stand-alone PV power generation systems is prohibited by the high cost, restricting the range of applications for this diagnosis system and reducing its practicality. In addition, experts have also suggested the use of high frequency reaction measurement [3] and time domain reflectometry (TDR) [4] in fault diagnosis of PV power generation systems. These diagnosis methods involve the use of identified and reflected feedback signals to determine the occurrence of faults and the areas in which faults occur. However, this diagnosis technology requires the use of network analyzers and other additional measurement equipment. The technologies applied in both methods require detailed calculations of the internal wire and cable lengths of PV modules. Consequently, maintenance engineers must possess sufficient PV power generator-related expert knowledge. Furthermore, if this fault diagnosis technology is applied to large-scale PV power generation systems, cable lengths must be calculated accurately or misjudgment of module fault regions will easily occur. Therefore, the application of this diagnosis technology does not facilitate the convenience of system repair. While the author recently proposed an intelligent PV power generation system fault diagnosis method [5] which achieved a fairly good fault type identification rate, the method remains in the simulation stage and is limited to the types of faults it can identify.
A photovoltaic module malfunction is difficult to detect with naked eyes, and, therefore, each module requires manual testing, taking long hours. Additionally, system operations must be terminated while conducting manual testing to ensure the safety of maintenance personnel. Since the photovoltaic module is expensive, the longer the operations are halted, the more extensive the losses become. Furthermore, photovoltaic power generation systems are installed in less accessible regions, thus compounding the difficulty of manual repairs. The development of a fault diagnosis meter in a photovoltaic power generation system, operated via a wireless sensor network transmission, is therefore a key issue for discussion.
To promote the fault diagnosis accuracy rate, an intelligent fault diagnosis method based on extension theory with neural networks was proposed in this paper. The related works of the proposed extension neural network have been applied in [6–10]. The proposed method has the advantages of less learning time, higher accuracy, and less memory consumption. In addition, a PIC microcontroller and a ZigBee wireless sensor network are combined to reduce the hardware circuit size and conduct remote fault diagnosis.
2. Capture of PV Power Generation System Fault Data
In this paper, a 3.15 kW PV power generation system consisting of NT-R5E3E PV modules connected into
Figure 1(a) shows the I-V and P-V curves provided in the datasheet for Sharp PV module NT-R5E3E for irradiation from 200 W/m2 to 1,000 W/m2 and surface temperature of 25°C [12]; Figure 1(b) shows the I-V and P-V curves as simulated by Solar Pro PV system analysis software for Sharp solar power module NT-R5E3E under irradiation from 200 W/m2 to 1,000 W/m2 and surface temperature of 25°C. Comparison of Figures 1(a) and 1(b) demonstrates that the results simulated by Solar Pro are completely consistent with the figures of the datasheet. It is confirmed that the characteristic curves simulated by Solar Pro are consistent with the actual working characteristic curves and power generation data.

Characteristic curves for surface temperature of 25°C and irradiation from 200 W/m2 to 1000 W/m2 (a) provided in Sharp NT-R5E3E datasheet and (b) simulated by Solar Pro software.
Figure 2 shows the simulated I-V and P-V curves when two modules in a 3.15 kW PV module array are completely shadowed under irradiation of 900 W/m2 and surface temperature of 51.6°C. It can be seen from Figure 2 that when a PV module is shadowed, the I-V curve is no longer a smooth curve and that multiple peaks are produced in the P-V curve. Figure 3 shows the actual measured results under irradiation of 945 W/m2 and surface module temperature of 51.6°C when two modules in a series array of PV modules are shadowed. It can be seen from Figure 2 that the I-V curve changes and multiple peaks are produced in the P-V curve. It is evident from Figures 2 and 3 that simulation results are fairly consistent with actual testing results, demonstrating that I-V and P-V curves experience changes when any module in a PV power generation system is shadowed or faulted; the voltage, current, and power of the maximum power point also change. Consequently, voltage of maximum power point

I-V and P-V curves obtained in simulation under 900 W/m2 irradiation and surface temperature of 51.6°C where two modules in a PV module array are shadowed.
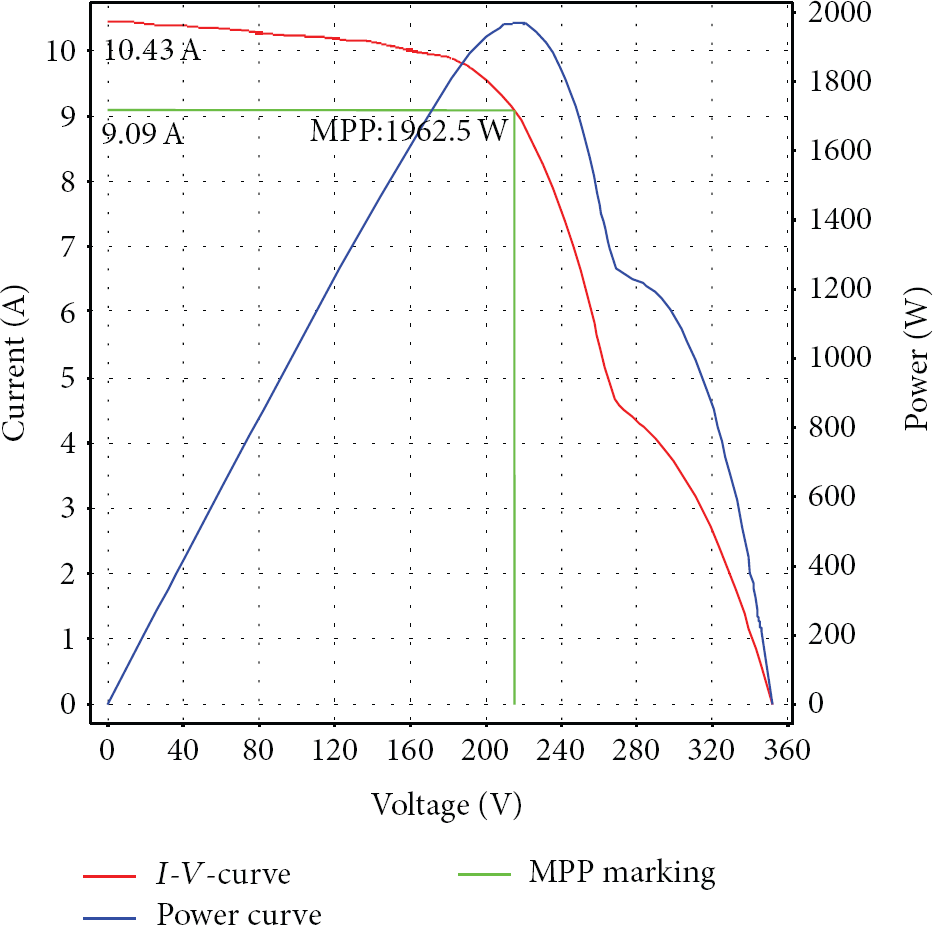
Actual I-V and P-V curves obtained under 945 W/m2 irradiation and surface temperature of 51.6°C where two modules in a PV module array are shadowed.
3. Fault Diagnosis Configuration of a Photovoltaic Power Generation System
3.1. Division of Operation Regions
As irradiation and temperature change over time, the module temperature and irradiation ranges that potentially appear through a day are categorized into 21 categories. Between 300 W/m2 and 1,000 W/m2, every 100 W/m2 is designated as one interval. Each interval is then divided into three subintervals every 10°C between 31°C and 60°C. Categories are shown in Table 1.
21 regions divided by temperature and irradiation intervals.

The fault diagnosis method for PV power generation systems discussed in this paper first requires obtaining the current irradiation and module temperature of the PV module array and then using that information together with the characteristics captured for PV power generation system fault diagnosis, including the maximum output power
3.2. Fault Types of PV Power Generation Systems
Under identical irradiation and module temperature conditions, this paper divides fault categories of PV power generation systems into 10 different types, as shown in Table 2. In addition, the upper and lower limits of the classical domain between irradiation of 301 W/m2 and 1,000 W/m2 and module temperature between 31°C and 40°C for 21 regions under 10 different types can be obtained from simulation results.
Fault types of PV power generation systems.

3.3. PIC Single Chip Microcontroller
The single chip microcontroller used in this study was the PIC18F8720 microcontroller manufactured by Microchip [13]. This study used a universal asynchronous receiver/transmitter (USART) in the PIC18F8720 single chip microcontroller to transmit data and control operation of a ZigBee module. The ZigBee wireless sensor network module uses a RS-232 communication protocol to transmit data, to contribute to the communication between PIC and ZigBee module. A RS-232 transmission program was coded in the PIC to facilitate communication with the ZigBee module, to control the ZigBee module's operations, and to transmit the photovoltaic power generation system data from the ZigBee wireless sensor network router to the PIC microcontroller for processing.
3.4. ZigBee Wireless Sensor Network
ZigBee is a wireless network protocol based on IEEE 802.15.4 and formulated by the ZigBee Alliance [14, 15]. This wireless sensor network technology is short in distance, simple in structure, low in power consumption, and slow in transmission speed [16–19]. This study used a durable FT-6260 ZigBee Mesh rapid development kit [20] with a transmission distance three to five times greater than the regular ZigBee module. Since each ZigBee module is equipped with a RS-232 transmission port, users can connect the ZigBee module to a computer, facilitating the setting of ZigBee module parameters. Additionally, each ZigBee development module is equipped with four digital input/output (DIO) ports and four analog to digital converters (ADCs). On the DIO side, the ZigBee coordinator terminal can control the DIO pins at any router end or end-device end on the same network and can also change the voltage level at DIO pins from high voltage to low voltage, or vice versa. On the ADC side, the selected ADC resolution was 12 bits, which allowed for conversion of the 0~2.4 V voltage range into 000~4095(000~FFF) digital data.
3.5. The Sensor Circuit of Characteristic Extraction
The characteristics used to diagnose faults in the photovoltaic power generation system are the maximum output power

Acquisition circuit of maximum power, maximum power voltage, maximum power current, and open circuit voltage.
4. Fault Diagnosis in a Photovoltaic Power Generation System
4.1. The Overall Scheme of the Proposed Portable Fault Diagnosis Meter
Figure 5 displays the overall scheme of the proposed portable fault diagnosis meter in the photovoltaic power generation system. The ZigBee module in the fault diagnosis meter controls the conduction of the SSR on the characteristic value acquisition circuit to extract the voltage of maximum power point, current of maximum power point, open circuit voltage, solar radiation, and module temperatures of the photovoltaic module array. The ZigBee wireless Internet transmits the voltage, current, solar radiation, and module temperature values to the fault diagnosis meter, and the diagnosis results and extracted statistics are shown on the LCD.

Overall hardware construct of the fault diagnosis meter of portable photovoltaic power generation system.
4.2. The Proposed Extension Neural Network Fault Diagnosis Method
Most of the previously presented results in intelligent neural network design used traditional learning methods for tuning the network parameters [21–25]. However, in this paper, an intelligent method with more efficient learning process was proposed. The characteristics used to diagnose faults in the photovoltaic power generation system are the maximum output power
The matter-element model and extension distance are the main principles of the proposed extension neural network, which can indicate the alterable relations between quality and quantity by matter-element transformation. The proposed fault detection method will first create a set of fault matter-element model of a photovoltaic module array by extension neural network learning process. And, a regular extension distance will then identify the fault type of a photovoltaic module array by calculating the distance between test data and each matter-element model. According to these results, the proposed fault detection method can detect the fault type of a photovoltaic module array correctly and promptly. The related works of the proposed extension neural network have been successfully applied in [6–10].
Figure 6 presents a structural diagram of the proposed extension neural network. The data are classified and entered into the neural cells of input layers. The number of input layer neural cells is decided by the number of the characteristics of the matter-elements to be identified. Conversely, the output layers are used to store calculated extension distances, and the lines connecting the two layers display the weight, which comprises the upper weight, the center weight, and the lower weight. Finally, the minimum extension distance is identified via the various extension distances stored in the output layers for classification [6–10].
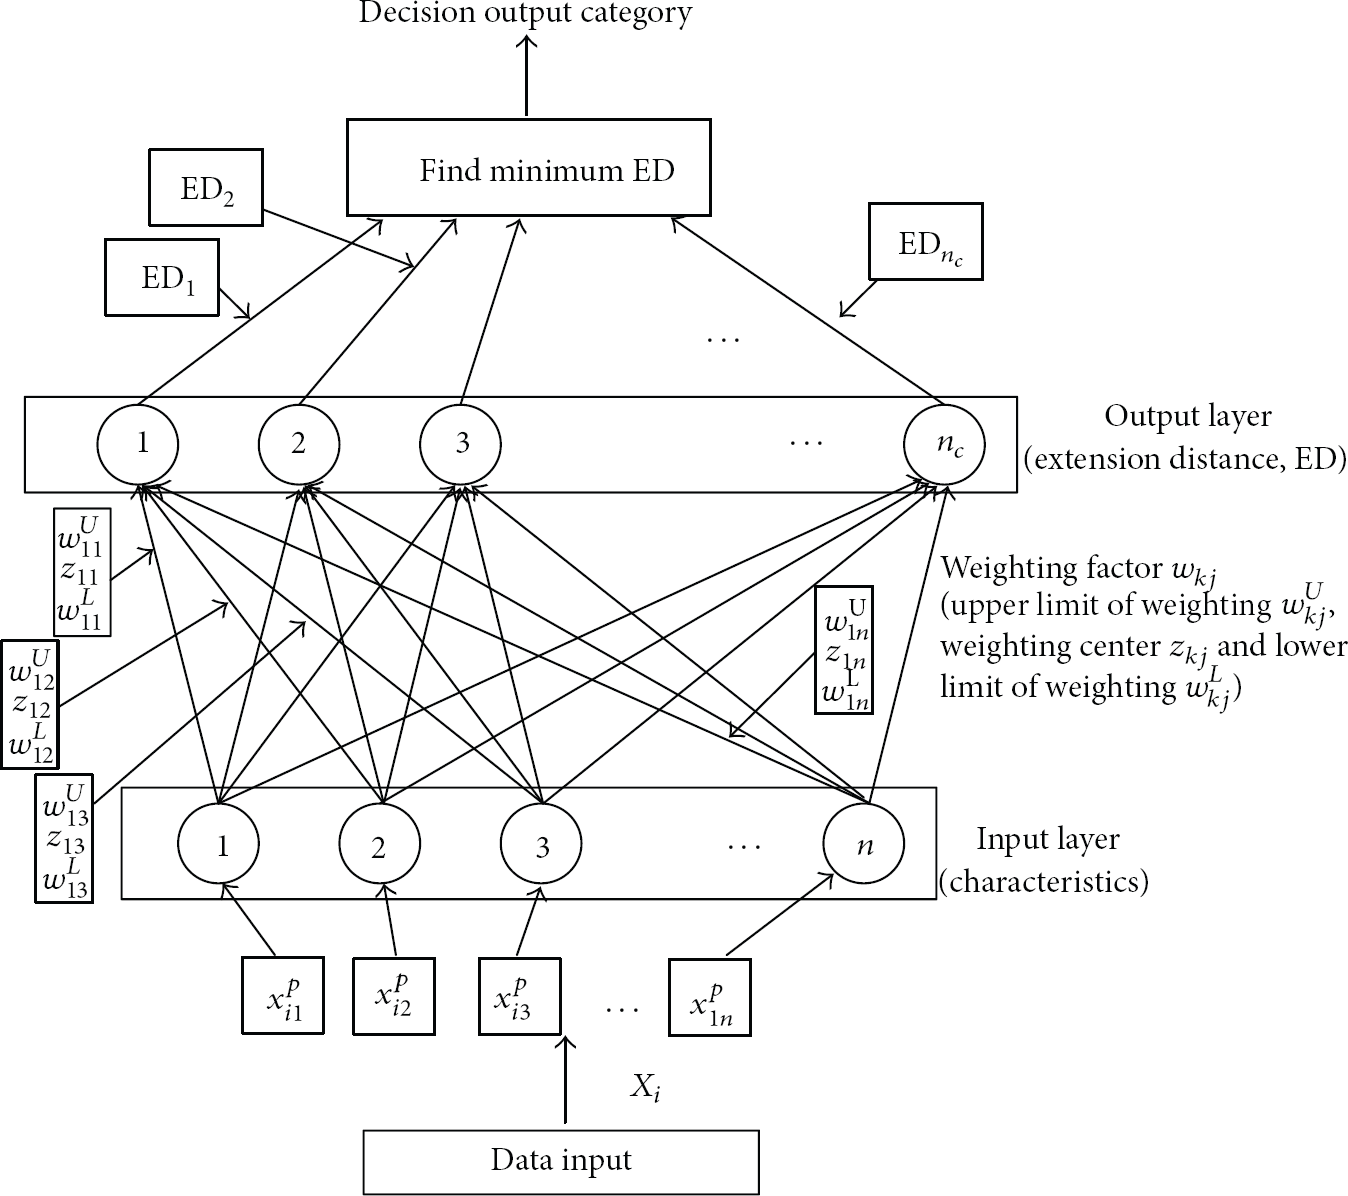
Structure of the proposed extension neural network.
4.3. Learning Process of Extension Neural Network
Before conducting the learning processes, the samples were defined as 
The supervised learning algorithm processes of the extension neural network are detailed as follows.
Step 1.
Input the learning data to establish matter-element models that correspond to the different classifications and establish weights between the input and output layers. The kth matter-element is presented as follows:


Step 2.
Calculate the center weight of each classification characteristic. Consider

Step 3.
Extract the ith learning sample of the kth classification as shown in

Step 4.
Use (6) to calculate the extension distance between the learning sample 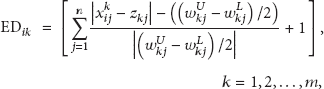
Step 5.
Find the minimum extension distance between all the classifications in the output layer. If
Step 6 (adjust the weights).
(1) Modify the upper and lower weights.
Modify the weight of the classification k to obtain
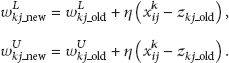
Modify the weight of the classification 
(2) Modify the center weight

Step 7.
The learning processes are terminated upon completed classification of all the learning samples. Otherwise, repeat Steps 3 to 6.
Step 8.
When the total error ratio
Figure 7 shows the adjustment process of the weighting factors, as described in Step 6. The learning sample

Adjustment process of cluster weighting: (a) before learning and (b) after learning.
4.4. The Recognition Algorithm Processes of the ENN
Upon completion of the extension neural network, the learning processes, recognition, diagnosis, and classification can be implemented. The procedures are as follows [6–10].
Step 1.
Extract the weight matrix of the trained extension neural network.
Step 2.
Extract the samples awaiting recognition.
Step 3.
Use (6) to calculate the extension distance between the samples awaiting identification and each classification.
Step 4.
Find the minimum extension distance to identify the classification of each data awaiting identification.
Step 5.
Check that all samples awaiting identification are tested before the algorithm is terminated. Otherwise, repeat Step 2 to process the next sample awaiting identification.
The characteristics used to diagnose faults in the photovoltaic power generation system are the maximum output power
5. Experimental Results
Figure 8(a) demonstrates the hardware photo of the combined characteristic value acquisition circuit and ZigBee wireless internet module. In addition to requiring a fault diagnosis program on the PIC single chip microcontroller of the photovoltaic power generation system, a transmitted control signal is also essential for controlling the ZigBee module. ZigBee uses the 12 V input and output voltage RS-232 communication protocol. Without an input and output voltage lower than 12 V, the PIC single chip microcontroller requires a Max232IC on the fault diagnosis meter to communicate with the ZigBee module and control its operations. The generator data transmitted by the ZigBee module to the photovoltaic power generation system is inputted into the PIC microcontroller chip for concurrent processing. Figure 8(b) shows the hardware photo of the combined ZigBee coordinator and PIC microcontroller circuits in the photovoltaic power generation system.

Hardware photos of the PV fault diagnosis meter: (a) the characteristic value acquisition circuit and ZigBee wireless internet module combination and (b) the combined ZigBee coordinator and PIC microcontroller circuits.
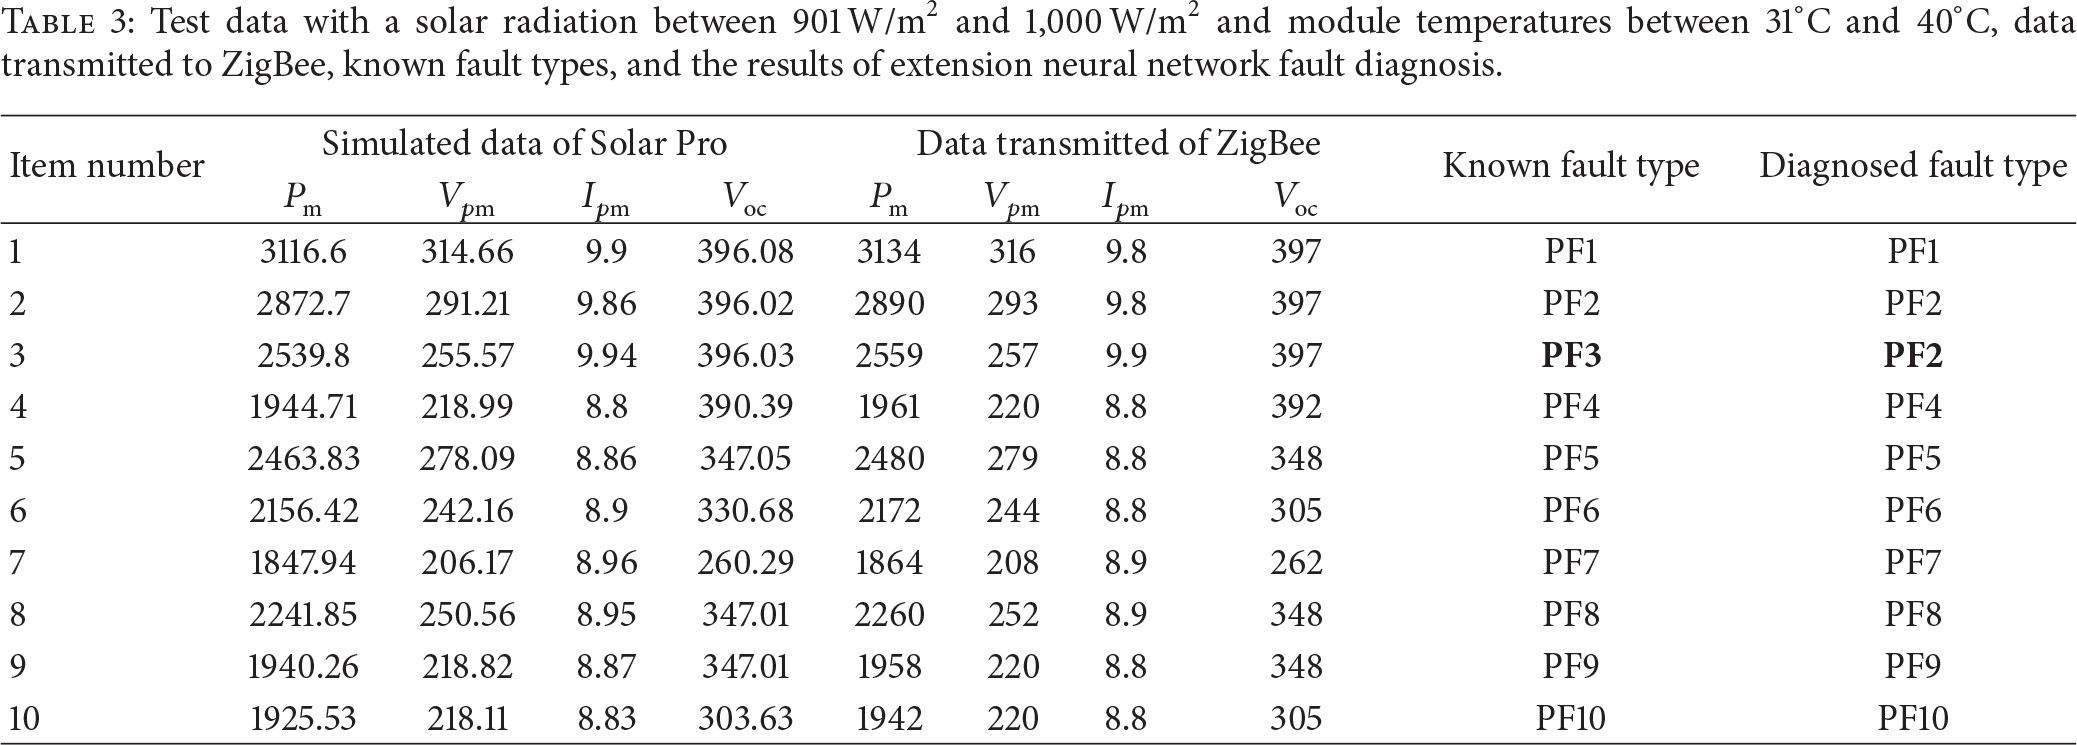
To determine the proposed extension neural network's feasibility for photovoltaic power generation system fault diagnosis, this study employed test data with a solar radiation between 901 W/m2 and 1,000 W/m2 and module temperatures between 31°C and 40°C. Table 3 displays the simulated data from Solar Pro [11] and their transmitted data from the ZigBee module ADC, making the transmitted statistics the data for actual test. The table demonstrates that the proposed extension neural network accurately diagnosed the photovoltaic power generation system faults. Despite discrepancies between the data generated via the Solar Pro software and the transmitted data from the ZigBee module ADC, Table 3 indicates only one datum (item number 3) was incorrectly assessed, thereby proving a high-identification rate.
Test data with a solar radiation between 901 W/m2 and 1,000 W/m2 and module temperatures between 31°C and 40°C; data transmitted to ZigBee; known fault types; and the results of extension neural network fault diagnosis.
Upon conducting a local feasibility analysis of the extension neural network for fault diagnosis in a photovoltaic power generation system, the method's accuracy under different solar radiation and module temperature conditions must be measured. Table 4 shows the fault diagnosis results of randomly chosen test data and indicates that the diagnosis accuracy remained high under various solar radiation and module temperature conditions. The proposed use of the extension neural network for fault diagnosis in a photovoltaic power generation system involves minimal training and simple learning processes and is, therefore, suitable for fault diagnosis in a photovoltaic power generation system.
Fault diagnosis accuracy rates of the extension neural network in photovoltaic power generation system in different regions.
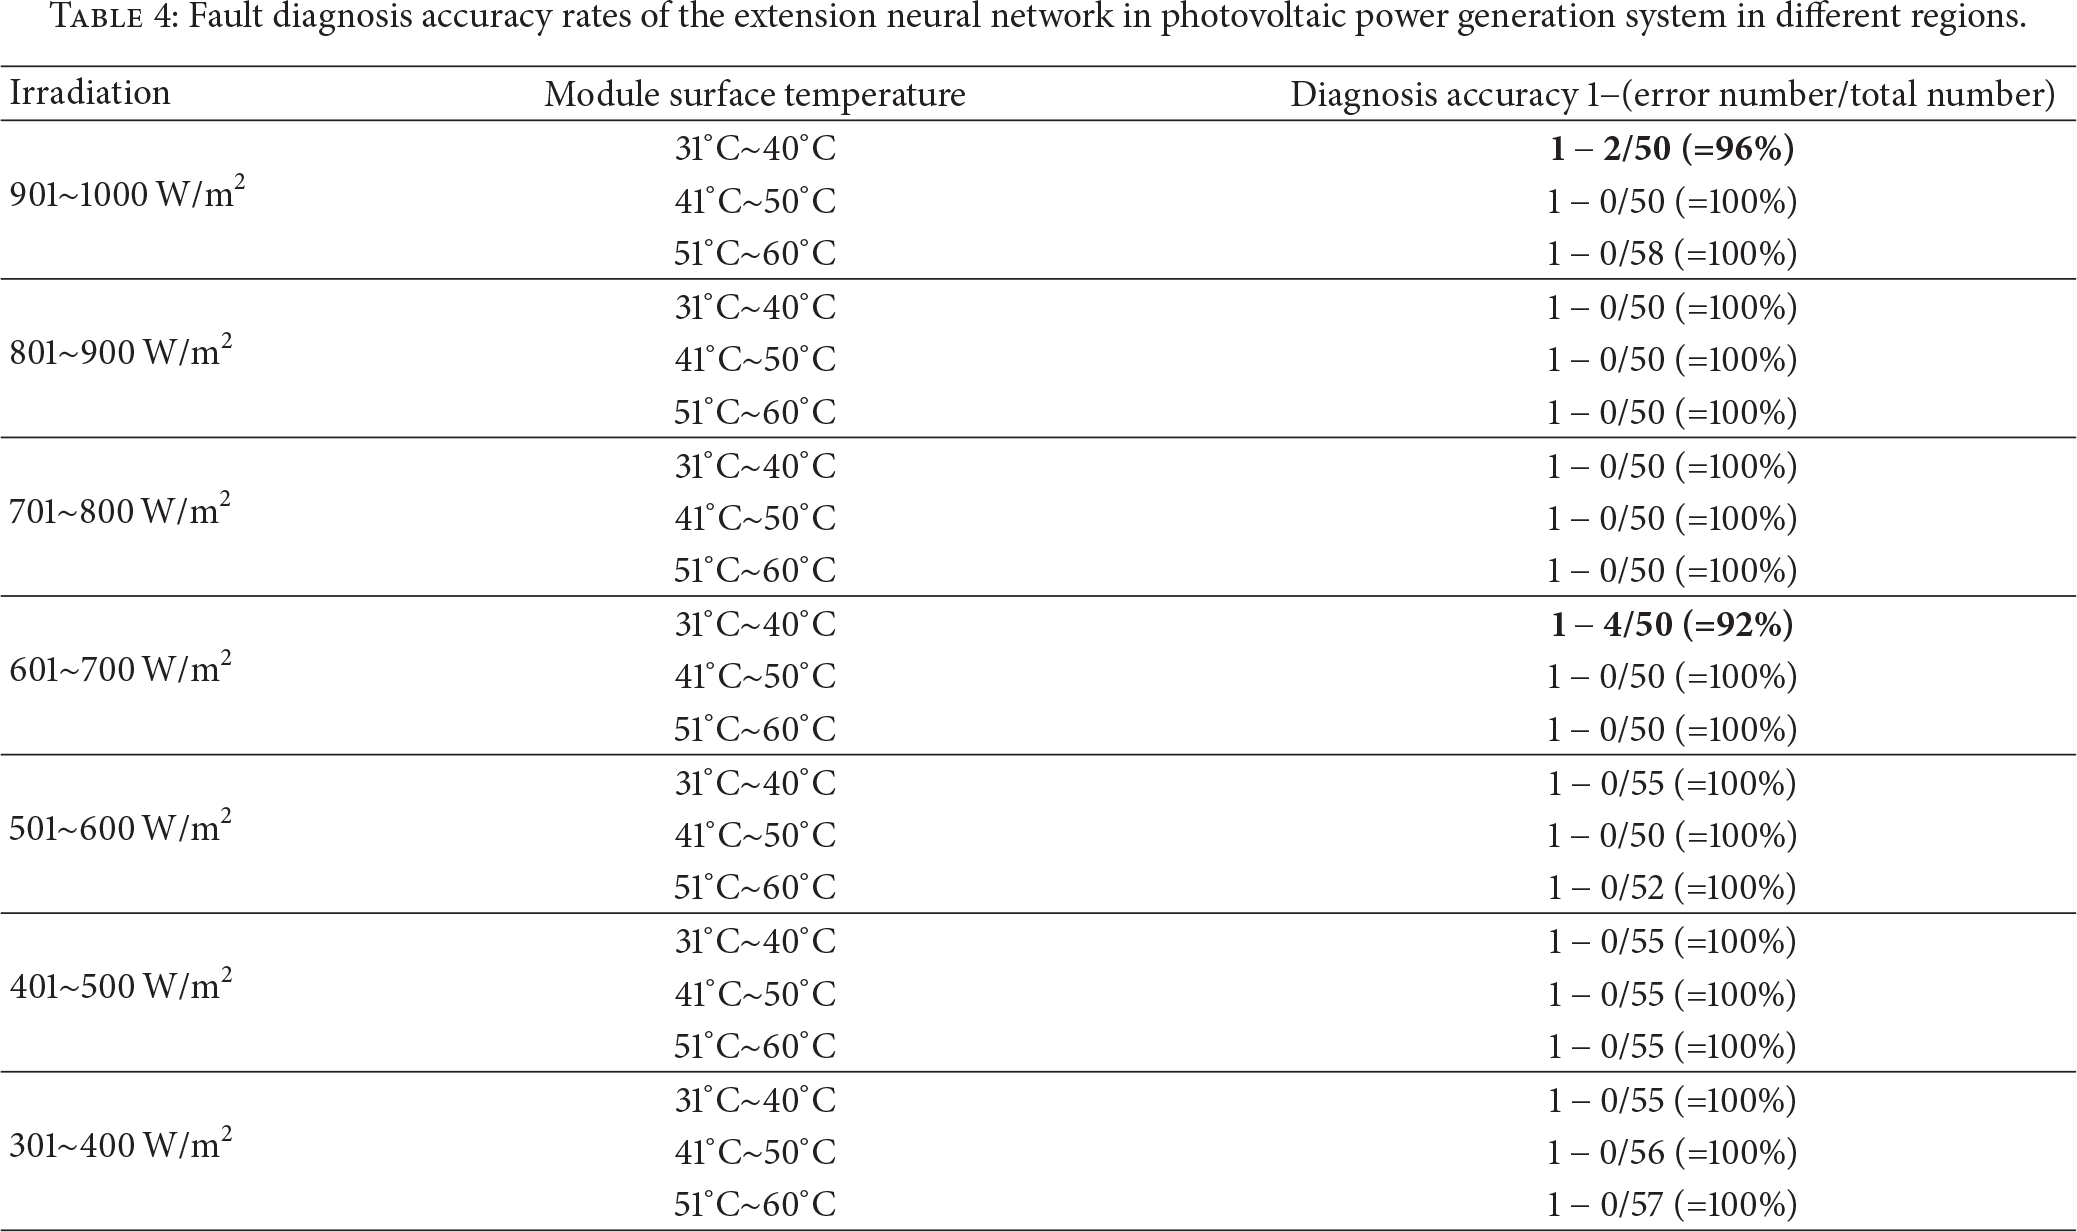
The fault classification characteristic values of test data with a solar radiation value between 901 W/m2 and 1,000 W/m2 and module temperatures between 31°C and 40°C and those with a solar radiation value between 601 W/m2 and 700 W/m2 and module temperatures between 31°C and 40°C are too similar. This resulted in diagnosis errors and reduced accuracy rates to only 96% and 92%, lower than those in other regions. However, only these two regions observed lower accuracy rates; the rates in other regions were 100%.
To display the superiority of the proposed extension neural network, fuzzy neural network [25] and multilayer perceptrons and back propagations (MLP) [21] with three network structures, namely, 4-7-10, 4-8-10, and 4-9-10 (input layer-hidden layer-output layer), were constructed to diagnose photovoltaic module array faults and to compare diagnosis results of the extension neural network, as seen in Table 5. The fault diagnosis of photovoltaic module arrays divided solar radiation and module temperatures into 21 regions, conducting a diagnostic simulation of each region. The fault diagnosis displayed in Table 5 demonstrates a higher identification performance by the proposed extension neural network compared with that of multilayer perceptrons and back propagation diagnosis and only requires 22 iterations, indicating that each region only requires approximately 1 iteration to reach a 100% identification rate. Conversely, fuzzy neural network and multilayer perceptrons and back propagations require at least 5,584 and 8,507 iterations, respectively, indicating that each region requires an average of 250 and 400 iterations to reach a neural network convergence. The comparison results indicate that an extension neural network conducting fault diagnosis is highly accurate and requires minimal iterations and is, therefore, more efficient than traditional multilayer perceptrons and back propagation diagnosis.
Comparison of fault diagnosis accuracy rates between test data with a solar radiation between 301 W/m2 and 1,000 W/m2 and module temperatures between 31°C and 40°C, when applied in extension neural networks and traditional neural networks.

Table 5 shows that the proposed method suits better the practical situation due to the effects of photovoltaic module aging being considered. The proposed extension neural network only needs the basic computing rules such as addition, subtraction, multiplication, and division. Compared with the neural network method presented in [21] and fuzzy neural network proposed in [25], the learning and diagnosis response of the proposed extension neural network is also faster under the same conditions. It is because more complex computing instruction such as exponential function is needed using the traditional neural network and fuzzy neural network methods. However, the proposed extension neural network diagnosis method does not need complex learning procedure, such that it can easily be implemented on a single chip microcontroller. However, when the capacity of photovoltaic modules increases or reduces, a fractional amount of the classical region data should be modified to promote the diagnosis accuracy. Because the diagnosis scheme is simple, a PIC microcontroller can be utilized to implement the hardware for real-time fault diagnosis of a photovoltaic module array. There are a lot of analog and digital modules in the PIC microcontroller, so it makes the hardware circuit size very small.
The characteristics used to diagnose faults in the photovoltaic power generation system are the maximum output power
6. Conclusions
This study conducted fault diagnosis on photovoltaic power generation systems. First, Solar Pro software was used to develop a 3.15 kW photovoltaic power generation system simulating regular operation and operation under various fault classifications. The characteristic values of the photovoltaic power generation system under both conditions were recorded. Half the simulation results were used as training data to test the weight of the extension neural network, and the PIC single chip microcontroller was used to develop the photovoltaic power generation system's fault diagnosis meter based on an extension neural network. The results indicate a high extension neural network recognition rate, and that minimal learning data is required to complete weight training. Additionally, the combination of a PIC single chip microcontroller and a ZigBee wireless sensor network transmitter greatly reduced the risks involved in manual repairs and reduced the time required for system diagnosis. Furthermore, a ZigBee wireless sensor network transmission can conduct a remote fault diagnosis. Finally, the proposed fault diagnosis meter for photovoltaic power generation systems and the fault characteristic value acquisition circuit are both small in size and light in weight and are therefore portable.
Footnotes
Conflict of Interests
The authors of the paper declare that there is no conflict of interests with any of the commercial identities mentioned in the paper.
Acknowledgment
This work was supported by National Science Council, Taiwan, under Grants NSC 102-2221-E-167-009 and NSC 101-ET-E-167-001-ET.