
Abstract
In various sensor networks, the performances of sensors vary significantly over time, due to the changes of surrounding environment, device hardware, and so forth. Hence, monitoring the status is essential in sensor network maintenance. Spectral clustering has been employed as an enabling technique to solve this problem. However, the traditional spectral clustering is developed for undirected graph, and the naive generalization for directed graph by symmetrization of the adjacency matrix will lead to loss of network information, and thus cannot efficiently detect bad sensor nodes while applying it for sensor validation. In this paper, we develop a generalized digraph spectral clustering method. Instead of simply symmetrizing the adjacency matrix, our method takes into consideration the network circulation while clustering the sensors. The extensive simulation results demonstrate that our method outperforms the traditional spectral clustering method by increasing the bad detection ratio from 19% to 41%.
1. Introduction
Sensor networks as an enabling technique have been deployed in many scenarios that human beings find it hard to reach, for example, in the wild area, ocean, battle fields, and so forth. These sensor networks serve an important purpose to collect information to help people understand and monitor the unreachable regions. Due to various unpredictable reasons, for example, mechanical problems, malfunctioning, damage, turning to a function-reducing mode due to low battery power, and being compromised, the sensor performances may degrade over time. Thus a periodical validation of sensor status is needed. However, in many cases, it is not possible to reach the sensor network to find the problematic senor nodes. Hence, a self-validation method becomes more practical in reality, where sensor nodes validate their goodness by monitoring the signals received from their neighbors.
In the literature, the spectral clustering method is introduced as a key technique to identify those “bad sensor nodes” [1, 2]. However, because the traditional spectral clustering algorithm only works on symmetric matrices, [1] symmetrizes the asymmetric connectivity matrix among the sensor nodes, and applies the traditional spectral clustering algorithm, this symmetrization leads to a loss of significant information directed connections between sensor nodes, which makes the bad node detection highly inaccurate.
An n by n square adjacency matrix A represents a finite graph
For undirected graph, associated with symmetric adjacency matrix A, the random walk theory has been extensively studied in the literature, such as the reversible Markov chain theory. Chung and Yau [3] define a normalized Laplacian matrix with the out-degree matrix of the undirected graph and provide several ways to derive the discrete Green's function. The effective resistance defined in [4–6] is exactly the commute time of random walk on directed graph and can be computed by the pseudoinverse of the graph Laplacian.
In contrast, for directed graph, where many key properties listed above cannot hold any more, due to the asymmetry of the adjacency matrix A in directed graphs, the in-degree and out-degree distribution are no longer equal to the stationary distribution.
In this paper, we focus on the strongly connected graph, which is corresponding to the irreducible Markov Chain, and develop a digraph spectral clustering algorithm to solve the sensor node validation problem. The main contributions of this paper are summarized below.
To our knowledge, this is the first work to investigate the sensor node validation as digraph spectral clustering problem. We develop theoretical results that introduce a digraph spectral clustering algorithm without losing the information of directed links among sensors. By evaluating our algorithm and the traditional undirected graph based spectral clustering algorithm on randomly generated large-scale synthetic data, we show a significant promotion in terms of the sensor node detection accuracy.
This paper is organized as follows. Section 2 formally defines the sensor node validation problem. In Section 3, we introduce the generalized digraph spectral clustering algorithm. In Section 4, we provide extensive evaluation results that demonstrate the efficiency and effectiveness of our proposed digraph spectral clustering algorithm. We briefly introduce the related works below in Section 5. We conclude our paper and outline the future works in Section 6.
2. Problem Definition
Given a sensor network with n static sensor nodes, denoted as
Assume that properly working sensors of similar properties, such as radio and antenna characteristics, node environments, and power usage, will report similar measurements of RSS. Thus, those working sensors are called “good sensors” and other sensors that do not report proper measurements “bad sensors.” We illustrate these terminologies using a simple example, where sensors are indexed by their antenna orientations. In this case, nearby sensors are those which have similar antenna polarizations. Suppose that RSS values reported by a sensor to one of its neighbors correlate with the matching degree of their antenna polarizations. Then, nearby sensors, which are in good working condition, are expected to report similar RSS measurements on the same neighbor.
The sensor node validation problem in fact aims to find those “bad sensors” by detecting anomaly connection patterns received from “bad sensors.” To be precise, to identify bad sensors, we need to solve the problem of determining whether a sensor belongs to a cluster of nearby sensors. We assume that there are plentiful sensors so that clusters of nearby sensors will be large. A sensor is considered as a bad one if the sensor is in a small unique cluster or the sensor is in a small out-of-place component of a large cluster. As illustrated in [1], this can be achieved by applying spectral clustering algorithm. However, different from [1], in reality, the adjacency matrix A, in general, is asymmetric; namely,
3. Digraph Spectral Clustering Algorithm
In this section, we develop digraph spectral clustering algorithm for strongly connected digraphs by introducing the generalized objective function as
3.1. Generalized Objective Function
While using

Detailed descriptions for the extension are presented in the following section.
3.2. Design of Digraph Spectral Clustering Algorithm
In this section, we will generalize the spectral clustering algorithm using the generalized random walk theory on digraphs.
Spectral clustering is one of the most popular modern clustering algorithms, with wide applications in distributed computing systems. For example, in [7, 8], spectral clustering is used to estimate the wireless transmission cost in wireless networks.
So far, most published spectral algorithms operate on symmetric matrices. However, there are important cases when data points have pairwise relationships that are not symmetric. The link delivery probabilities in wireless network, economic transactions, and internet communications are often asymmetric. The commonly used approach for spectral clustering link data is to obtain a symmetric matrix
Now, we are in the position to introduce how our generalized normalized Laplacian matrix can be used to address the above two problems in digraph based spectral clustering algorithms.
Given a strongly connected directed graph
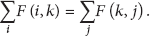
In [10], Chung proves that
The circulation essentially interprets that, for each random walk state, the in-flow traffic is equal to the out-flow traffic, even though the digraph edge weights are not symmetric. Therefore, given a graph partition
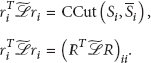
Definition 1 (CCut of digraph partition).
For a two-components digraph partition

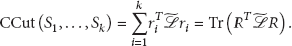
For a digraph partition with k disjoint components

Note that one has the following.
The
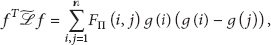
In digraphs, the generalized normalized Laplacian matrix
Theorem 2.
For any column vector
Proof.
Consider

Given a partition of

Then, we set the matrix
Hence, we have
Using the similar optimization formulation as [11], we can write the problem of minimizing

We relax the problem by allowing the entries of matrix of matrix R to take arbitrary real values. Then, the relaxed problem becomes

This is the standard form of a trace minimization problem, and Rayleigh-Ritz theorem [12] tells us that the solution is given by choosing R as the matrix which contains the first k eigenvectors corresponding to the k smallest eigenvalues of
Therefore, we obtain Algorithm 1.
(1) Construct the one hop probability matrix P for Graph G; (2) Compute the generalized normalized laplacian (3) Compute the first k eigenvectors (4) Let indicator matrix R be the matrix containing the vectors (5) Use the k-means algorithm on the rows of the R, and cluster V into
How to choose k is a general problem for all clustering algorithms. The goal is to choose the number k, such that all eigenvalues of
4. Evaluation
In this section, we conduct extensive evaluations on the performance of our proposed sensor validation algorithm.
4.1. Evaluation Settings
We consider a sensor network with
In the evaluation we vary the size of bad node set b from
4.2. Evaluation Results
Figure 1 shows the results on how the number of bad nodes impacts the detection accuracy when using our digraph clustering algorithm and tradition spectral clustering algorithm. We observe that, as the number of “bad” nodes increases, the detection accuracy decreases almost linearly for both our digraph spectral clustering algorithm and the traditional spectral clustering algorithm. This happens because, as the more “bad nodes” exist, the harder it is for the clustering algorithms to detect them, where the malfunctioning nodes may coexist and dominate a neighborhood of sensor nodes and make the detection become harder. Overall, our method consistently outperforms the traditional method with 19% to 41% more detection accuracy.

The impact of number of “bad” nodes.
Figure 2 shows the results of how the change ratio on RSS affects the detection accuracy when using our digraph clustering algorithm and tradition spectral clustering algorithm. We observe that, as the change rate on RSS increases from 0.1 to 0.5, the detection accuracy of both our digraph spectral clustering method and the traditional spectral clustering method increases, which is because larger changes on RSS leads to higher dissimilarity between “bad nodes” and “good” nodes. Moreover, our method achieves 22% to 34% more detection accuracy over the traditional method.

The impact of change rate on RSS.
5. Related Work
In this paper, we develop generalized digraph spectral clustering algorithm for sensor status validation in distributed sensor networks. The related work for sensor node status validation has been discussed in the previous section, where in the section we primarily introduce the state-of-the-art spectral clustering methods. Spectral clustering is mainly employed in data mining and machining learning areas [14–19], where a few studies have attempted to extend the spectral clustering algorithms to digraph setting, for example, [7–9, 19–25]. However, while being applied to solve sensor status validation problem, these works have two fundamental drawbacks: (1) loss of information by symmetrizing the adjacency matrix or Laplacian matrix and (2) asymmetric cuts in digraphs.
The Loss of Information by Symmetrization of A
or L. The algorithms proposed in [19, 20, 24] symmetrize the adjacency matrix or Laplacian matrix, so the traditional spectral clustering algorithm (for undirected graph)
In particular, in [9] by Zhou et al., they define the same cut function as
Asymmetric Cuts in Digraphs. The directionality of directed links is crucial information, where [23–25] define the cluster cut in an asymmetric fashion. In digraph, given a partition
6. Conclusion
In this paper we propose a generalized digraph spectral clustering algorithm for validating sensor status in distributed sensor networks. The proposed DSC algorithm considers the network flow circulation while performing the sensor node clustering; thus it preserves the directed link information, which is lost in the traditional spectral clustering method. In our extensive simulations, digraph spectral clustering algorithm demonstrates 19% to 41% mode detection accuracy over the traditional spectral clustering based method.
There exist several future directions. Firstly, we are planning to explore the applicability of digraph spectral clustering algorithm in other scenarios, for example, social network community detection, and so forth. Secondly, when the sensor network size scales up, a real-time statistical query for the number of “bad” nodes becomes time consuming. In this case, we consider applying sampling techniques [26–34] to perform fast and accurate estimation for it. Last but not least, we are interested in applying our digraph spectral graph method to detect node and link failures in large-scale cloud computing environments [35–38].
Footnotes
Conflict of Interests
The authors declare that there is no conflict of interests regarding the publication of this paper.
Acknowledgment
This work is partially supported by the 863 National Hi-tech Research and Development Program (2011AA01A103).